🔥 Would you like to save this?
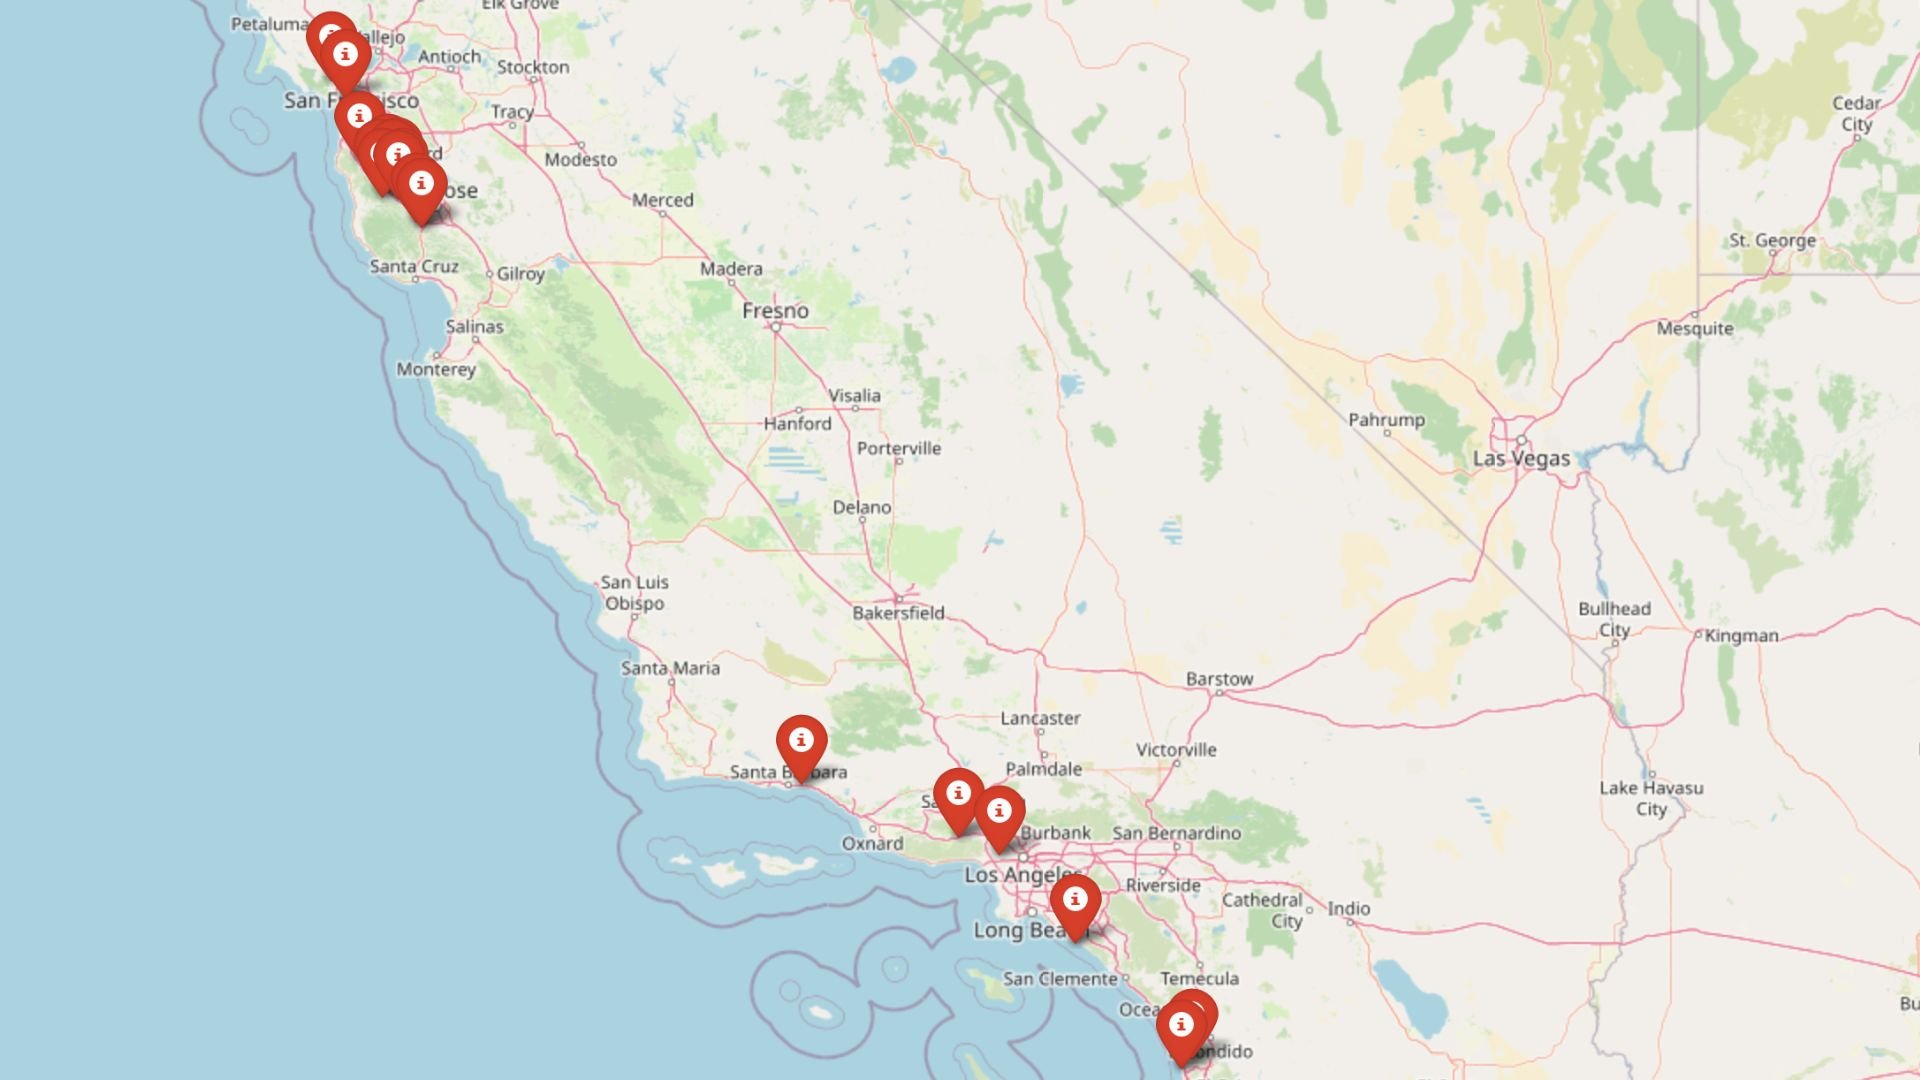
The Zillow Home Value Index is setting new records in California’s most exclusive towns. As of June 2025, home prices in these 18 elite markets have climbed into jaw-dropping territory—many soaring past $4 million. Backed by deep-pocketed buyers and relentless demand, these communities stretch from Silicon Valley hideaways to ocean-view estates in Malibu, each more coveted (and costly) than the last. Some were driven sky-high by pandemic-era surges, others by decades of entrenched prestige—but all are snapshots of California living at its most aspirational.
18. Stanford – 177% Home Price Increase Since 2010
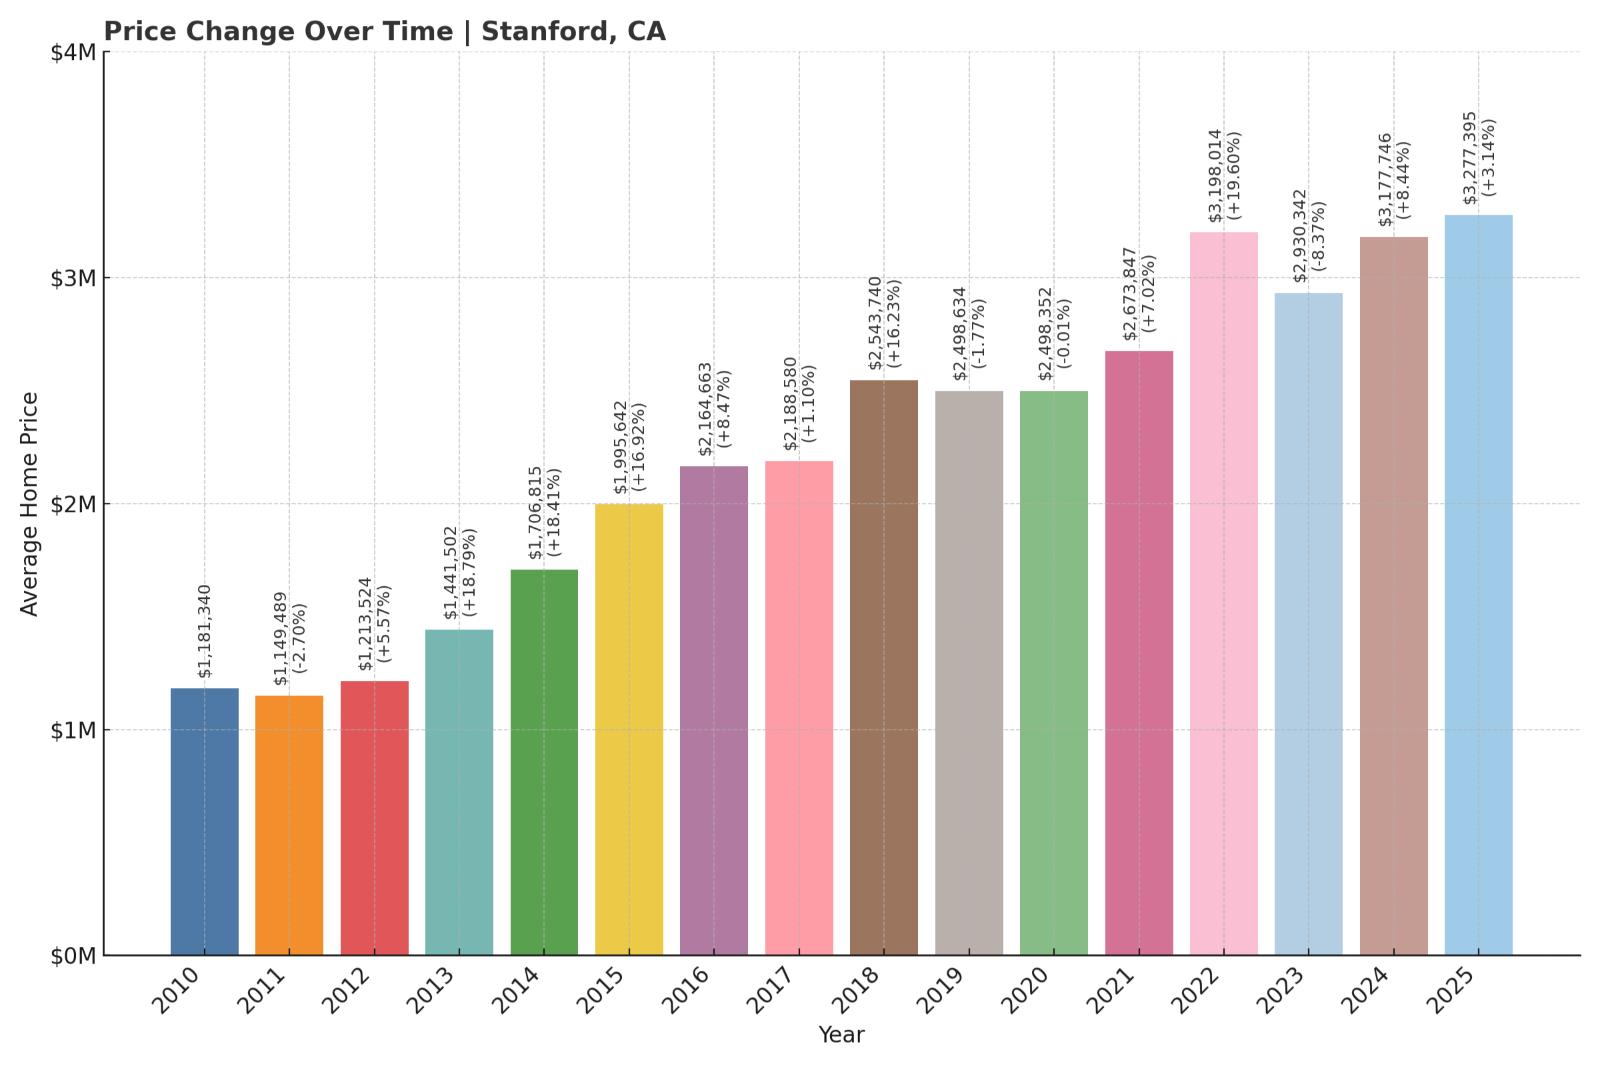
- 2010: $1,181,340
- 2011: $1,149,489 ($-31,851, -2.70% from previous year)
- 2012: $1,213,524 (+$64,034, +5.57% from previous year)
- 2013: $1,441,502 (+$227,978, +18.79% from previous year)
- 2014: $1,706,815 (+$265,313, +18.41% from previous year)
- 2015: $1,995,642 (+$288,827, +16.92% from previous year)
- 2016: $2,164,663 (+$169,021, +8.47% from previous year)
- 2017: $2,188,580 (+$23,917, +1.10% from previous year)
- 2018: $2,543,740 (+$355,160, +16.23% from previous year)
- 2019: $2,498,634 ($-45,106, -1.77% from previous year)
- 2020: $2,498,352 ($-282, -0.01% from previous year)
- 2021: $2,673,847 (+$175,495, +7.02% from previous year)
- 2022: $3,198,014 (+$524,166, +19.60% from previous year)
- 2023: $2,930,342 ($-267,671, -8.37% from previous year)
- 2024: $3,177,746 (+$247,403, +8.44% from previous year)
- 2025: $3,277,395 (+$99,649, +3.14% from previous year)
Home values in Stanford have climbed 177% since 2010, reaching over $3.2 million in 2025. The town saw major gains during the mid-2010s, with year-over-year increases consistently above 15% from 2013 to 2015. Although values dipped slightly in 2019 and again in 2023, they recovered quickly. The average home price is now well above pre-pandemic levels, underscoring the area’s enduring appeal.
In order to come up with the very specific design ideas, we create most designs with the assistance of state-of-the-art AI interior design software.
Stanford – Education and Exclusivity Drive Demand
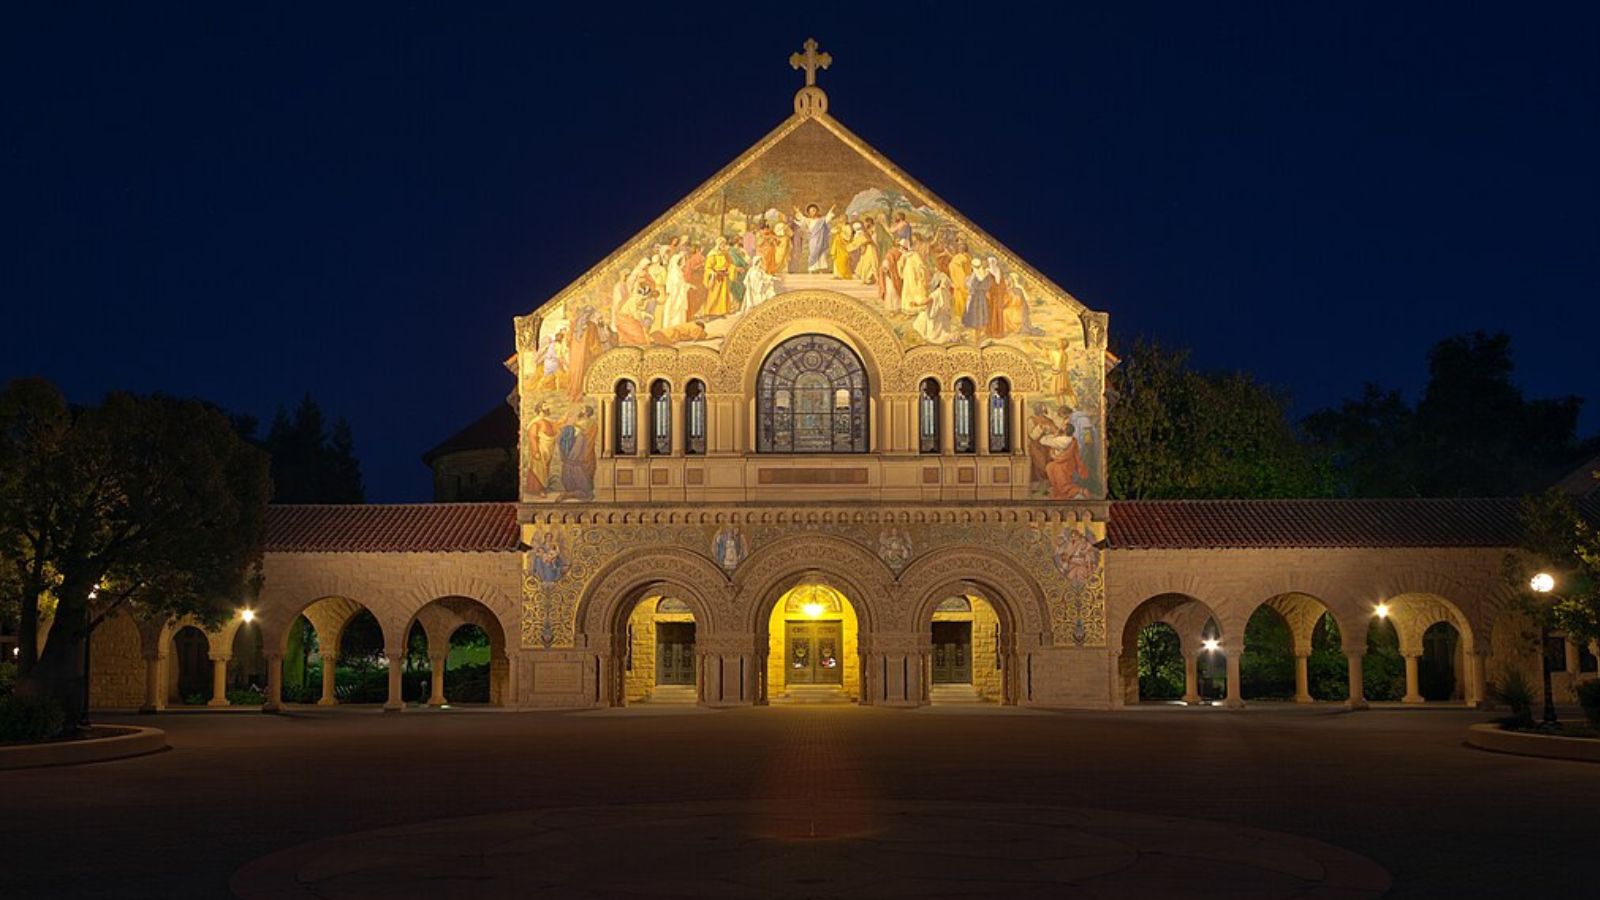
Stanford is best known as the home of Stanford University, one of the most prestigious institutions in the world. The town itself is small and primarily residential, with homes often owned by faculty or deeply connected to the academic community. Its location at the heart of Silicon Valley, bordered by Palo Alto and Menlo Park, makes it a prime destination for tech executives and investors seeking quiet, upscale neighborhoods close to innovation hubs.
Despite market fluctuations in recent years, the limited housing stock and high demand continue to push prices upward. Stanford’s exclusivity, combined with its unique academic and geographic placement, keeps it firmly among California’s most expensive places to live.
17. Newport Beach – 157% Home Price Increase Since 2010
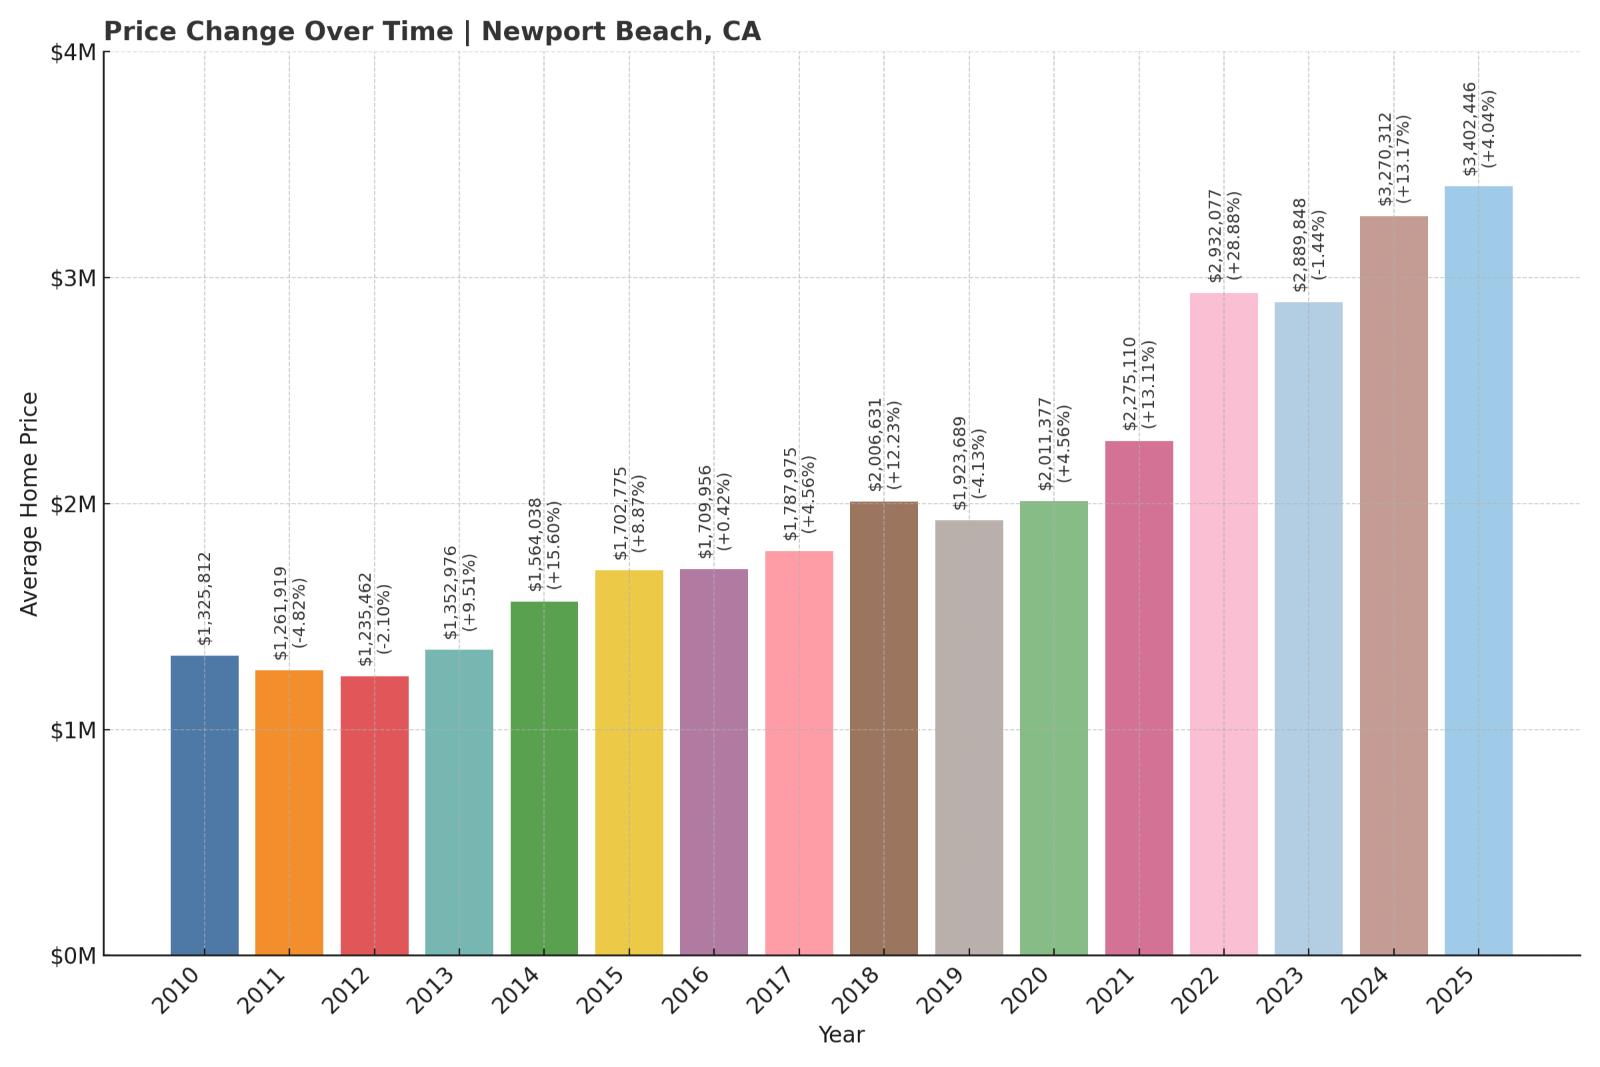
- 2010: $1,325,812
- 2011: $1,261,919 ($-63,893, -4.82% from previous year)
- 2012: $1,235,462 ($-26,457, -2.10% from previous year)
- 2013: $1,352,976 (+$117,514, +9.51% from previous year)
- 2014: $1,564,038 (+$211,062, +15.60% from previous year)
- 2015: $1,702,775 (+$138,737, +8.87% from previous year)
- 2016: $1,709,956 (+$7,181, +0.42% from previous year)
- 2017: $1,787,975 (+$78,020, +4.56% from previous year)
- 2018: $2,006,631 (+$218,656, +12.23% from previous year)
- 2019: $1,923,689 ($-82,943, -4.13% from previous year)
- 2020: $2,011,377 (+$87,688, +4.56% from previous year)
- 2021: $2,275,110 (+$263,733, +13.11% from previous year)
- 2022: $2,932,077 (+$656,967, +28.88% from previous year)
- 2023: $2,889,848 ($-42,229, -1.44% from previous year)
- 2024: $3,270,312 (+$380,464, +13.17% from previous year)
- 2025: $3,402,446 (+$132,134, +4.04% from previous year)
Newport Beach home prices have surged 157% since 2010, with a major jump in 2022 followed by solid growth through 2025. The city saw some brief declines in the early 2010s and again in 2019 and 2023, but values have rebounded strongly. With an average home price now over $3.4 million, Newport Beach continues to be one of the most sought-after coastal destinations in California.
Newport Beach – Coastal Luxury With Broad Appeal
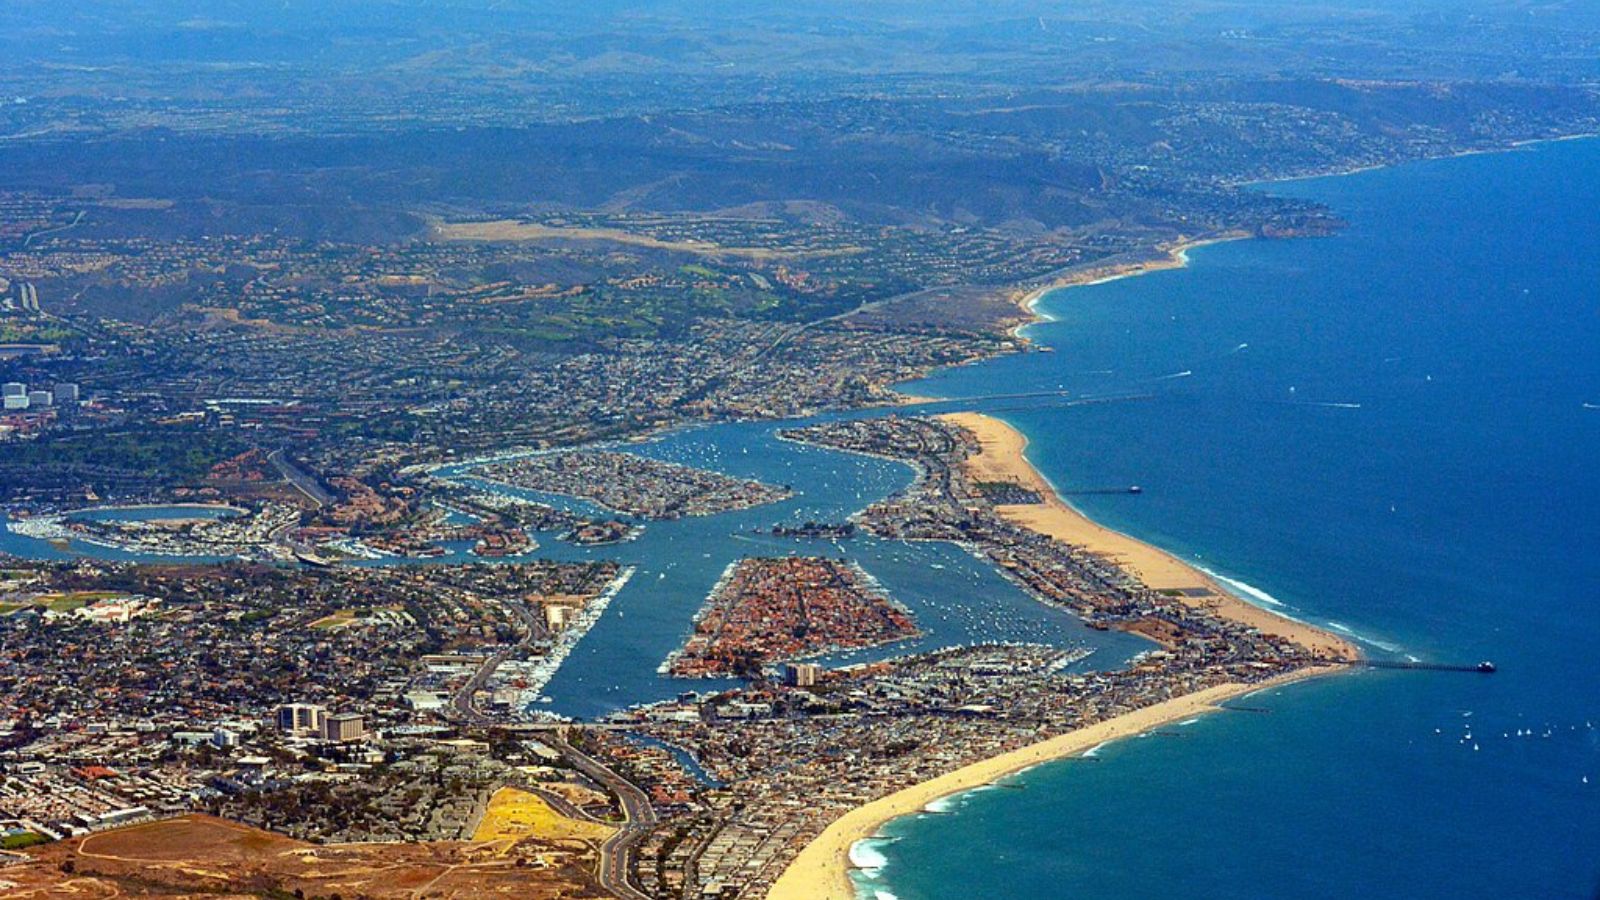
Situated in Orange County, Newport Beach offers a luxurious coastal lifestyle, complete with yacht clubs, high-end shopping, and some of the best ocean views in Southern California. Its real estate market includes everything from beachfront villas to gated estates, drawing buyers from across the state and around the world. The city’s thriving tourism and strong local economy also contribute to property demand.
While the broader Southern California market has cooled slightly post-pandemic, Newport Beach’s desirability has remained intact. Limited supply, ocean access, and an affluent buyer base keep prices elevated year after year.
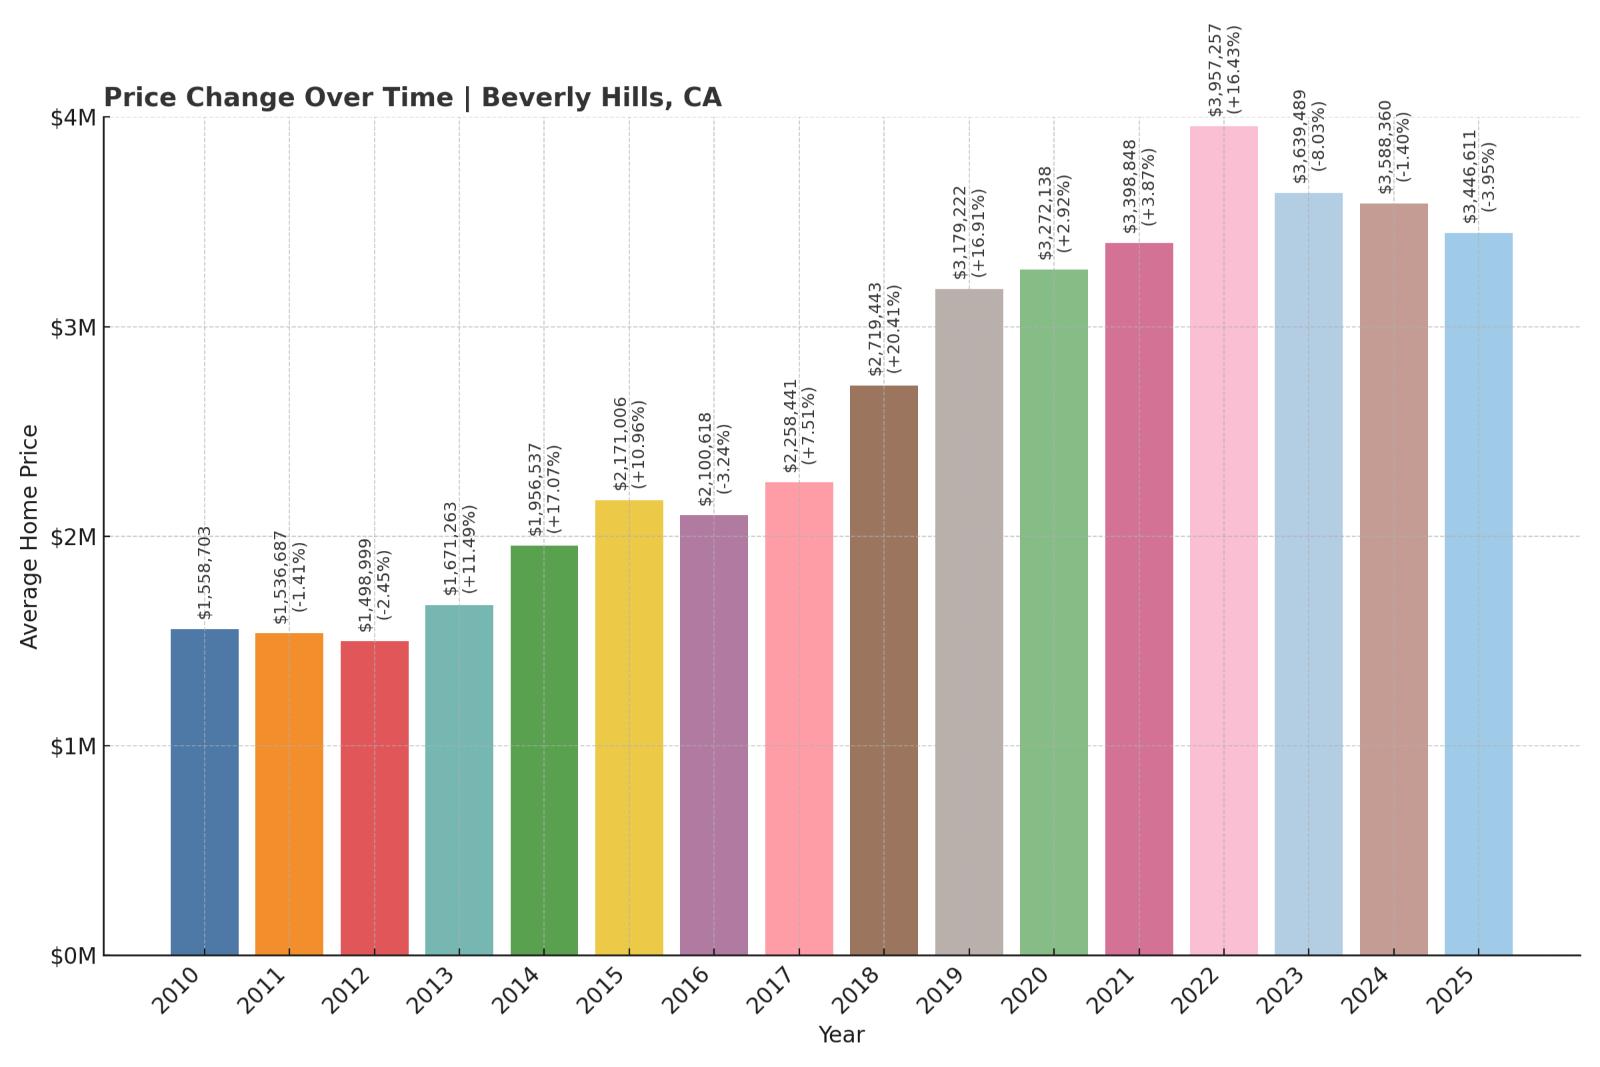
16. Beverly Hills – 121% Home Price Increase Since 2010
- 2010: $1,558,703
- 2011: $1,536,687 ($-22,016, -1.41% from previous year)
- 2012: $1,498,999 ($-37,688, -2.45% from previous year)
- 2013: $1,671,263 (+$172,264, +11.49% from previous year)
- 2014: $1,956,537 (+$285,275, +17.07% from previous year)
- 2015: $2,171,006 (+$214,469, +10.96% from previous year)
- 2016: $2,100,618 ($-70,389, -3.24% from previous year)
- 2017: $2,258,441 (+$157,824, +7.51% from previous year)
- 2018: $2,719,443 (+$461,002, +20.41% from previous year)
- 2019: $3,179,222 (+$459,779, +16.91% from previous year)
- 2020: $3,272,138 (+$92,916, +2.92% from previous year)
- 2021: $3,398,848 (+$126,711, +3.87% from previous year)
- 2022: $3,957,257 (+$558,409, +16.43% from previous year)
- 2023: $3,639,489 ($-317,769, -8.03% from previous year)
- 2024: $3,588,360 ($-51,129, -1.40% from previous year)
- 2025: $3,446,611 ($-141,749, -3.95% from previous year)
Home prices in Beverly Hills have risen over 121% since 2010, although values have dipped for three consecutive years since their 2022 peak. The city’s median price reached nearly $4 million in 2022 but has gradually edged downward. Even so, Beverly Hills remains one of California’s top-tier luxury markets with unmatched global recognition.
Beverly Hills – Hollywood Prestige Still Commands Premiums
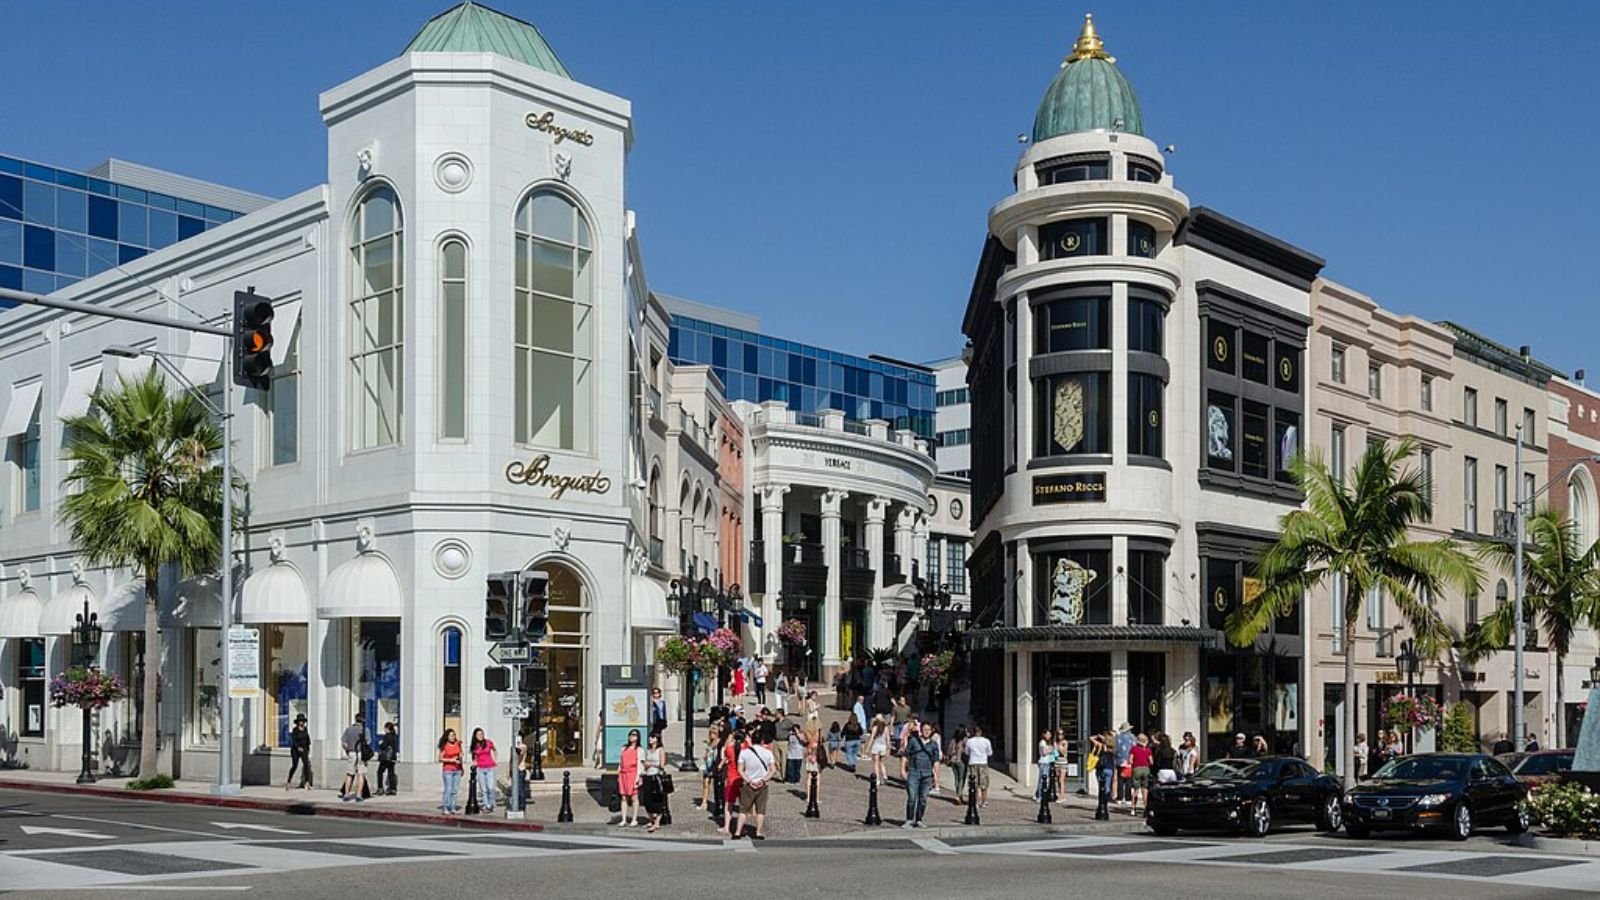
Beverly Hills stands as a symbol of wealth and celebrity living. Iconic zip codes like 90210, upscale shopping along Rodeo Drive, and its proximity to the entertainment industry have made it a perennial hotspot for luxury real estate. The homes here often include sprawling estates, private compounds, and cutting-edge architecture.
While other luxury markets saw larger post-pandemic spikes, Beverly Hills has shown more gradual appreciation with occasional pullbacks. Recent price softening suggests some buyer caution, but long-term demand for its brand of high-end living remains rock solid.
15. Del Mar – 187% Home Price Increase Since 2010

- 2010: $1,258,995
- 2011: $1,371,609 (+$112,615, +8.94% from previous year)
- 2012: $1,416,351 (+$44,741, +3.26% from previous year)
- 2013: $1,604,416 (+$188,065, +13.28% from previous year)
- 2014: $1,814,998 (+$210,582, +13.13% from previous year)
- 2015: $2,002,246 (+$187,247, +10.32% from previous year)
- 2016: $2,240,120 (+$237,874, +11.88% from previous year)
- 2017: $2,294,907 (+$54,787, +2.45% from previous year)
- 2018: $2,403,743 (+$108,836, +4.74% from previous year)
- 2019: $2,397,950 ($-5,793, -0.24% from previous year)
- 2020: $2,389,204 ($-8,746, -0.36% from previous year)
- 2021: $2,731,663 (+$342,459, +14.33% from previous year)
- 2022: $3,590,209 (+$858,545, +31.43% from previous year)
- 2023: $3,418,968 ($-171,240, -4.77% from previous year)
- 2024: $3,664,325 (+$245,357, +7.18% from previous year)
- 2025: $3,617,723 ($-46,603, -1.27% from previous year)
Del Mar has posted a 187% home value increase since 2010, with its biggest leap coming in 2022. Prices peaked above $3.6 million in 2024 before a minor dip this past year. Overall, this coastal town has seen steady appreciation over the past decade, driven by its beachside allure and tight housing supply.
Del Mar – A Surfside Market With Sky-High Prices
Located in San Diego County, Del Mar offers a mix of beach-town charm and luxury living. Known for its racetrack, historic downtown, and stunning oceanfront properties, the area appeals to both affluent year-round residents and second-home buyers. Its walkability and panoramic coastal views add to its premium pricing.
The steep increase during the pandemic era reflects the town’s desirability as a work-from-home haven. While prices dipped slightly in 2023 and 2025, Del Mar remains one of the most exclusive markets in Southern California.
14. Palo Alto – 176% Home Price Increase Since 2010
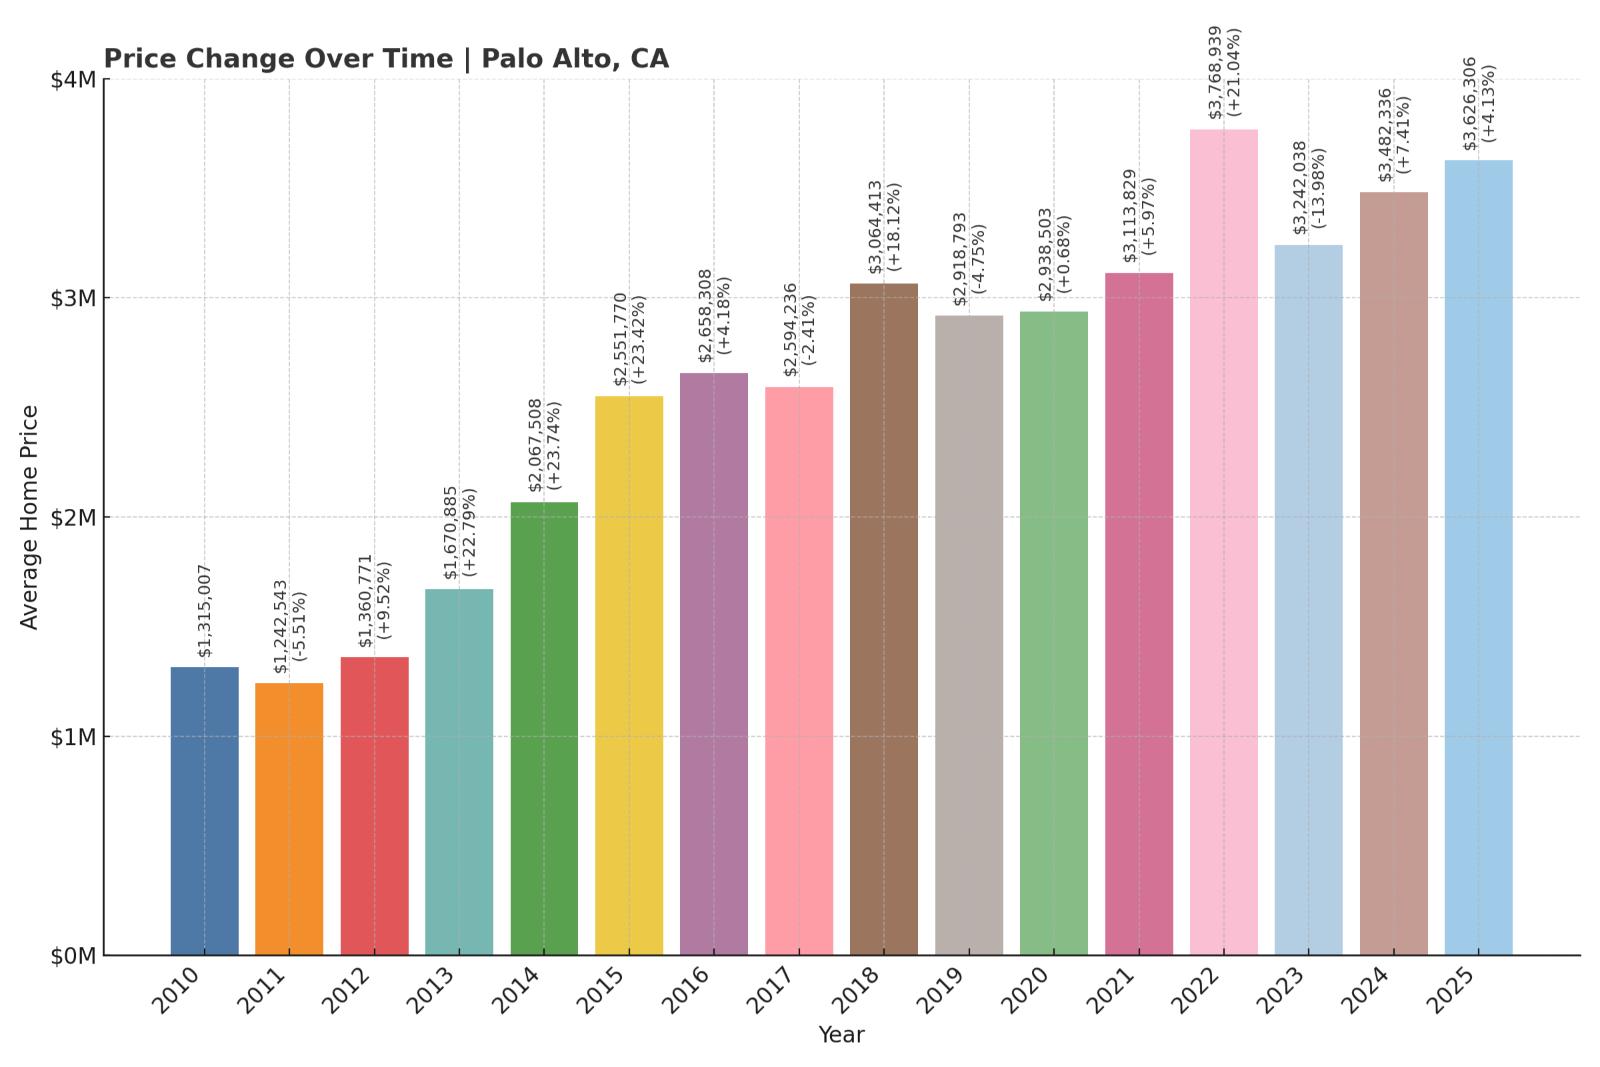
- 2010: $1,315,007
- 2011: $1,242,543 ($-72,463, -5.51% from previous year)
- 2012: $1,360,771 (+$118,227, +9.51% from previous year)
- 2013: $1,670,885 (+$310,114, +22.79% from previous year)
- 2014: $2,067,508 (+$396,623, +23.74% from previous year)
- 2015: $2,551,770 (+$484,262, +23.42% from previous year)
- 2016: $2,658,308 (+$106,538, +4.18% from previous year)
- 2017: $2,594,236 ($-64,072, -2.41% from previous year)
- 2018: $3,064,413 (+$470,177, +18.12% from previous year)
- 2019: $2,918,793 ($-145,620, -4.75% from previous year)
- 2020: $2,938,503 (+$19,710, +0.68% from previous year)
- 2021: $3,113,829 (+$175,326, +5.97% from previous year)
- 2022: $3,768,939 (+$655,111, +21.04% from previous year)
- 2023: $3,242,038 ($-526,902, -13.98% from previous year)
- 2024: $3,482,336 (+$240,298, +7.41% from previous year)
- 2025: $3,626,306 (+$143,970, +4.13% from previous year)
Palo Alto home prices have soared by 176% since 2010. While prices dipped in 2017, 2019, and significantly in 2023, they’ve quickly rebounded. The town crossed the $3.5 million threshold again in 2024 and continues to climb into 2025.
Palo Alto – The Heart of Tech Wealth
Palo Alto is the epicenter of Silicon Valley, home to Stanford University and the headquarters of giants like Hewlett-Packard and VMware. Its tech industry roots and world-class school system have long made it a hotbed of real estate activity, particularly among startup founders and venture capitalists.
Even with the downturns, demand remains consistently high, and new development is limited. As the tech economy stabilizes post-pandemic, Palo Alto’s market continues to regain momentum, pushing prices higher again in 2025.
13. Ross – 81% Home Price Increase Since 2010
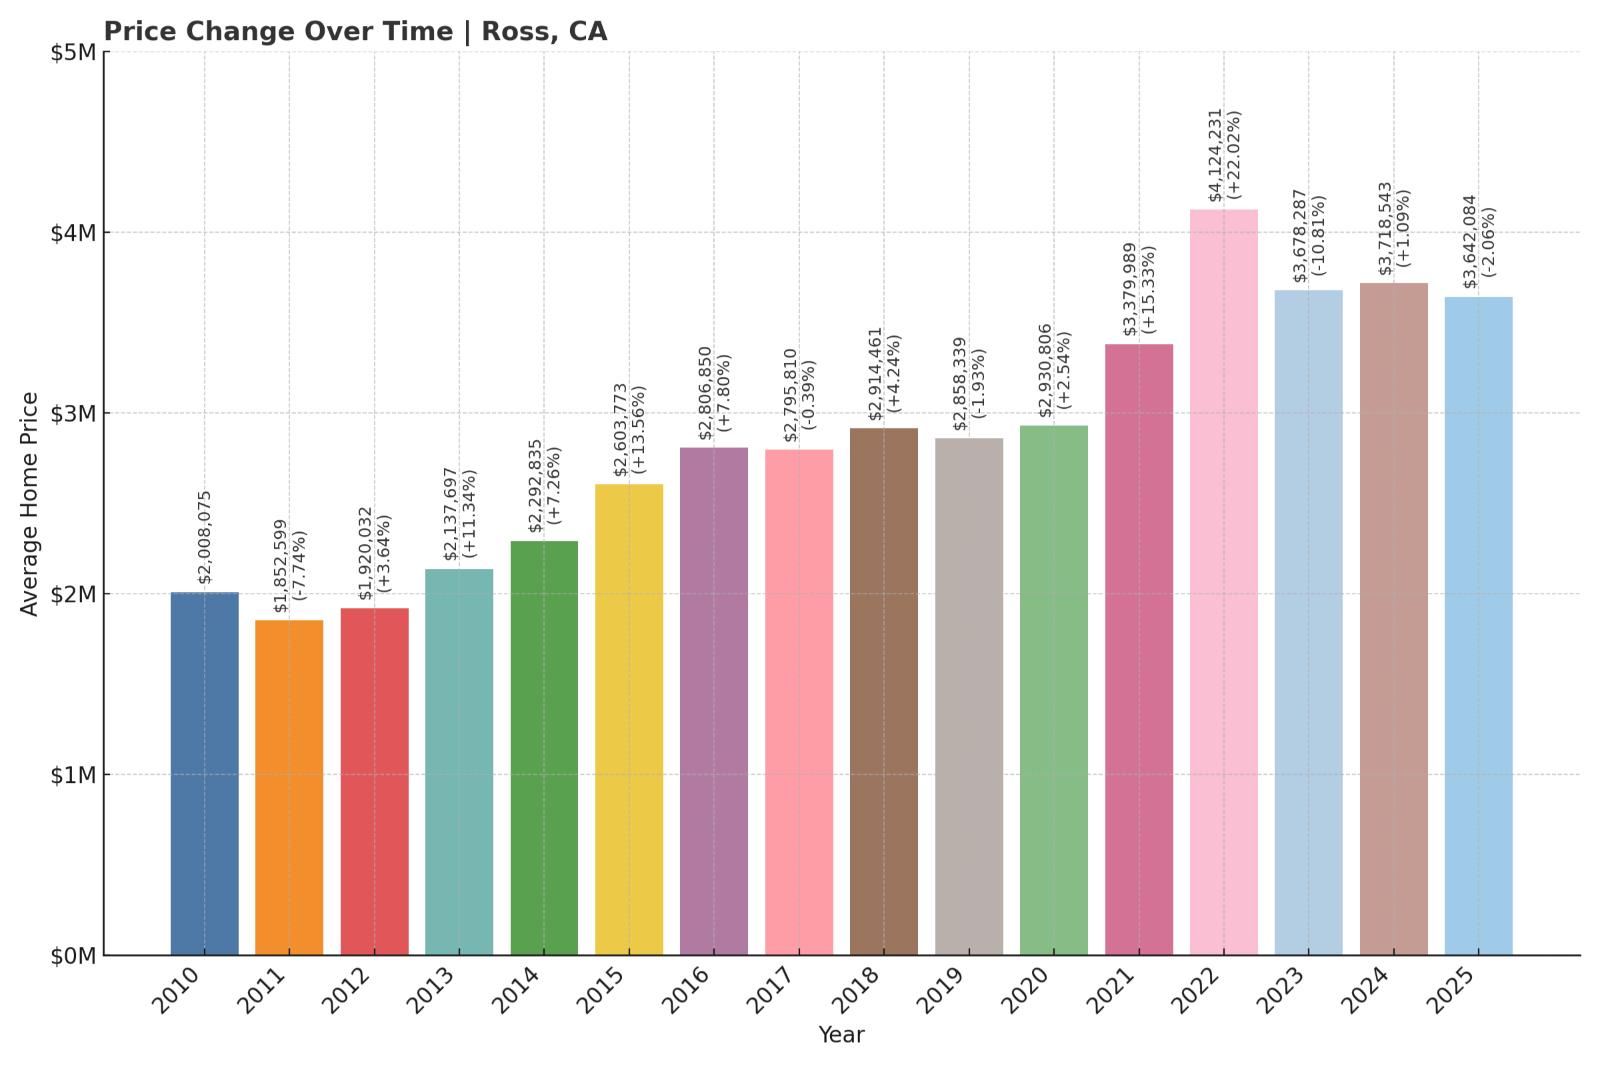
- 2010: $2,008,075
- 2011: $1,852,599 ($-155,475, -7.74% from previous year)
- 2012: $1,920,032 (+$67,432, +3.64% from previous year)
- 2013: $2,137,697 (+$217,665, +11.34% from previous year)
- 2014: $2,292,835 (+$155,138, +7.26% from previous year)
- 2015: $2,603,773 (+$310,937, +13.56% from previous year)
- 2016: $2,806,850 (+$203,077, +7.80% from previous year)
- 2017: $2,795,810 ($-11,040, -0.39% from previous year)
- 2018: $2,914,461 (+$118,651, +4.24% from previous year)
- 2019: $2,858,339 ($-56,122, -1.93% from previous year)
- 2020: $2,930,806 (+$72,466, +2.54% from previous year)
- 2021: $3,379,989 (+$449,184, +15.33% from previous year)
- 2022: $4,124,231 (+$744,242, +22.02% from previous year)
- 2023: $3,678,287 ($-445,944, -10.81% from previous year)
- 2024: $3,718,543 (+$40,256, +1.09% from previous year)
- 2025: $3,642,084 ($-76,460, -2.06% from previous year)
Ross has seen a total home price increase of 81% since 2010. While not as dramatic as some other towns in this ranking, the town experienced a major boom during 2021 and 2022, followed by some price corrections in 2023 and 2025. Despite recent softening, values remain above $3.6 million.
Ross – Tranquil, Private, and Highly Prized
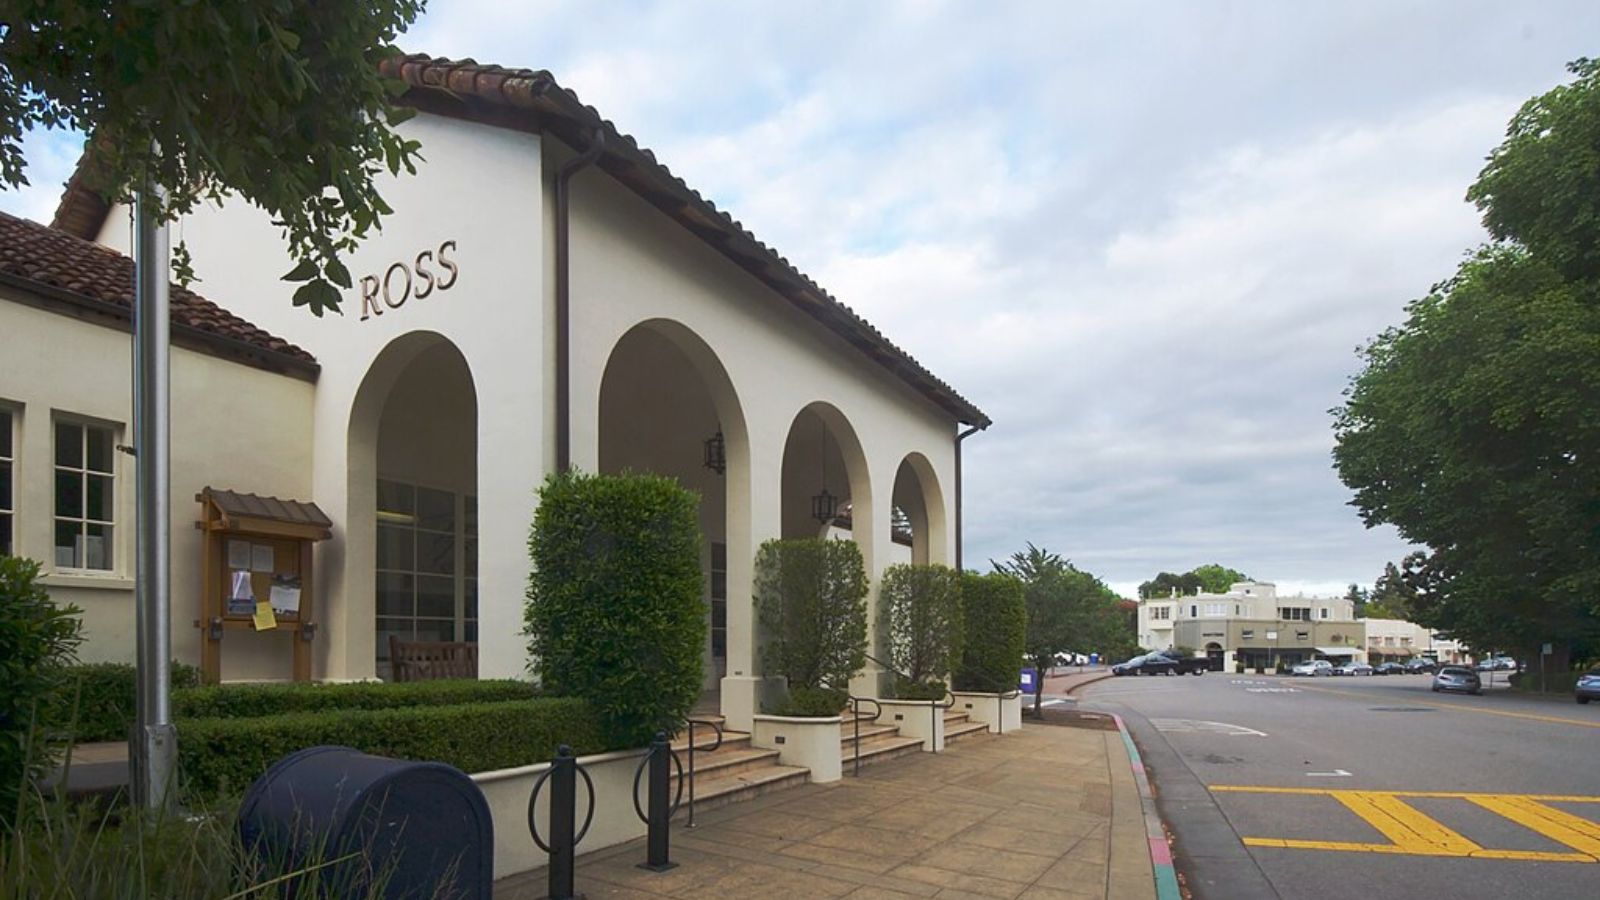
Ross is a quiet, leafy town nestled in Marin County, north of San Francisco. With large lots, estate-style homes, and scenic surroundings, it has long attracted wealthy families seeking privacy and proximity to the city. The Branson School, a prestigious private institution, adds to the town’s reputation for exclusivity.
Ross isn’t a flashy market, but it’s consistent. Demand surged during the remote work boom, when buyers prioritized space and peace over proximity to office hubs. Though prices have eased slightly, Ross’s serene environment and architectural appeal continue to command a premium.
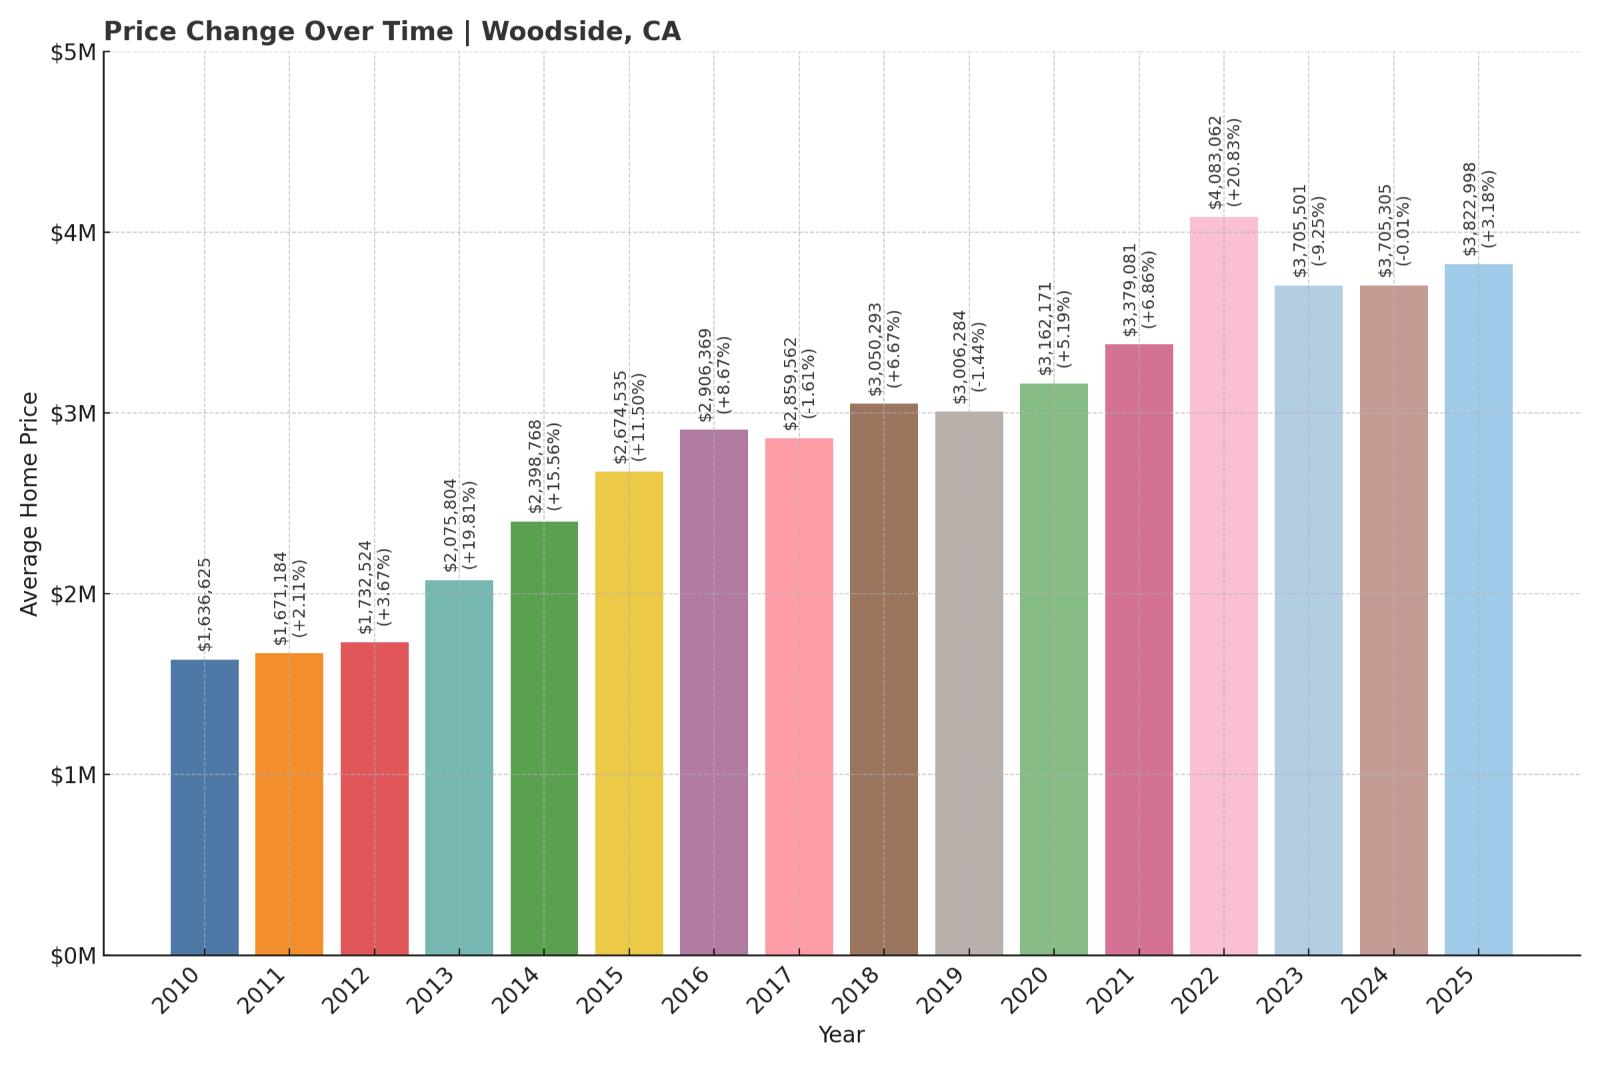
12. Woodside – 134% Home Price Increase Since 2010
🔥 Would you like to save this?
- 2010: $1,636,625
- 2011: $1,671,184 (+$34,558, +2.11% from previous year)
- 2012: $1,732,524 (+$61,340, +3.67% from previous year)
- 2013: $2,075,804 (+$343,280, +19.81% from previous year)
- 2014: $2,398,768 (+$322,965, +15.56% from previous year)
- 2015: $2,674,535 (+$275,767, +11.50% from previous year)
- 2016: $2,906,369 (+$231,834, +8.67% from previous year)
- 2017: $2,859,562 ($-46,807, -1.61% from previous year)
- 2018: $3,050,293 (+$190,730, +6.67% from previous year)
- 2019: $3,006,284 ($-44,009, -1.44% from previous year)
- 2020: $3,162,171 (+$155,887, +5.19% from previous year)
- 2021: $3,379,081 (+$216,909, +6.86% from previous year)
- 2022: $4,083,062 (+$703,981, +20.83% from previous year)
- 2023: $3,705,501 ($-377,560, -9.25% from previous year)
- 2024: $3,705,305 ($-196, -0.01% from previous year)
- 2025: $3,822,998 (+$117,693, +3.18% from previous year)
Woodside home values have more than doubled since 2010, climbing 134% to reach over $3.8 million in 2025. Although the town experienced notable dips in 2023 and held flat in 2024, it posted a modest rebound this year. The long-term trend shows steady growth with occasional volatility.
Woodside – Tech Retreats and Horse Country
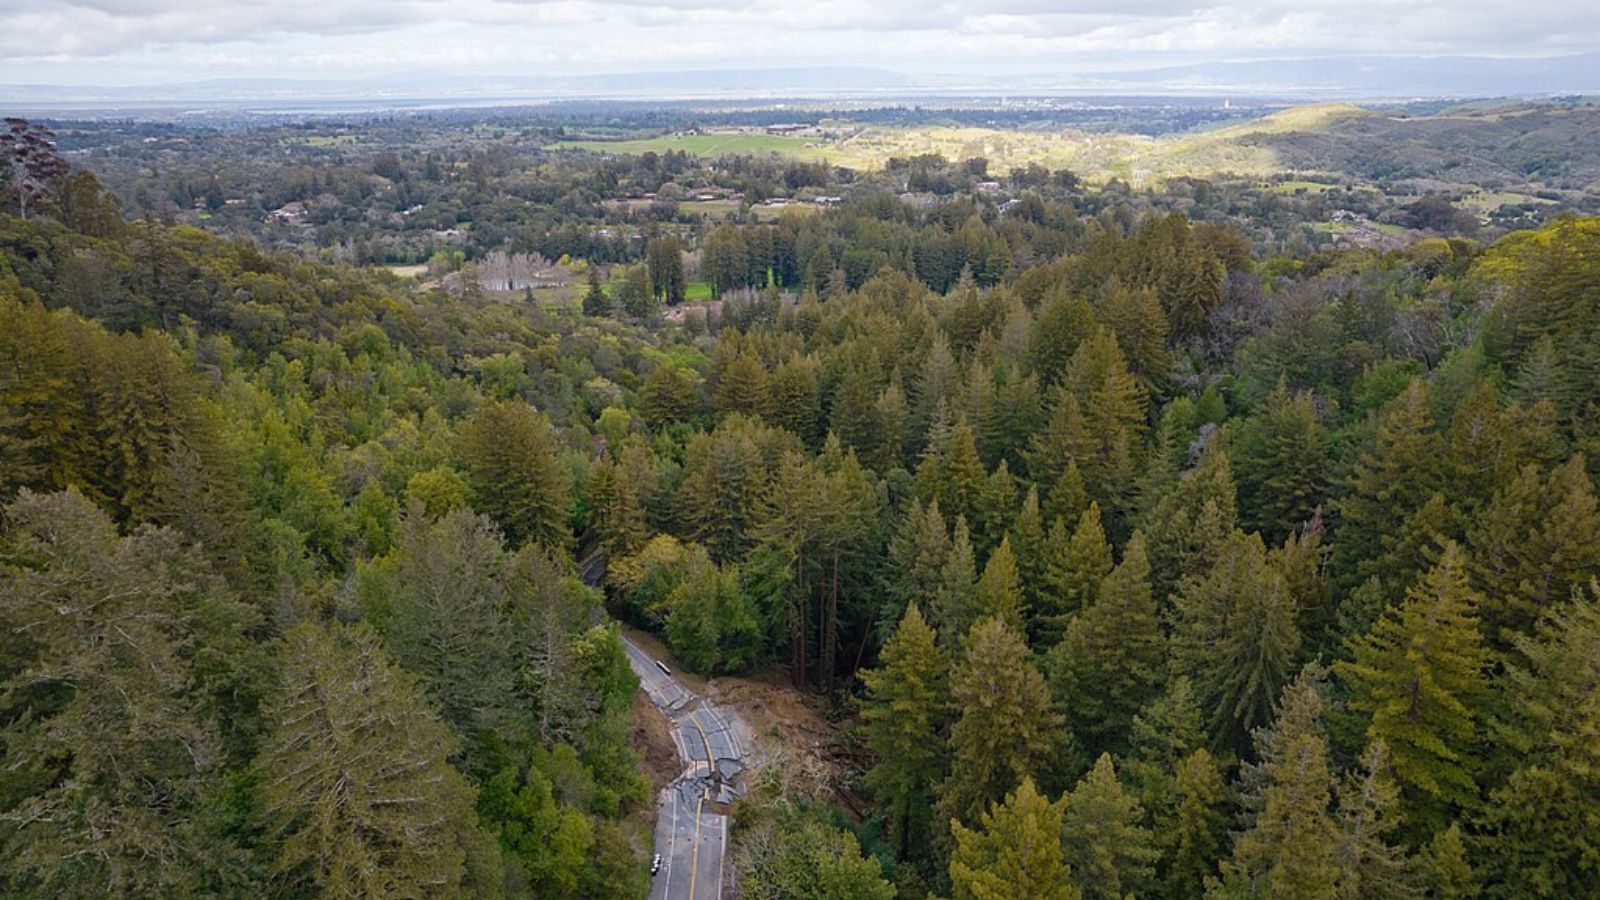
Woodside sits in the wooded hills of San Mateo County, popular among tech executives and venture capitalists for its sprawling estates and equestrian facilities. It’s close to major tech campuses, but its semi-rural charm and privacy set it apart from busier neighboring towns.
Homes here are often large and custom-built, with room for stables, orchards, and elaborate gardens. While not immune to economic cycles, the town’s elite appeal and restrictive zoning mean demand routinely outpaces supply, keeping values high over the long haul.
11. Saratoga – 198% Home Price Increase Since 2010
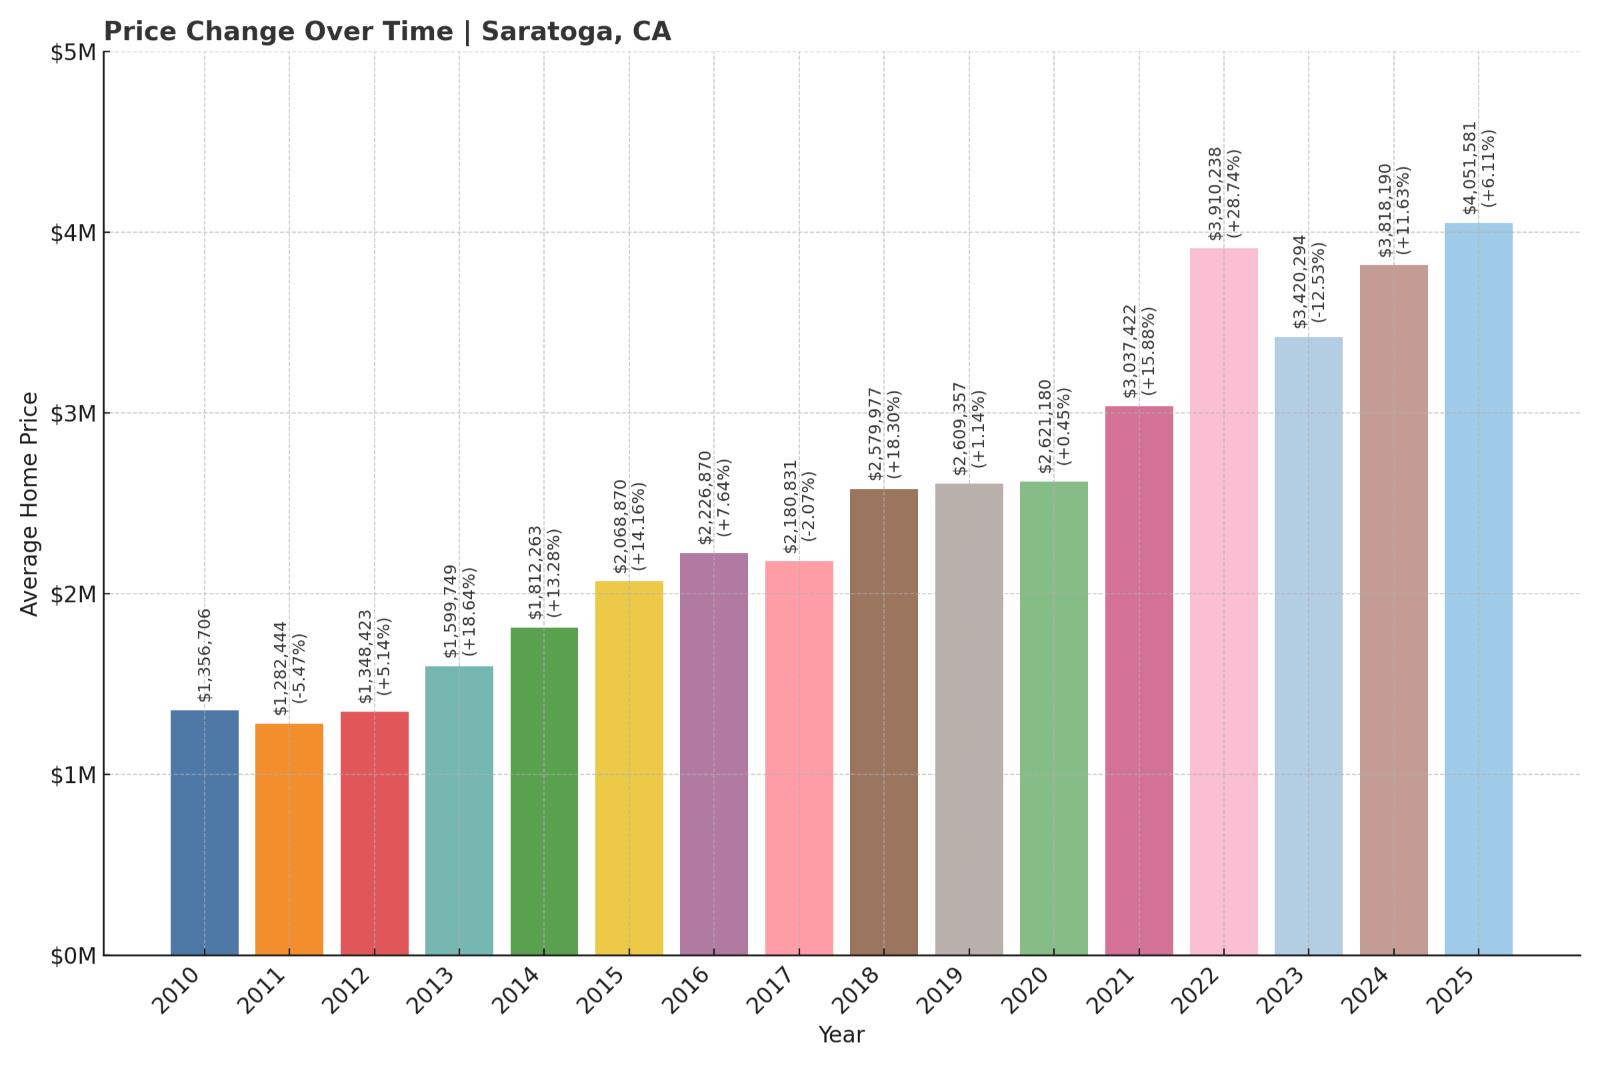
- 2010: $1,356,706
- 2011: $1,282,444 ($-74,263, -5.47% from previous year)
- 2012: $1,348,423 (+$65,980, +5.14% from previous year)
- 2013: $1,599,749 (+$251,325, +18.64% from previous year)
- 2014: $1,812,263 (+$212,514, +13.28% from previous year)
- 2015: $2,068,870 (+$256,608, +14.16% from previous year)
- 2016: $2,226,870 (+$158,000, +7.64% from previous year)
- 2017: $2,180,831 ($-46,039, -2.07% from previous year)
- 2018: $2,579,977 (+$399,147, +18.30% from previous year)
- 2019: $2,609,357 (+$29,380, +1.14% from previous year)
- 2020: $2,621,180 (+$11,823, +0.45% from previous year)
- 2021: $3,037,422 (+$416,242, +15.88% from previous year)
- 2022: $3,910,238 (+$872,816, +28.74% from previous year)
- 2023: $3,420,294 ($-489,944, -12.53% from previous year)
- 2024: $3,818,190 (+$397,897, +11.63% from previous year)
- 2025: $4,051,581 (+$233,391, +6.11% from previous year)
Saratoga home prices have nearly tripled since 2010, with a 198% increase culminating in a 2025 average of just over $4 million. After a sharp correction in 2023, the market has regained its footing, with strong growth recorded over the past two years.
Saratoga – Upscale Living in the Foothills
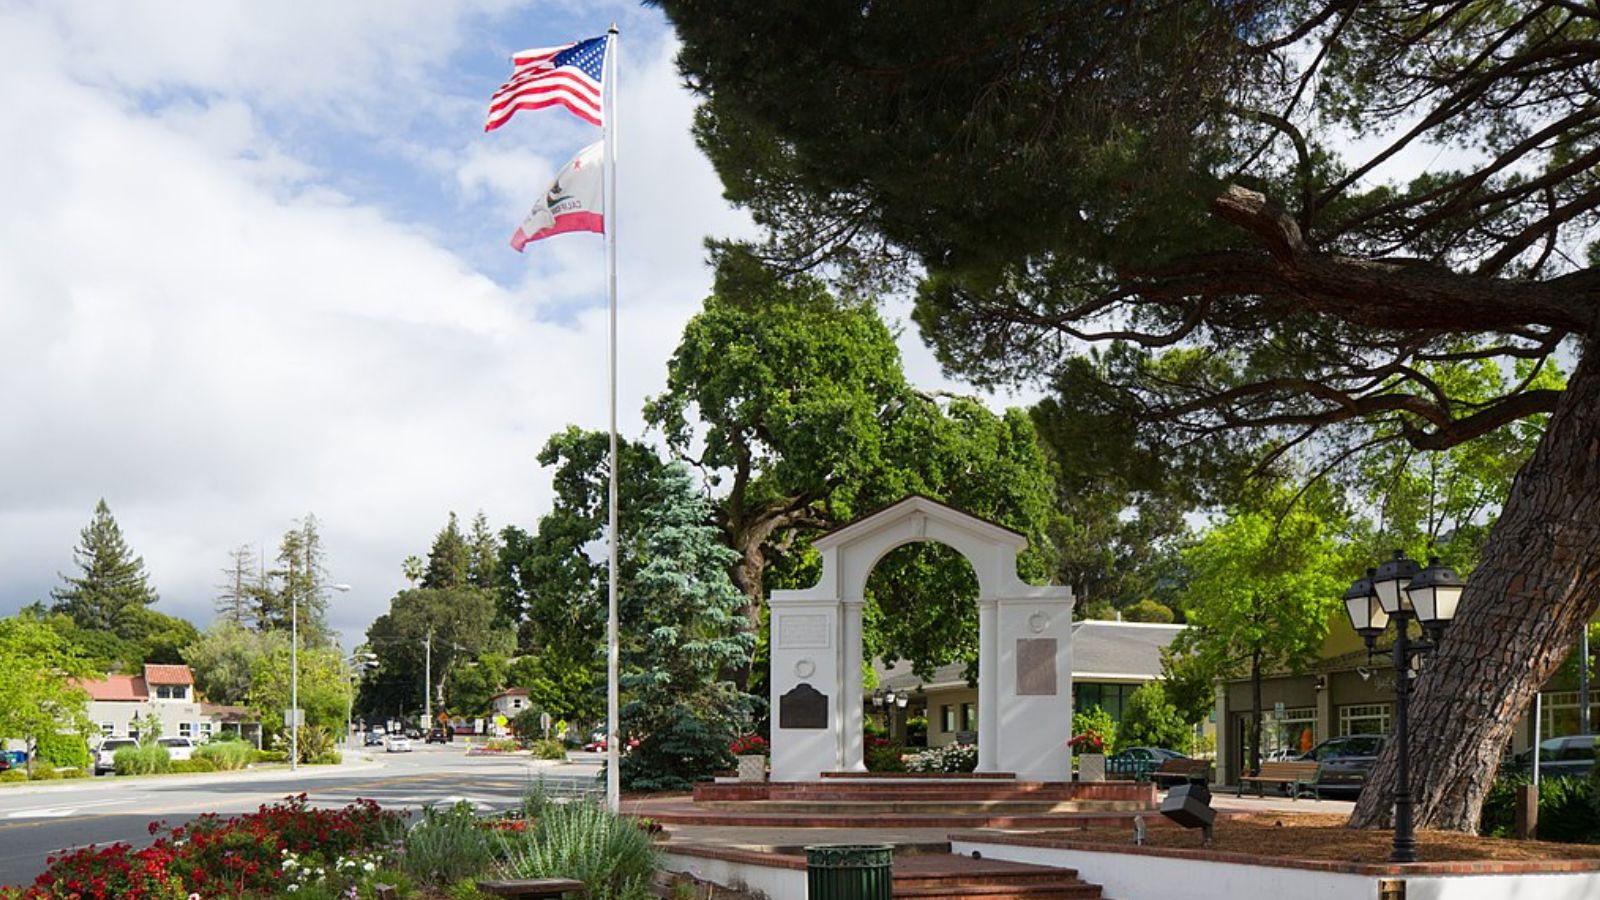
Located on the edge of Silicon Valley, Saratoga is prized for its blend of affluent suburban living and natural beauty. The town features high-performing public schools, boutique wineries, and a quaint downtown. Its peaceful atmosphere and access to top Bay Area employers make it especially attractive to wealthy families.
The luxury market here soared during the pandemic and has remained resilient. While 2023 marked a brief setback, strong fundamentals—proximity to tech jobs, limited inventory, and desirable lifestyle—continue to support Saratoga’s position among the state’s most expensive towns.
10. Portola Valley – 104% Home Price Increase Since 2010
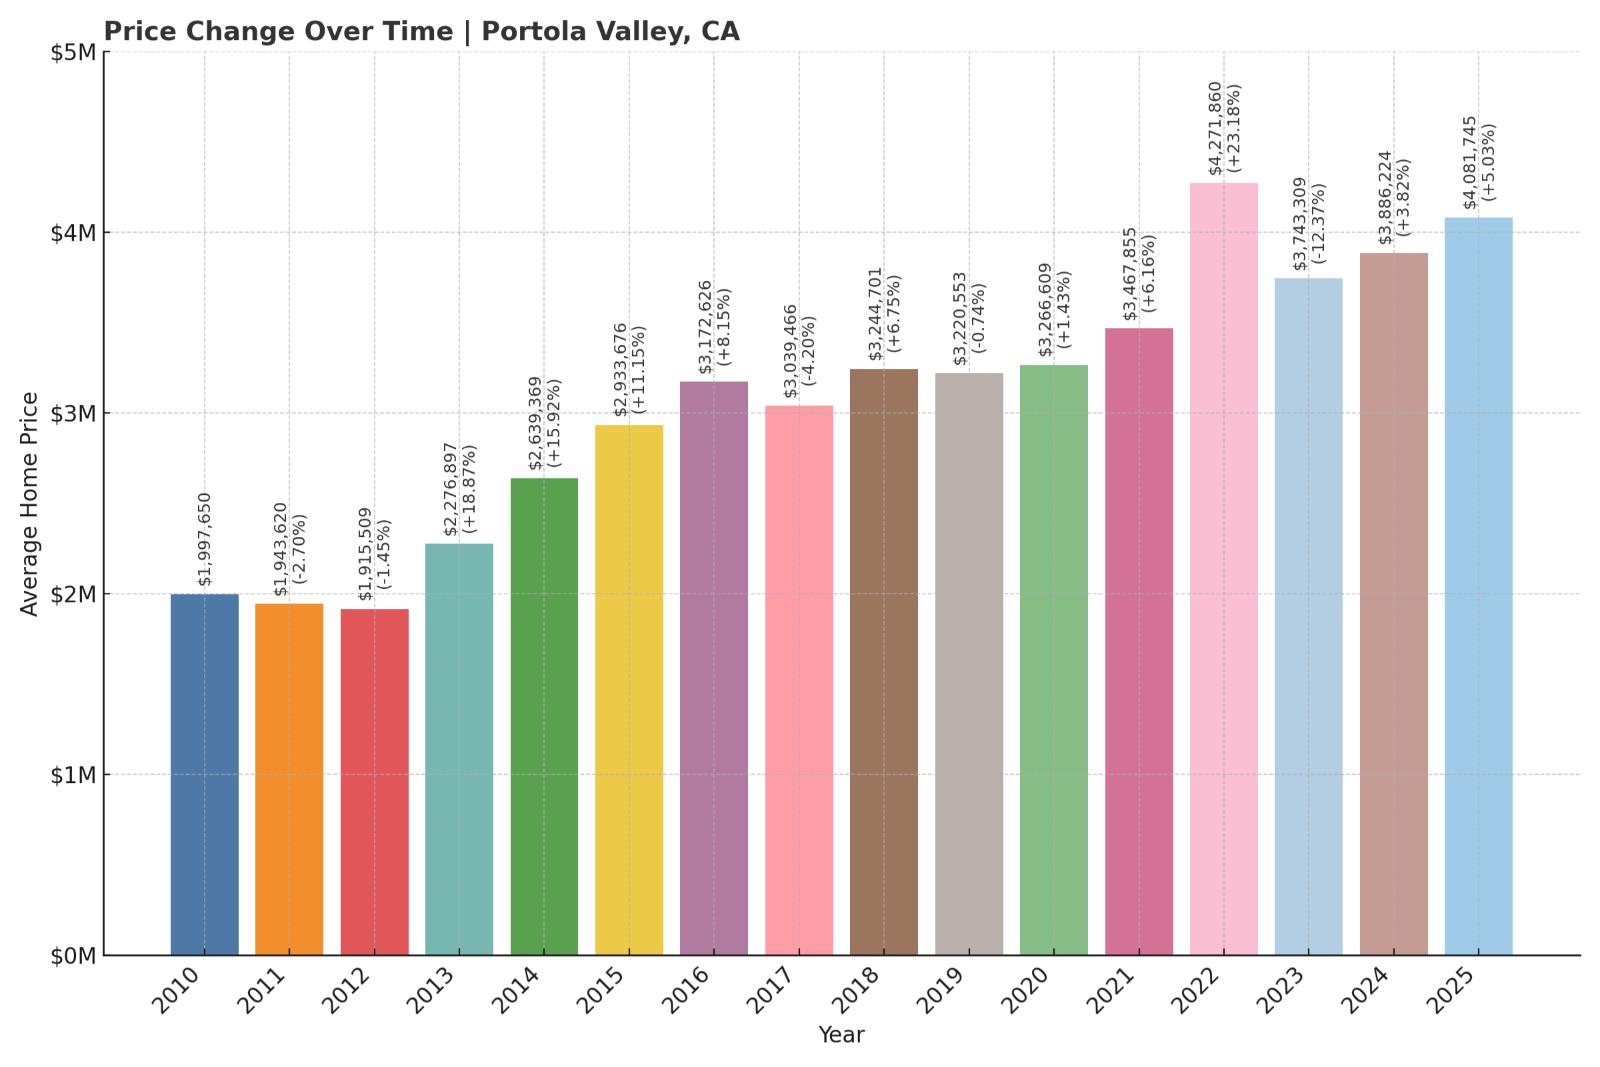
- 2010: $1,997,650
- 2011: $1,943,620 ($-54,030, -2.70% from previous year)
- 2012: $1,915,509 ($-28,111, -1.45% from previous year)
- 2013: $2,276,897 (+$361,388, +18.87% from previous year)
- 2014: $2,639,369 (+$362,472, +15.92% from previous year)
- 2015: $2,933,676 (+$294,307, +11.15% from previous year)
- 2016: $3,172,626 (+$238,950, +8.15% from previous year)
- 2017: $3,039,466 ($-133,160, -4.20% from previous year)
- 2018: $3,244,701 (+$205,235, +6.75% from previous year)
- 2019: $3,220,553 ($-24,148, -0.74% from previous year)
- 2020: $3,266,609 (+$46,056, +1.43% from previous year)
- 2021: $3,467,855 (+$201,247, +6.16% from previous year)
- 2022: $4,271,860 (+$804,005, +23.18% from previous year)
- 2023: $3,743,309 ($-528,551, -12.37% from previous year)
- 2024: $3,886,224 (+$142,915, +3.82% from previous year)
- 2025: $4,081,745 (+$195,521, +5.03% from previous year)
Portola Valley home values have climbed 104% since 2010, hitting over $4 million in 2025. After peaking in 2022, the town experienced a sharp drop in 2023 but quickly began recovering. Continued gains in 2024 and 2025 have put the market back on an upward path.
Portola Valley – High-End Living With a Natural Backdrop
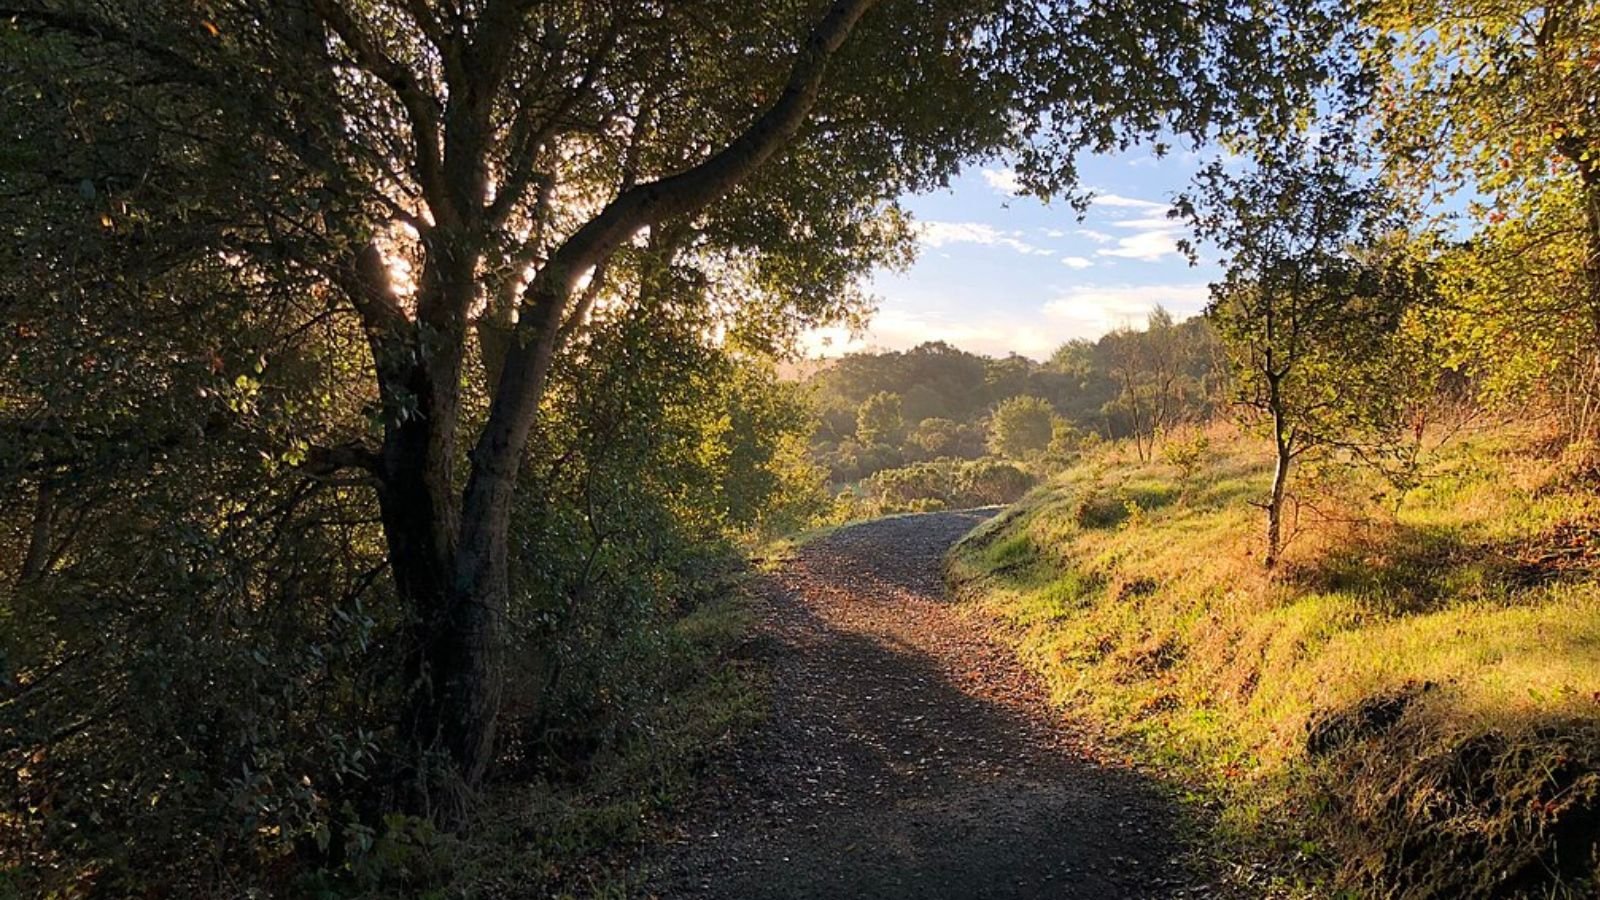
Set against the Santa Cruz Mountains, Portola Valley is known for its rural charm, natural scenery, and spacious properties. Despite its secluded feel, it’s a quick drive from Menlo Park, Palo Alto, and Stanford University—making it a favorite among tech elites looking for privacy without isolation.
Homebuyers are drawn to the town’s quiet trails, equestrian culture, and modern eco-conscious estates. Even with the recent correction, demand remains strong, supported by limited housing stock and high barriers to development.
9. Monte Sereno – 167% Home Price Increase Since 2010
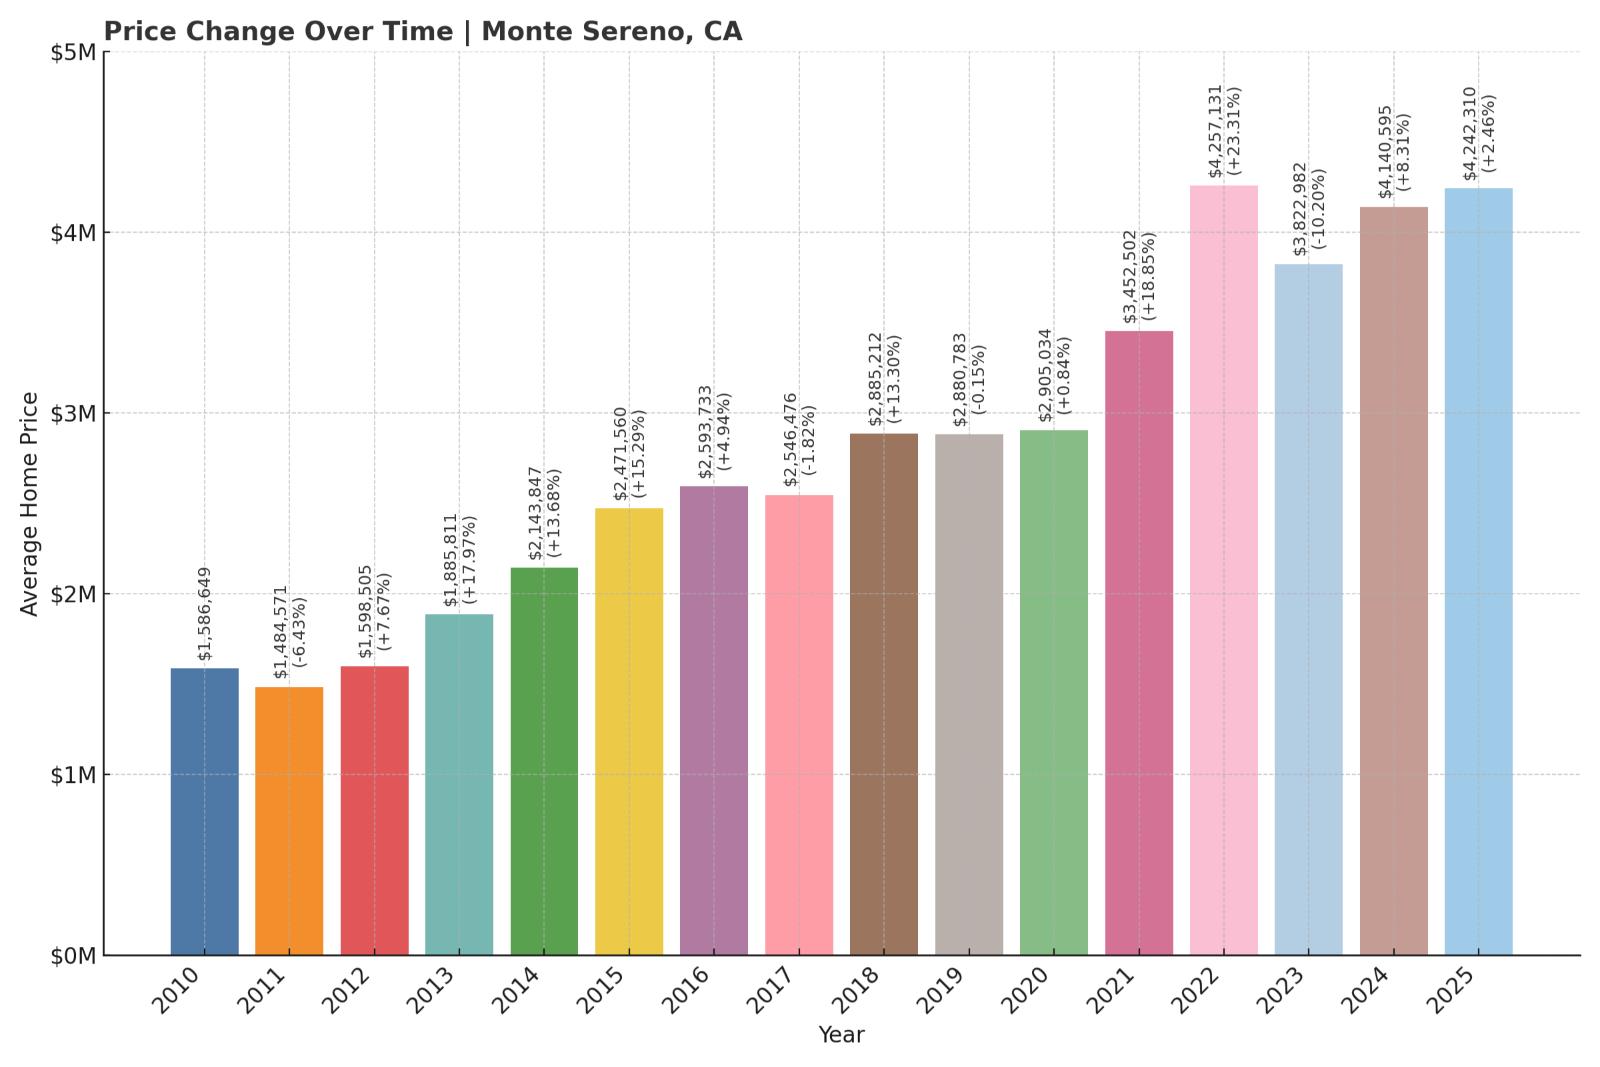
- 2010: $1,586,649
- 2011: $1,484,571 ($-102,078, -6.43% from previous year)
- 2012: $1,598,505 (+$113,934, +7.67% from previous year)
- 2013: $1,885,811 (+$287,306, +17.97% from previous year)
- 2014: $2,143,847 (+$258,036, +13.68% from previous year)
- 2015: $2,471,560 (+$327,713, +15.29% from previous year)
- 2016: $2,593,733 (+$122,173, +4.94% from previous year)
- 2017: $2,546,476 ($-47,257, -1.82% from previous year)
- 2018: $2,885,212 (+$338,736, +13.30% from previous year)
- 2019: $2,880,783 ($-4,430, -0.15% from previous year)
- 2020: $2,905,034 (+$24,251, +0.84% from previous year)
- 2021: $3,452,502 (+$547,469, +18.85% from previous year)
- 2022: $4,257,131 (+$804,628, +23.31% from previous year)
- 2023: $3,822,982 ($-434,148, -10.20% from previous year)
- 2024: $4,140,595 (+$317,612, +8.31% from previous year)
- 2025: $4,242,310 (+$101,715, +2.46% from previous year)
Monte Sereno’s home values have increased 167% over the last 15 years, with a sharp rise during 2021 and 2022. While the market corrected in 2023, gains over the last two years have pushed average prices above $4.2 million in 2025.
Monte Sereno – Quiet Affluence in the South Bay
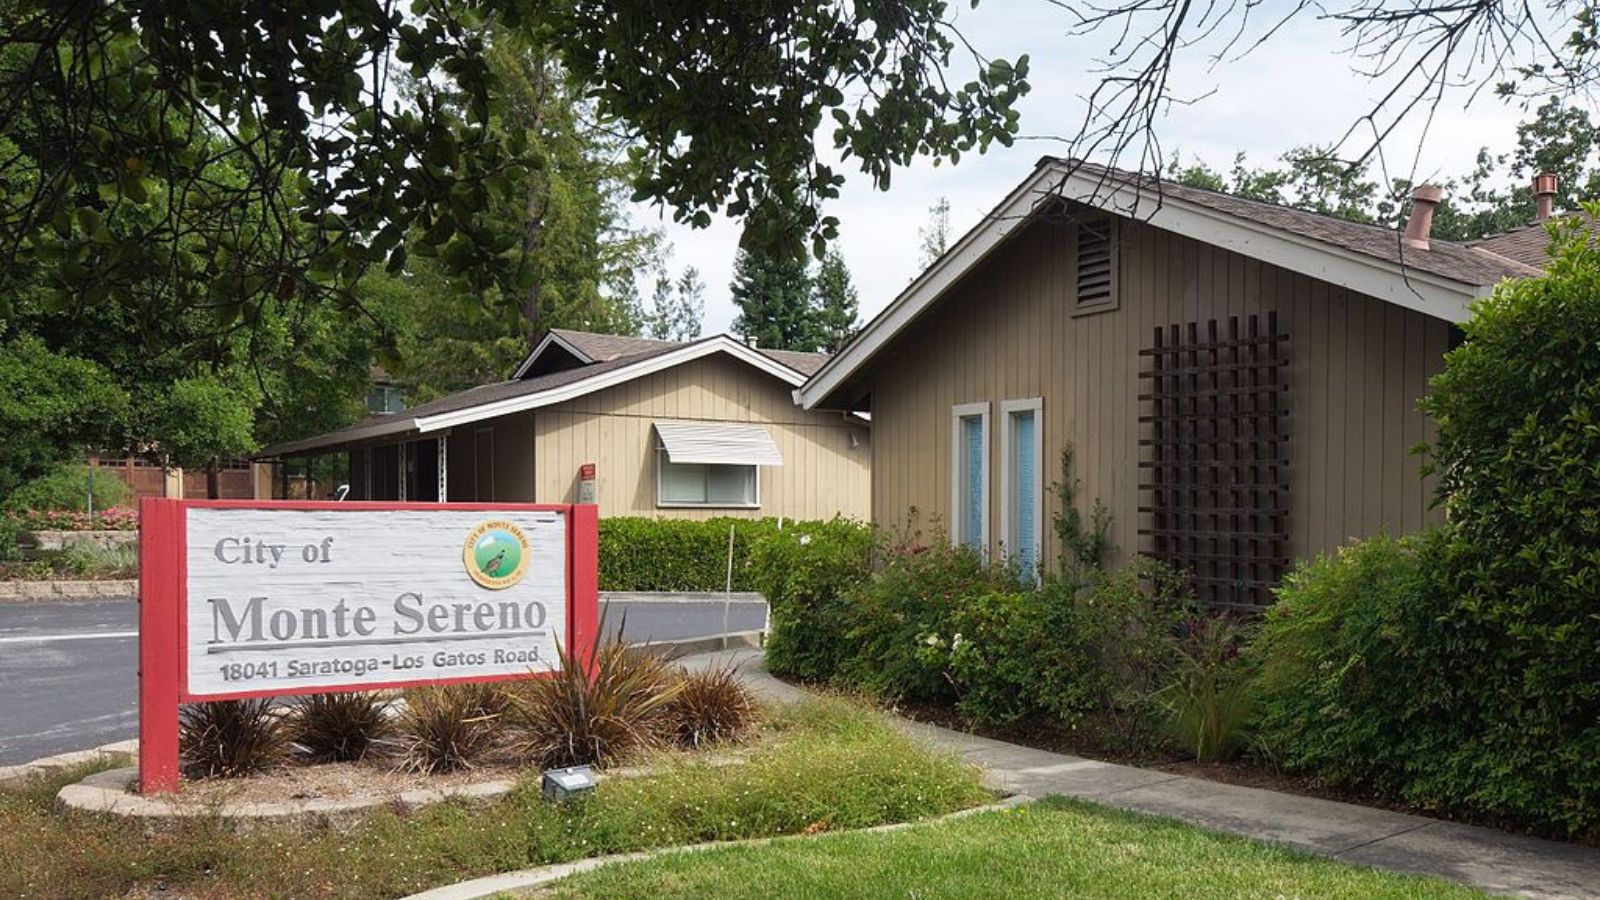
Monte Sereno is one of the smallest cities in Santa Clara County, bordering the better-known Los Gatos. With a population under 4,000 and strict zoning regulations, the town maintains a low-density, upscale residential character. It’s a favorite for buyers who want luxury and privacy with easy access to Silicon Valley jobs.
The 2021–2022 boom was fueled by tech wealth and a flight to suburban calm. Although values dipped slightly afterward, the long-term trend is clear: Monte Sereno is among the Bay Area’s most desirable—and most expensive—addresses.
8. Rancho Santa Fe – 134% Home Price Increase Since 2010
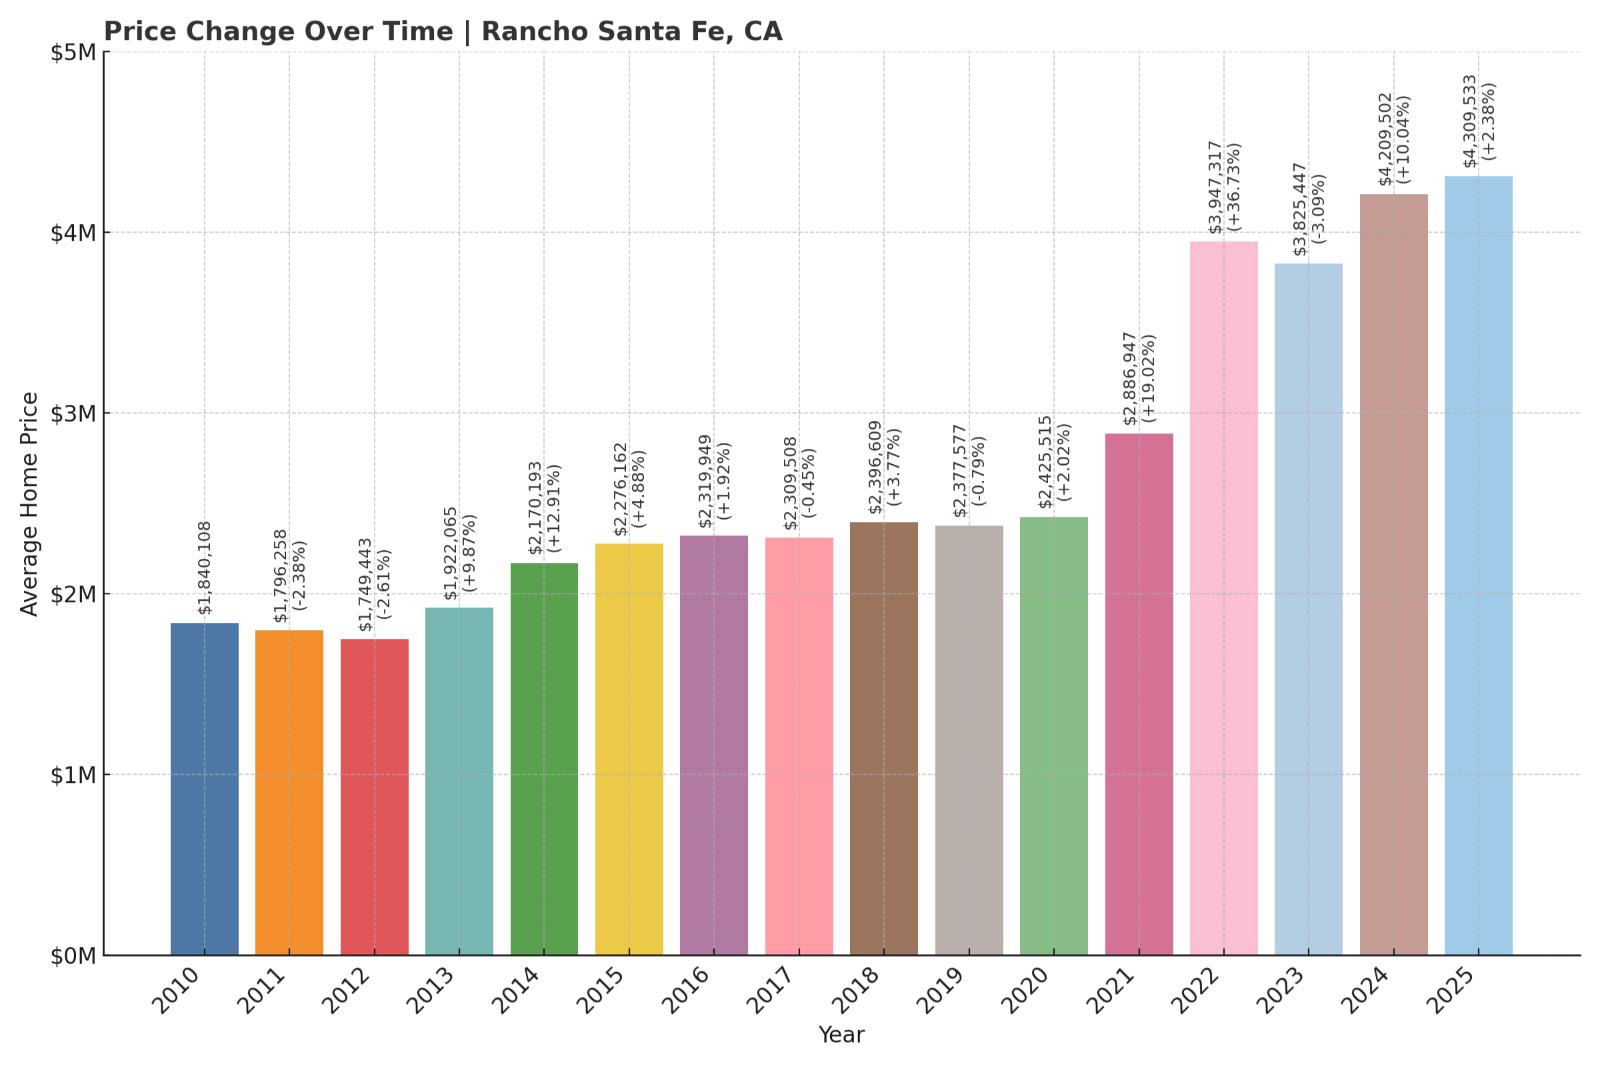
- 2010: $1,840,108
- 2011: $1,796,258 ($-43,850, -2.38% from previous year)
- 2012: $1,749,443 ($-46,815, -2.61% from previous year)
- 2013: $1,922,065 (+$172,622, +9.87% from previous year)
- 2014: $2,170,193 (+$248,128, +12.91% from previous year)
- 2015: $2,276,162 (+$105,969, +4.88% from previous year)
- 2016: $2,319,949 (+$43,787, +1.92% from previous year)
- 2017: $2,309,508 ($-10,441, -0.45% from previous year)
- 2018: $2,396,609 (+$87,101, +3.77% from previous year)
- 2019: $2,377,577 ($-19,031, -0.79% from previous year)
- 2020: $2,425,515 (+$47,937, +2.02% from previous year)
- 2021: $2,886,947 (+$461,433, +19.02% from previous year)
- 2022: $3,947,317 (+$1,060,369, +36.73% from previous year)
- 2023: $3,825,447 ($-121,870, -3.09% from previous year)
- 2024: $4,209,502 (+$384,055, +10.04% from previous year)
- 2025: $4,309,533 (+$100,031, +2.38% from previous year)
Home prices in Rancho Santa Fe have more than doubled since 2010, with a dramatic 36% jump in 2022. Despite a slight dip in 2023, the market has rebounded, reaching an average price above $4.3 million in 2025.
Rancho Santa Fe – Spacious Estates and SoCal Luxury

Rancho Santa Fe, located inland from San Diego, is known for its sprawling estates, gated communities, and equestrian properties. The town has long been a haven for high-net-worth individuals seeking both privacy and proximity to the coast. It’s part of the exclusive Covenant community and features lush landscaping, golf courses, and private schools.
Prices surged during the pandemic as remote work made it easier to live farther from dense urban centers. With inventory still limited and demand for large homes high, Rancho Santa Fe continues to sit among the state’s most expensive markets.
7. Los Altos – 209% Home Price Increase Since 2010
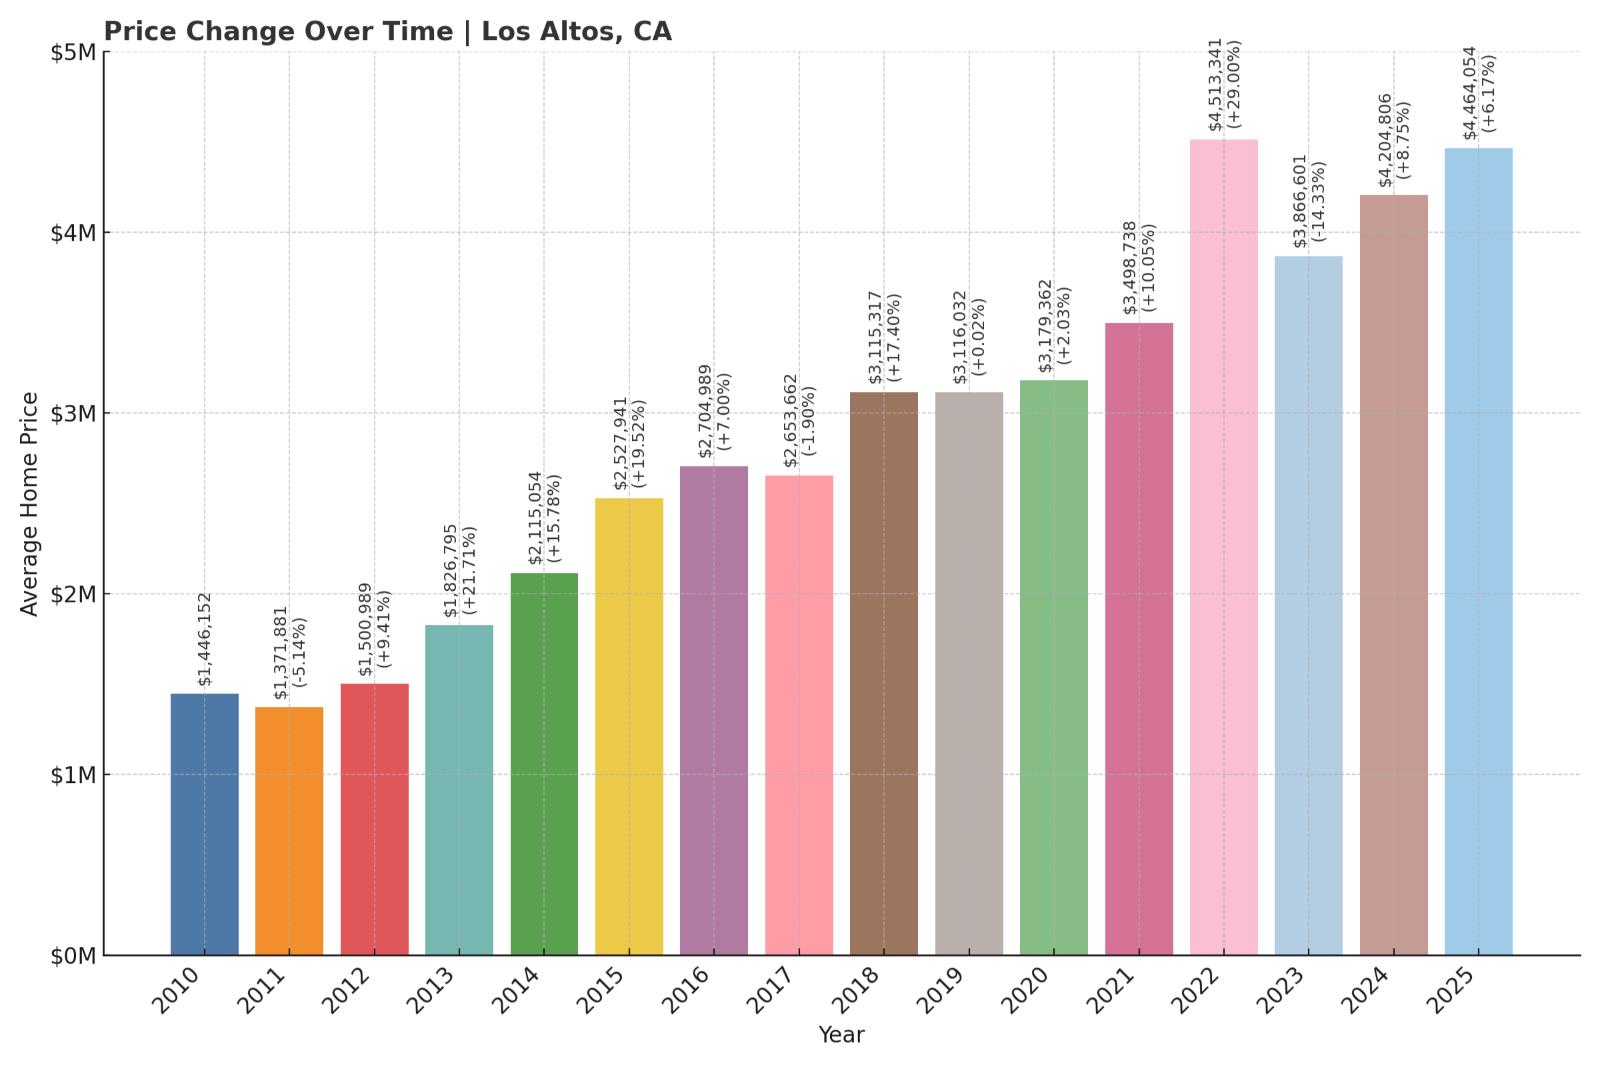
- 2010: $1,446,152
- 2011: $1,371,881 ($-74,271, -5.14% from previous year)
- 2012: $1,500,989 (+$129,109, +9.41% from previous year)
- 2013: $1,826,795 (+$325,806, +21.71% from previous year)
- 2014: $2,115,054 (+$288,259, +15.78% from previous year)
- 2015: $2,527,941 (+$412,886, +19.52% from previous year)
- 2016: $2,704,989 (+$177,049, +7.00% from previous year)
- 2017: $2,653,662 ($-51,327, -1.90% from previous year)
- 2018: $3,115,317 (+$461,656, +17.40% from previous year)
- 2019: $3,116,032 (+$714, +0.02% from previous year)
- 2020: $3,179,362 (+$63,330, +2.03% from previous year)
- 2021: $3,498,738 (+$319,376, +10.05% from previous year)
- 2022: $4,513,341 (+$1,014,603, +29.00% from previous year)
- 2023: $3,866,601 ($-646,740, -14.33% from previous year)
- 2024: $4,204,806 (+$338,205, +8.75% from previous year)
- 2025: $4,464,054 (+$259,249, +6.17% from previous year)
Los Altos has seen an impressive 209% jump in home prices since 2010. After a major leap in 2022 and a dip in 2023, values are back on the rise, topping $4.4 million in 2025.
Los Altos – Tech Proximity With a Residential Feel
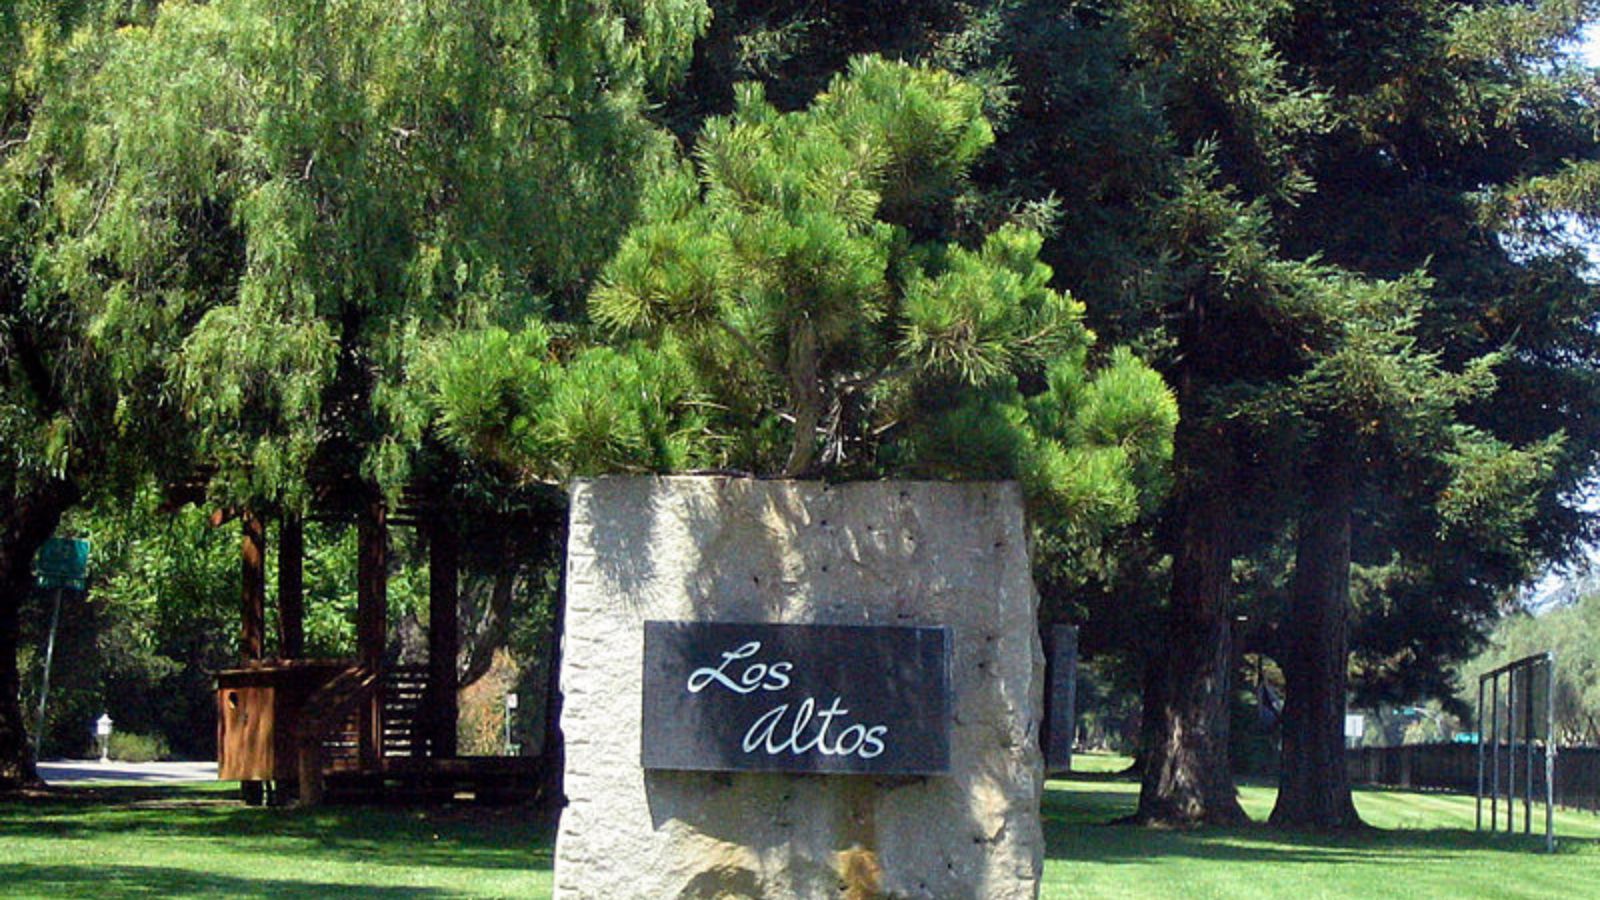
Los Altos is centrally located in Silicon Valley and offers a quiet, residential atmosphere paired with exceptional schools and lush neighborhoods. Unlike many tech-centric towns, it retains a small-town feel, which makes it especially appealing to affluent families.
The 2022 boom reflected a surge in tech wealth and low interest rates, while the 2023 pullback aligned with broader cooling in the Bay Area. Yet with renewed upward momentum in 2024 and 2025, Los Altos remains firmly on the list of California’s most valuable places to live.
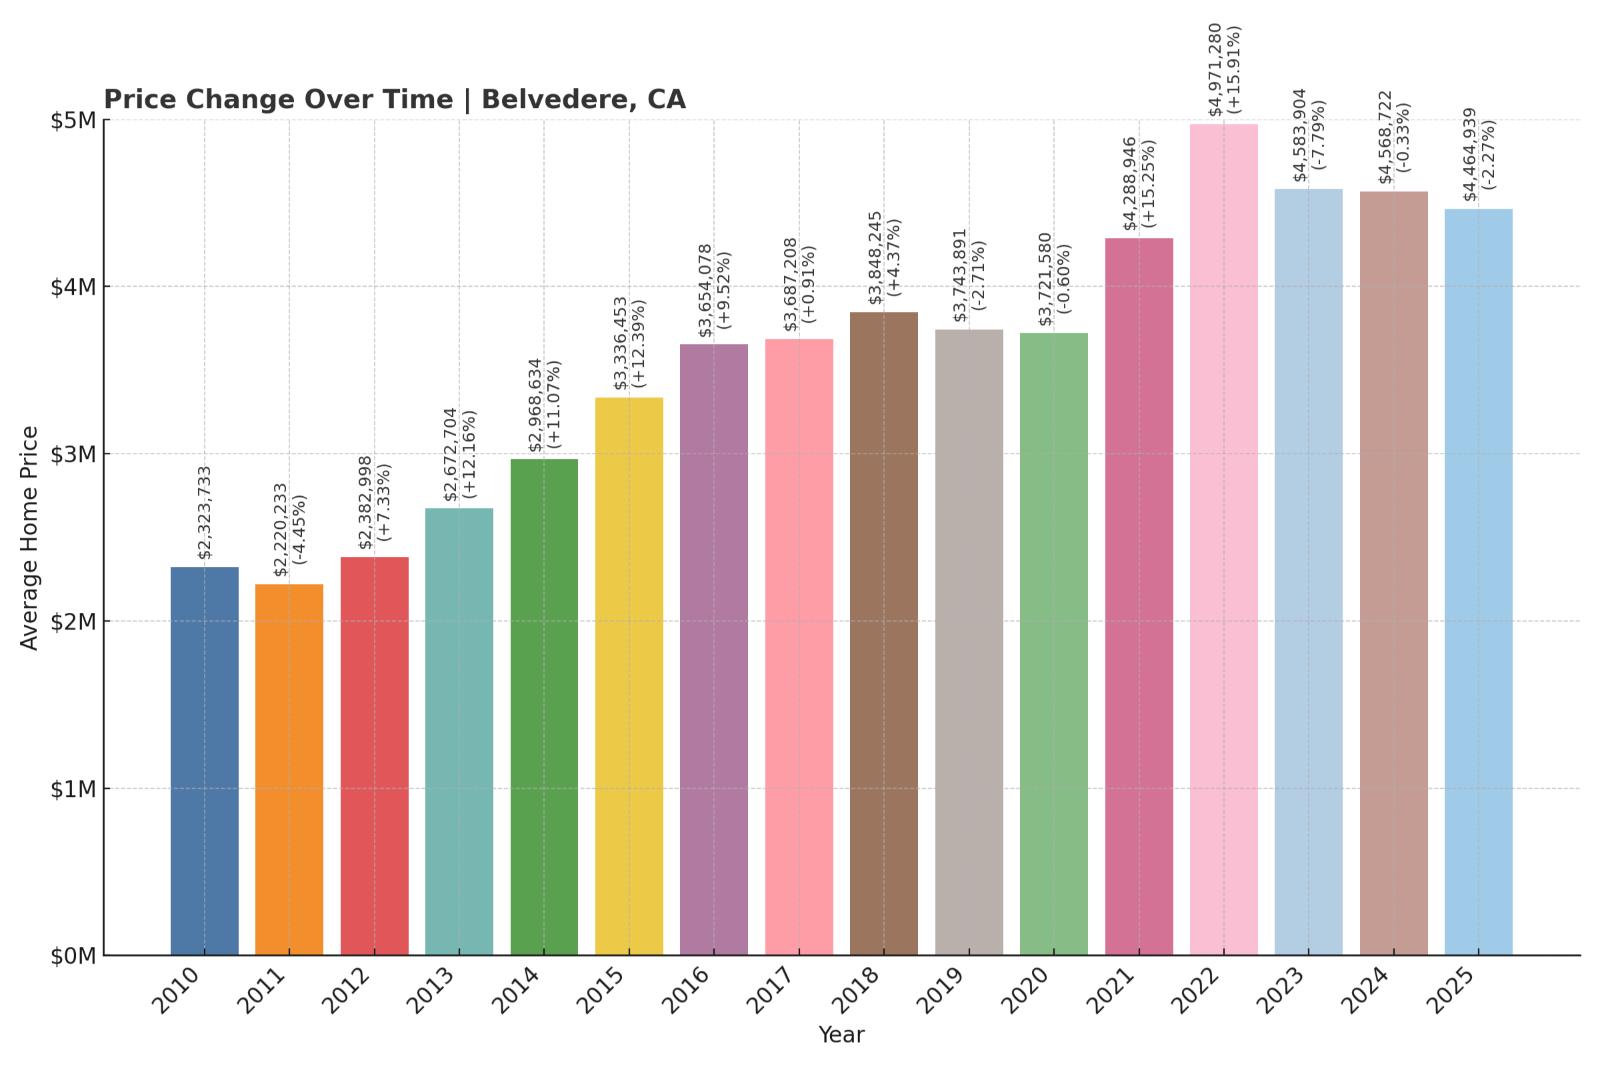
6. Belvedere – 92% Home Price Increase Since 2010
🔥 Would you like to save this?
- 2010: $2,323,733
- 2011: $2,220,233 ($-103,501, -4.45% from previous year)
- 2012: $2,382,998 (+$162,766, +7.33% from previous year)
- 2013: $2,672,704 (+$289,705, +12.16% from previous year)
- 2014: $2,968,634 (+$295,930, +11.07% from previous year)
- 2015: $3,336,453 (+$367,820, +12.39% from previous year)
- 2016: $3,654,078 (+$317,625, +9.52% from previous year)
- 2017: $3,687,208 (+$33,130, +0.91% from previous year)
- 2018: $3,848,245 (+$161,037, +4.37% from previous year)
- 2019: $3,743,891 ($-104,354, -2.71% from previous year)
- 2020: $3,721,580 ($-22,312, -0.60% from previous year)
- 2021: $4,288,946 (+$567,367, +15.25% from previous year)
- 2022: $4,971,280 (+$682,334, +15.91% from previous year)
- 2023: $4,583,904 ($-387,376, -7.79% from previous year)
- 2024: $4,568,722 ($-15,182, -0.33% from previous year)
- 2025: $4,464,939 ($-103,783, -2.27% from previous year)
Belvedere’s home values have increased 92% since 2010, with much of that growth concentrated between 2012 and 2022. Prices peaked just under $5 million in 2022 before tapering off slightly in the years since. Still, the town remains one of the most expensive markets in the state, with homes averaging over $4.4 million in 2025.
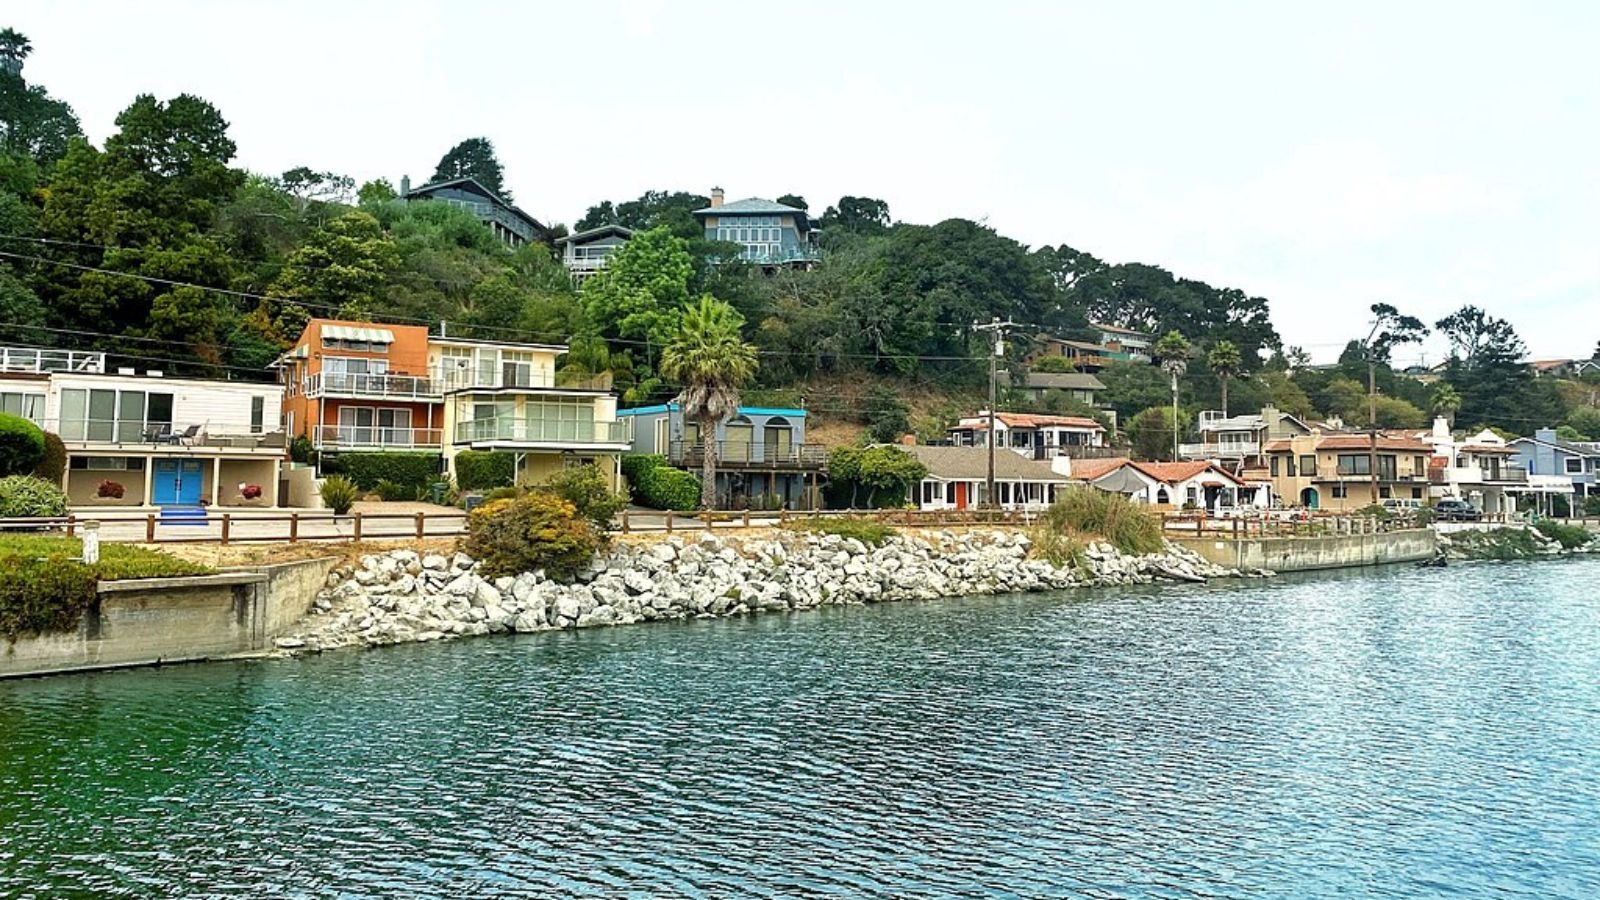
Belvedere – Bay Views and Billionaire Enclaves
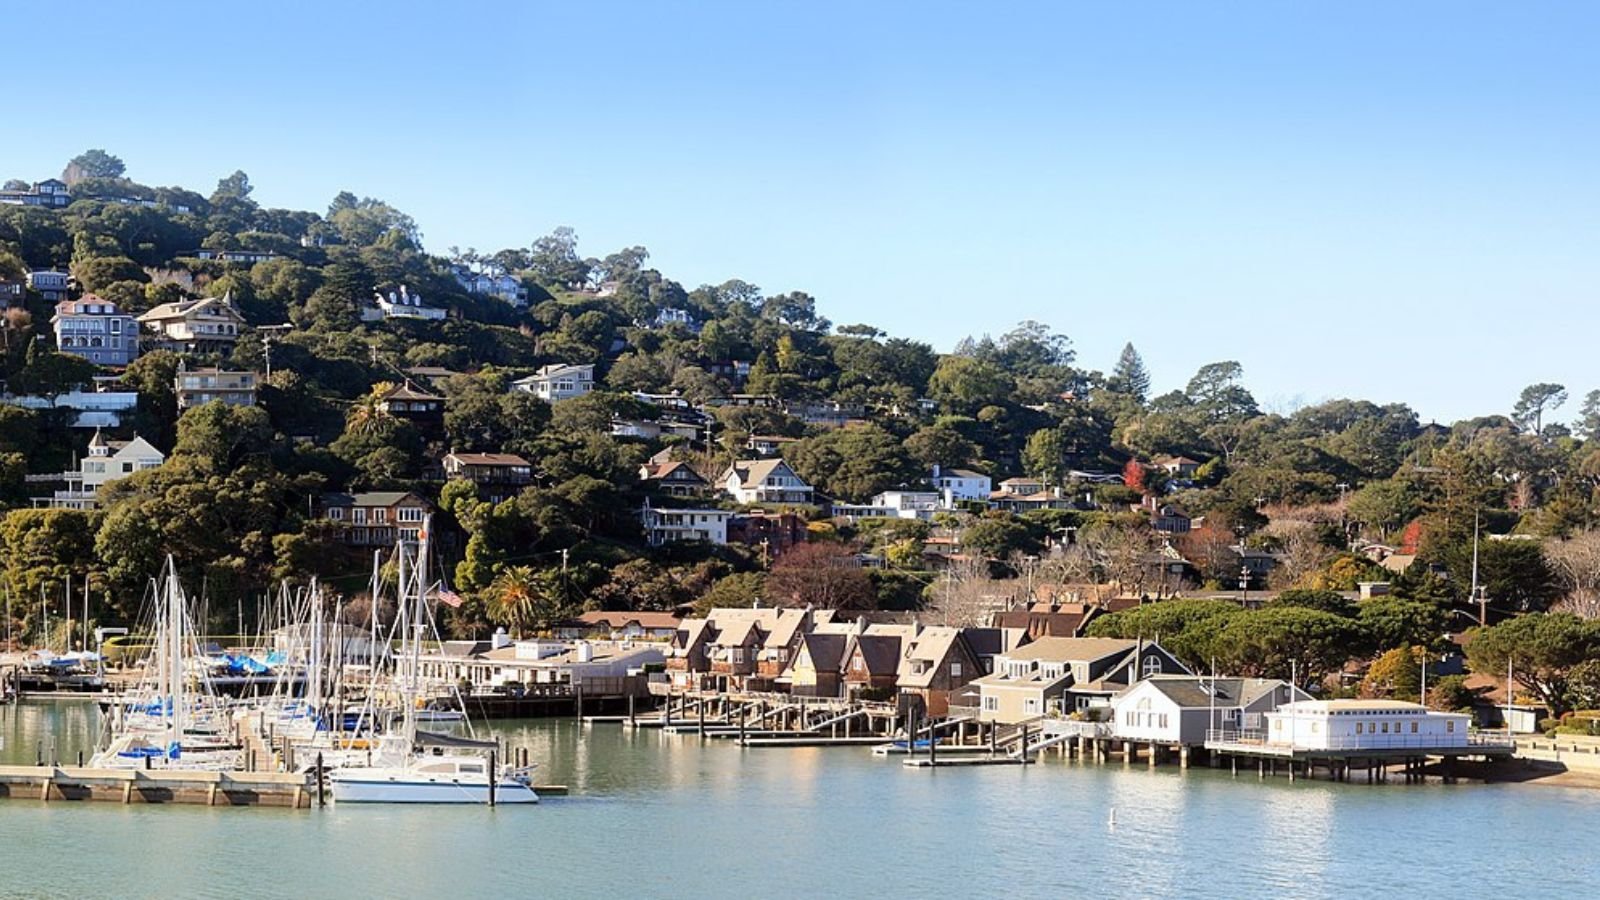
Located on an island in Marin County, Belvedere is famed for its sweeping views of San Francisco Bay, elegant architecture, and extraordinary exclusivity. The town consists of only a few hundred homes, many of which command eight-figure price tags. Boating and yachting are part of everyday life here, thanks to its waterfront setting and private marina access.
Belvedere’s value stems from more than just its scenery—its housing stock is limited, and zoning restrictions preserve the character of the neighborhood. Even as prices softened slightly after 2022, ultra-high-net-worth buyers keep the market elevated. The demand for trophy properties in this serene, secluded setting remains as strong as ever.
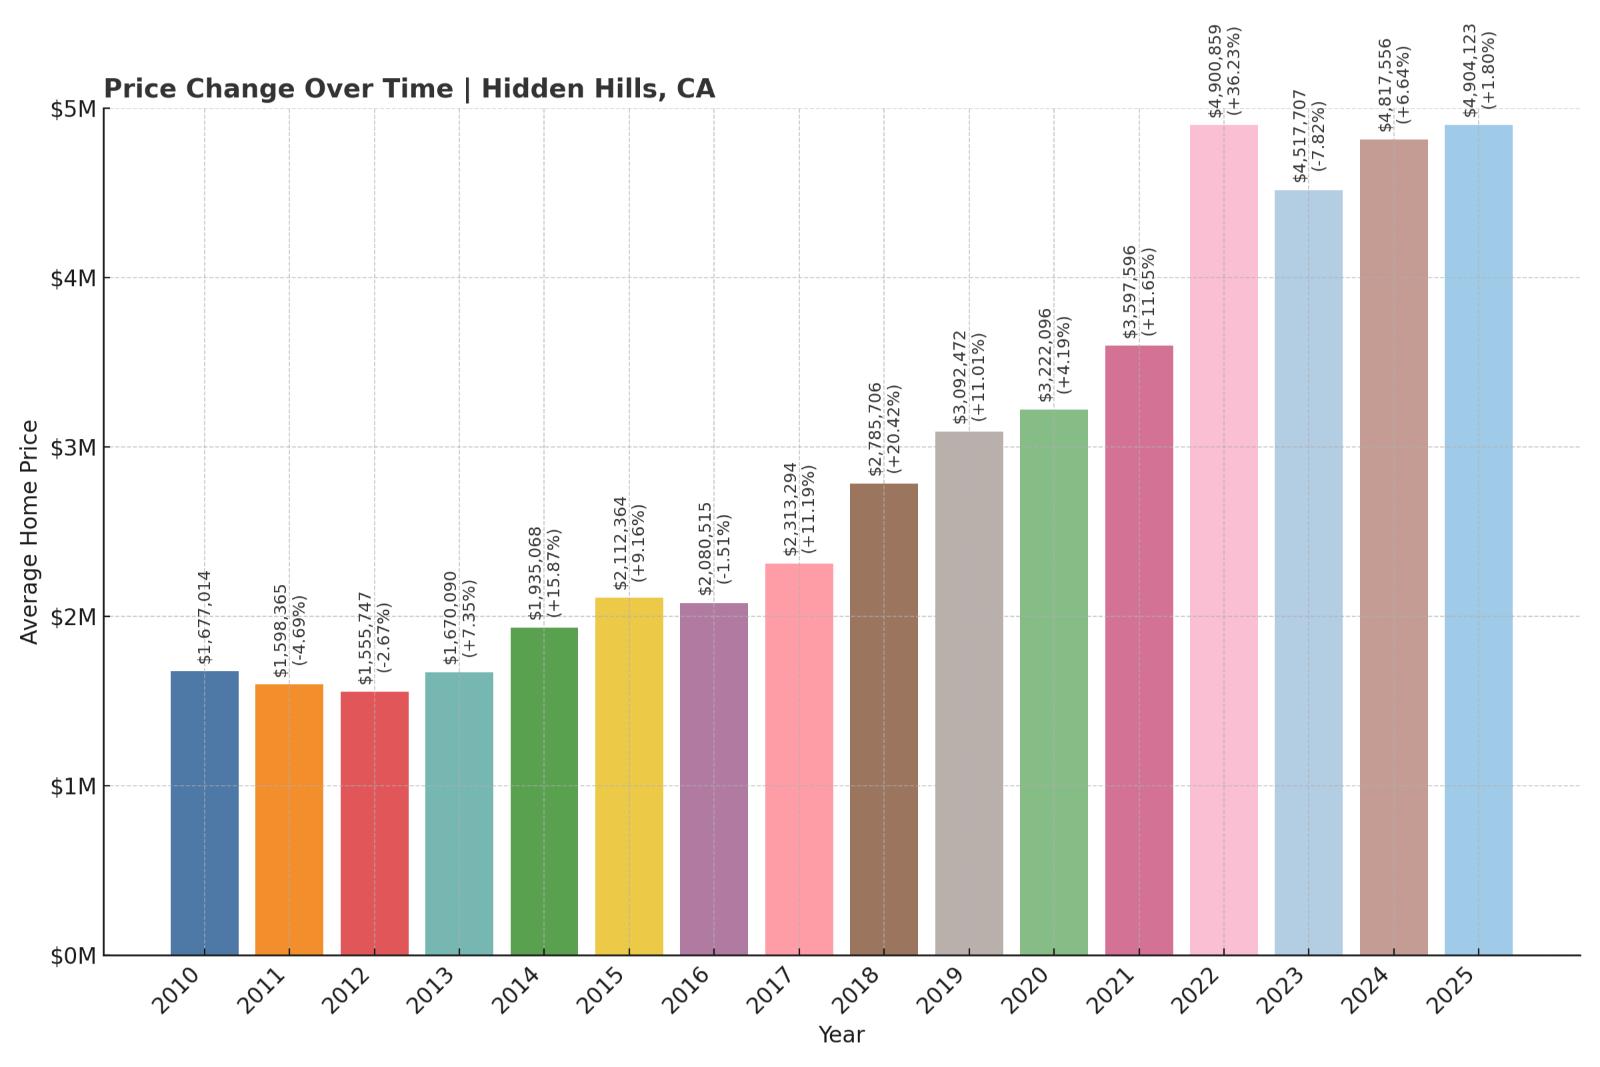
5. Hidden Hills – 192% Home Price Increase Since 2010
- 2010: $1,677,014
- 2011: $1,598,365 ($-78,649, -4.69% from previous year)
- 2012: $1,555,747 ($-42,618, -2.67% from previous year)
- 2013: $1,670,090 (+$114,343, +7.35% from previous year)
- 2014: $1,935,068 (+$264,978, +15.87% from previous year)
- 2015: $2,112,364 (+$177,296, +9.16% from previous year)
- 2016: $2,080,515 ($-31,849, -1.51% from previous year)
- 2017: $2,313,294 (+$232,779, +11.19% from previous year)
- 2018: $2,785,706 (+$472,412, +20.42% from previous year)
- 2019: $3,092,472 (+$306,766, +11.01% from previous year)
- 2020: $3,222,096 (+$129,625, +4.19% from previous year)
- 2021: $3,597,596 (+$375,499, +11.65% from previous year)
- 2022: $4,900,859 (+$1,303,263, +36.23% from previous year)
- 2023: $4,517,707 ($-383,152, -7.82% from previous year)
- 2024: $4,817,556 (+$299,849, +6.64% from previous year)
- 2025: $4,904,123 (+$86,567, +1.80% from previous year)
Home prices in Hidden Hills have nearly tripled since 2010, surging 192%. The sharpest spike came in 2022, with a 36% year-over-year increase. Despite some cooling afterward, the town remains well above its pre-pandemic average, landing just under $5 million in 2025.
Hidden Hills – Celebrity Compounds and Gated Glamour

Hidden Hills, tucked in the western reaches of Los Angeles County, is synonymous with celebrity wealth. Known for its gated communities, privacy, and ranch-style estates, it’s home to major names in entertainment and sports. The area is protected from paparazzi and lined with private streets—making it a fortress of exclusivity in the bustling LA region.
Massive compounds, equestrian trails, and sprawling lots are hallmarks of this enclave. The pandemic-era push toward private luxury living gave Hidden Hills a huge boost, and even as price growth has slowed, the cachet of the ZIP code keeps demand exceptionally strong.
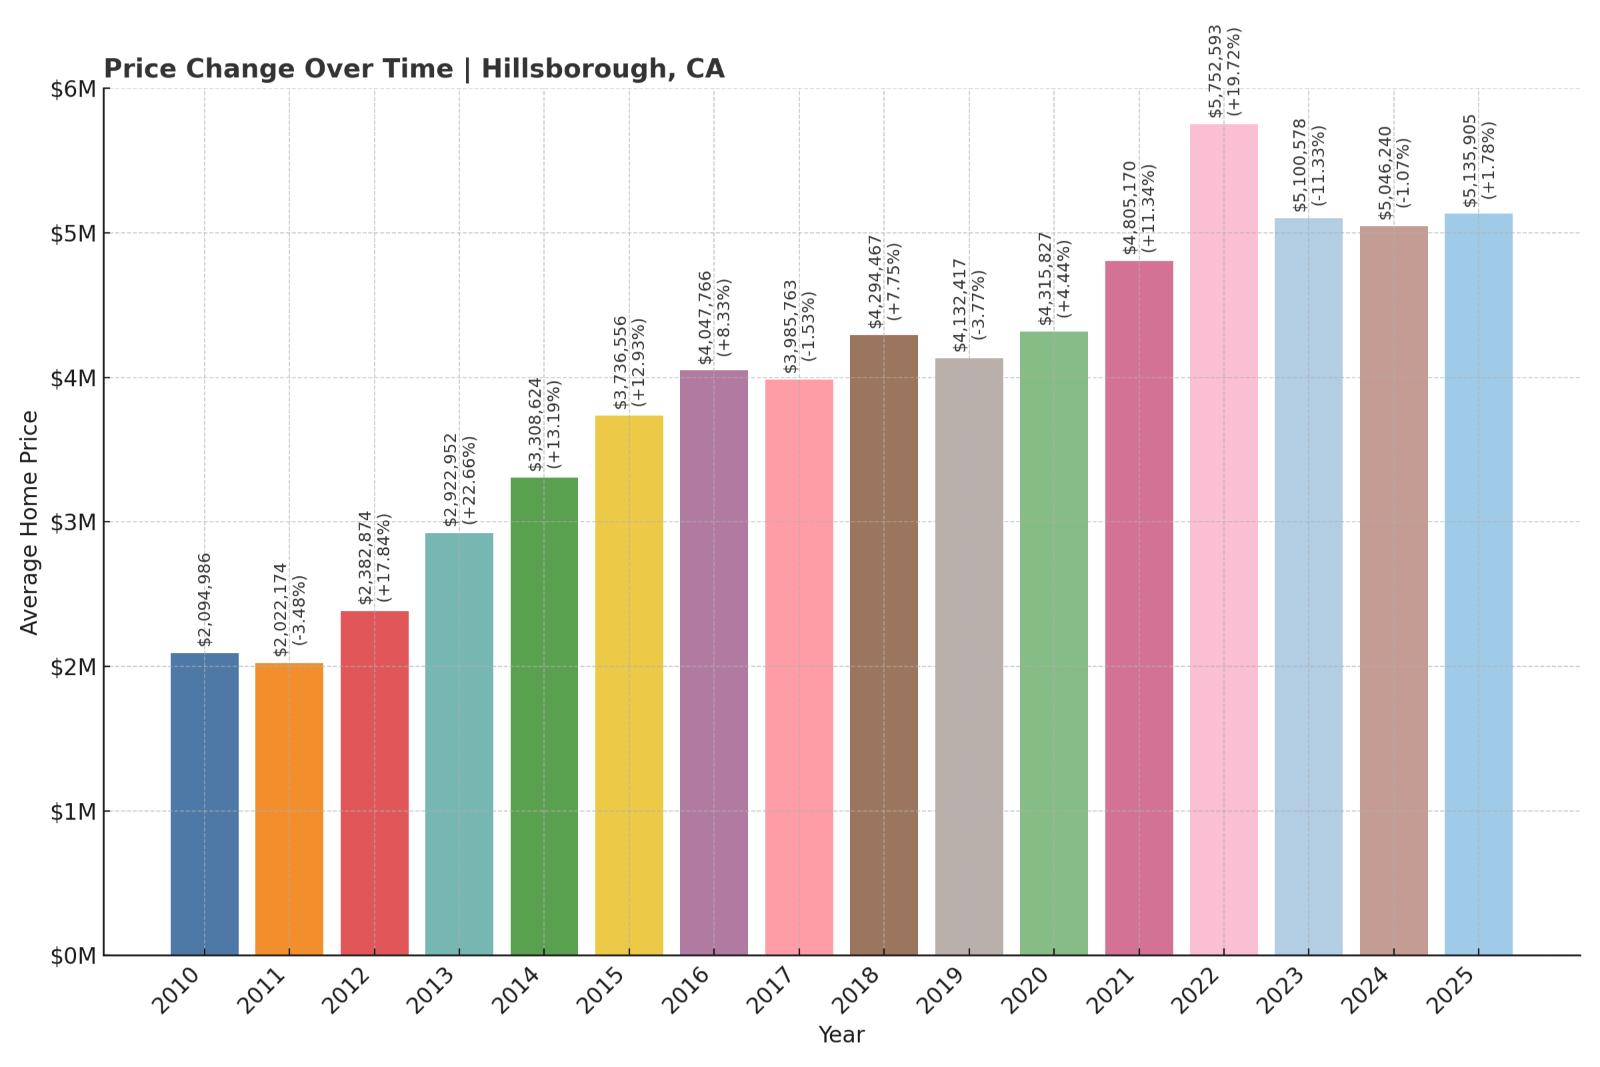
4. Hillsborough – 145% Home Price Increase Since 2010
- 2010: $2,094,986
- 2011: $2,022,174 ($-72,812, -3.48% from previous year)
- 2012: $2,382,874 (+$360,700, +17.84% from previous year)
- 2013: $2,922,952 (+$540,077, +22.66% from previous year)
- 2014: $3,308,624 (+$385,672, +13.19% from previous year)
- 2015: $3,736,556 (+$427,932, +12.93% from previous year)
- 2016: $4,047,766 (+$311,211, +8.33% from previous year)
- 2017: $3,985,763 ($-62,004, -1.53% from previous year)
- 2018: $4,294,467 (+$308,704, +7.75% from previous year)
- 2019: $4,132,417 ($-162,050, -3.77% from previous year)
- 2020: $4,315,827 (+$183,410, +4.44% from previous year)
- 2021: $4,805,170 (+$489,343, +11.34% from previous year)
- 2022: $5,752,593 (+$947,422, +19.72% from previous year)
- 2023: $5,100,578 ($-652,015, -11.33% from previous year)
- 2024: $5,046,240 ($-54,338, -1.07% from previous year)
- 2025: $5,135,905 (+$89,665, +1.78% from previous year)
Hillsborough home prices have risen by 145% since 2010, driven by steady appreciation and a huge bump in 2022. Though values dipped in 2023 and held mostly flat in 2024, they began climbing again in 2025, ending just over $5.1 million.
Hillsborough – Old Money Meets Modern Prestige
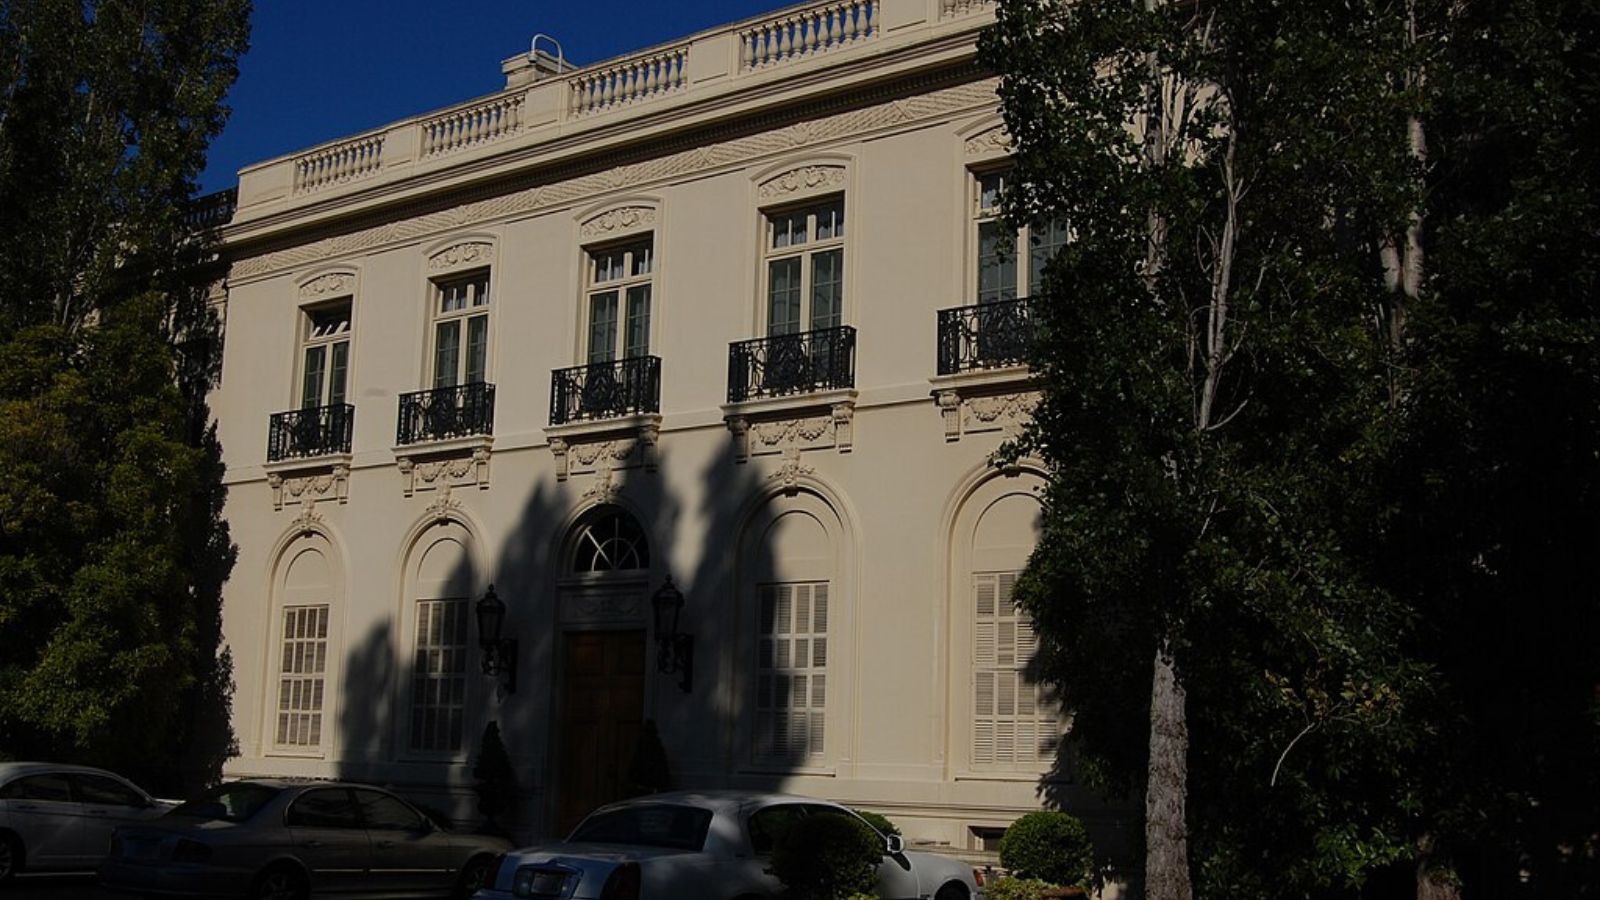
Hillsborough is one of the Bay Area’s oldest luxury enclaves, known for its historic mansions, manicured streets, and elite reputation. Nestled between San Mateo and Burlingame, it’s long attracted business leaders, tech founders, and multigenerational wealth. The town has no commercial zoning, maintaining a purely residential ambiance.
Grand estates with gated driveways dominate the real estate landscape. Even as newer Silicon Valley towns have boomed, Hillsborough has held its status. With a mix of heritage charm and top-tier schools, its home values are among the highest in California.
3. Montecito – 139% Home Price Increase Since 2010
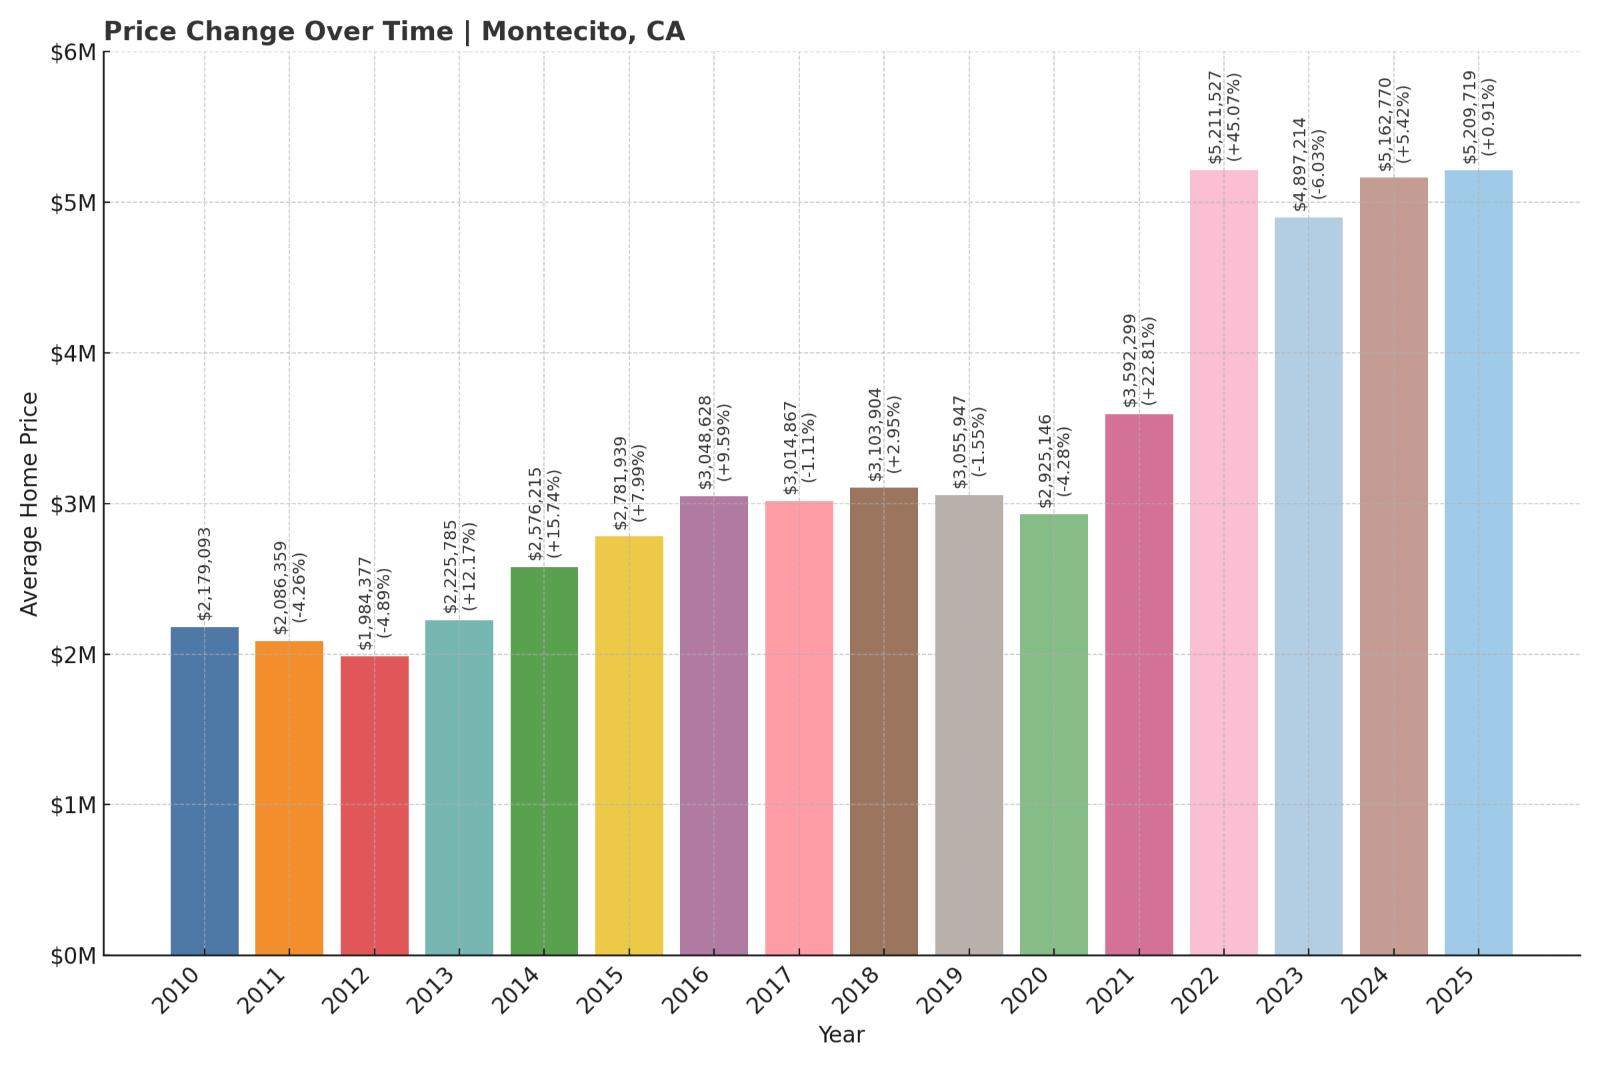
- 2010: $2,179,093
- 2011: $2,086,359 ($-92,734, -4.26% from previous year)
- 2012: $1,984,377 ($-101,982, -4.89% from previous year)
- 2013: $2,225,785 (+$241,409, +12.17% from previous year)
- 2014: $2,576,215 (+$350,430, +15.74% from previous year)
- 2015: $2,781,939 (+$205,724, +7.99% from previous year)
- 2016: $3,048,628 (+$266,689, +9.59% from previous year)
- 2017: $3,014,867 ($-33,761, -1.11% from previous year)
- 2018: $3,103,904 (+$89,037, +2.95% from previous year)
- 2019: $3,055,947 ($-47,956, -1.55% from previous year)
- 2020: $2,925,146 ($-130,801, -4.28% from previous year)
- 2021: $3,592,299 (+$667,152, +22.81% from previous year)
- 2022: $5,211,527 (+$1,619,229, +45.08% from previous year)
- 2023: $4,897,214 ($-314,313, -6.03% from previous year)
- 2024: $5,162,770 (+$265,556, +5.42% from previous year)
- 2025: $5,209,719 (+$46,949, +0.91% from previous year)
Montecito’s home values have jumped 139% since 2010, with a massive 45% surge in 2022 alone. After minor corrections, prices stabilized in 2025 at just over $5.2 million, making it one of California’s premier luxury markets.
Montecito – Star Power and Ocean Views

Montecito is known for its celebrity residents, ocean vistas, and Mediterranean estates. Located just east of Santa Barbara, it’s home to Oprah Winfrey, Prince Harry, and Meghan Markle, among others. Buyers are drawn to its blend of quiet sophistication and coastal access.
The post-2020 years brought huge demand for privacy and luxury, with Montecito standing out as a top destination. Large estates, ocean breezes, and off-the-radar appeal keep this small community among California’s most valuable—and talked-about—places to buy a home.
2. Los Altos Hills – 132% Home Price Increase Since 2010
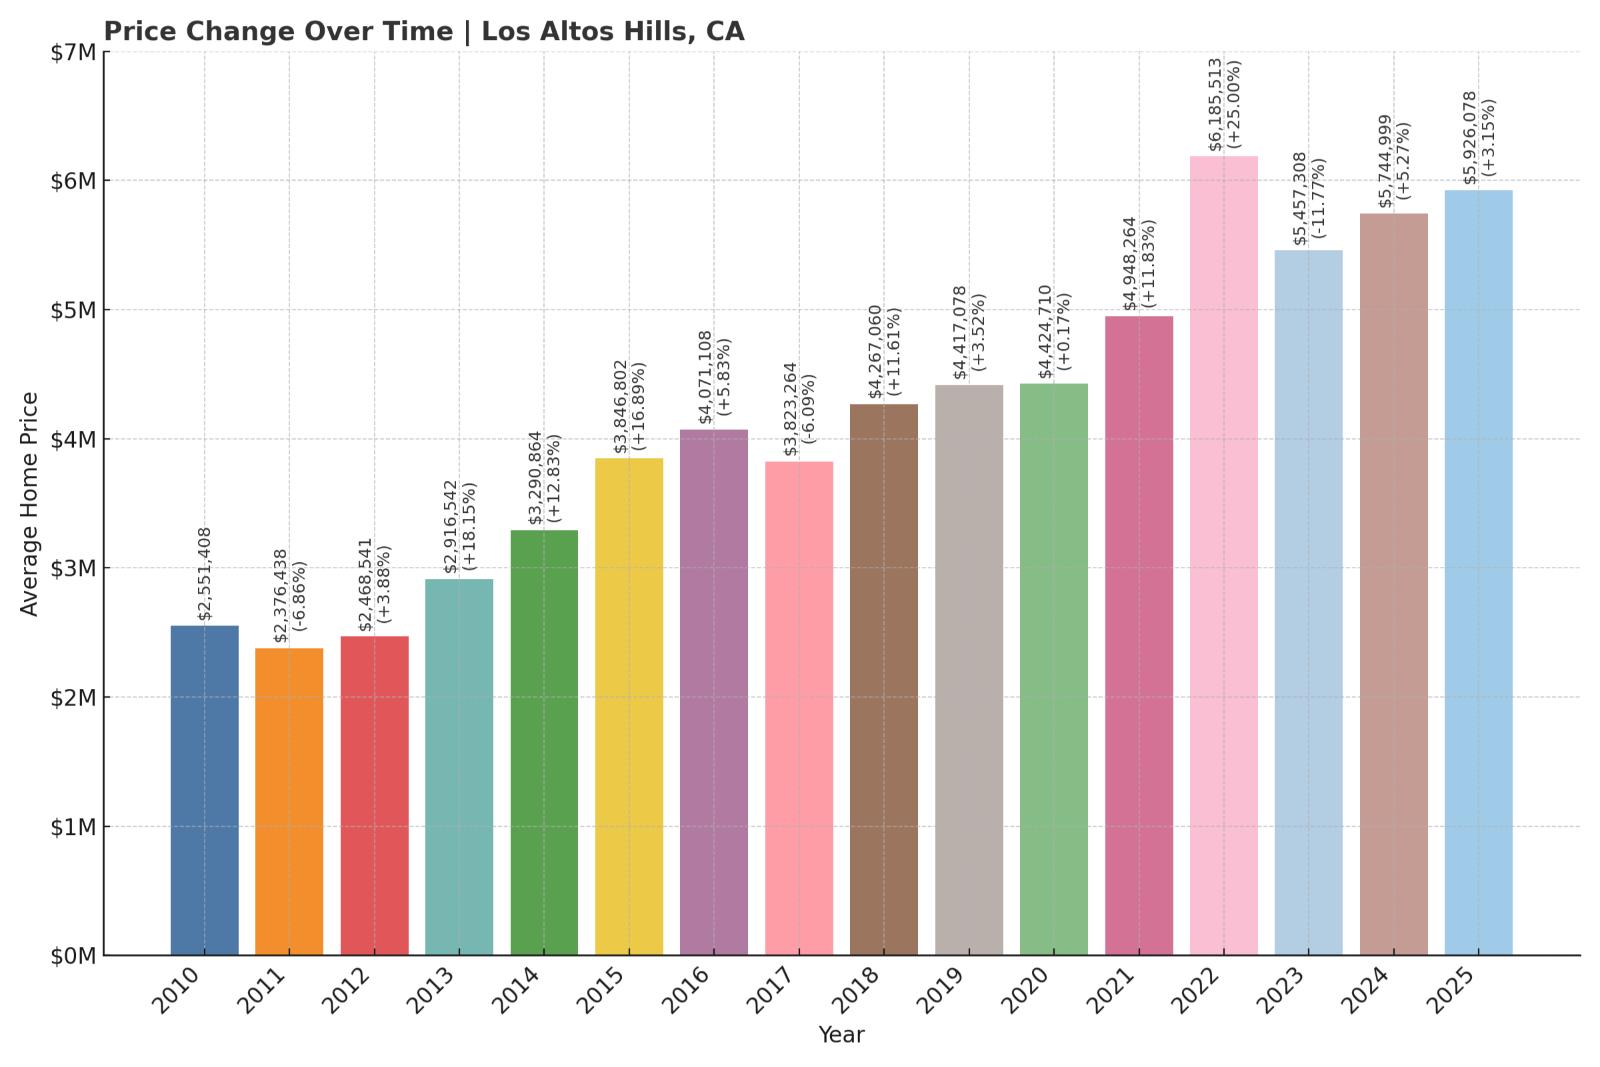
- 2010: $2,551,408
- 2011: $2,376,438 ($-174,970, -6.86% from previous year)
- 2012: $2,468,541 (+$92,103, +3.88% from previous year)
- 2013: $2,916,542 (+$448,001, +18.15% from previous year)
- 2014: $3,290,864 (+$374,322, +12.83% from previous year)
- 2015: $3,846,802 (+$555,938, +16.89% from previous year)
- 2016: $4,071,108 (+$224,306, +5.83% from previous year)
- 2017: $3,823,264 ($-247,844, -6.09% from previous year)
- 2018: $4,267,060 (+$443,796, +11.61% from previous year)
- 2019: $4,417,078 (+$150,018, +3.52% from previous year)
- 2020: $4,424,710 (+$7,632, +0.17% from previous year)
- 2021: $4,948,264 (+$523,554, +11.83% from previous year)
- 2022: $6,185,513 (+$1,237,249, +25.00% from previous year)
- 2023: $5,457,308 ($-728,205, -11.77% from previous year)
- 2024: $5,744,999 (+$287,691, +5.27% from previous year)
- 2025: $5,926,078 (+$181,079, +3.15% from previous year)
Los Altos Hills has seen home prices rise by 132% since 2010, with the average value reaching nearly $5.93 million in 2025. The most dramatic appreciation occurred in 2022, when home values jumped by over $1.2 million in a single year. Although 2023 brought a notable dip, the market has steadily recovered since.
Los Altos Hills – Seclusion Meets Silicon Valley Prestige

🔥 Would you like to save this?
Los Altos Hills is the definition of low-density luxury. Nestled in the hills above Palo Alto and Los Altos, the town is known for its sprawling estates, winding roads, and strict residential-only zoning—there are no sidewalks or commercial districts. This deliberate planning has made it one of the most exclusive communities in Silicon Valley.
Residents here include tech executives, entrepreneurs, and investors who prize privacy and land. Despite a market correction in 2023, demand has remained resilient thanks to proximity to major tech campuses, elite schools, and a tranquil rural feel that’s increasingly rare in the Bay Area.
1. Atherton – 150% Home Price Increase Since 2010
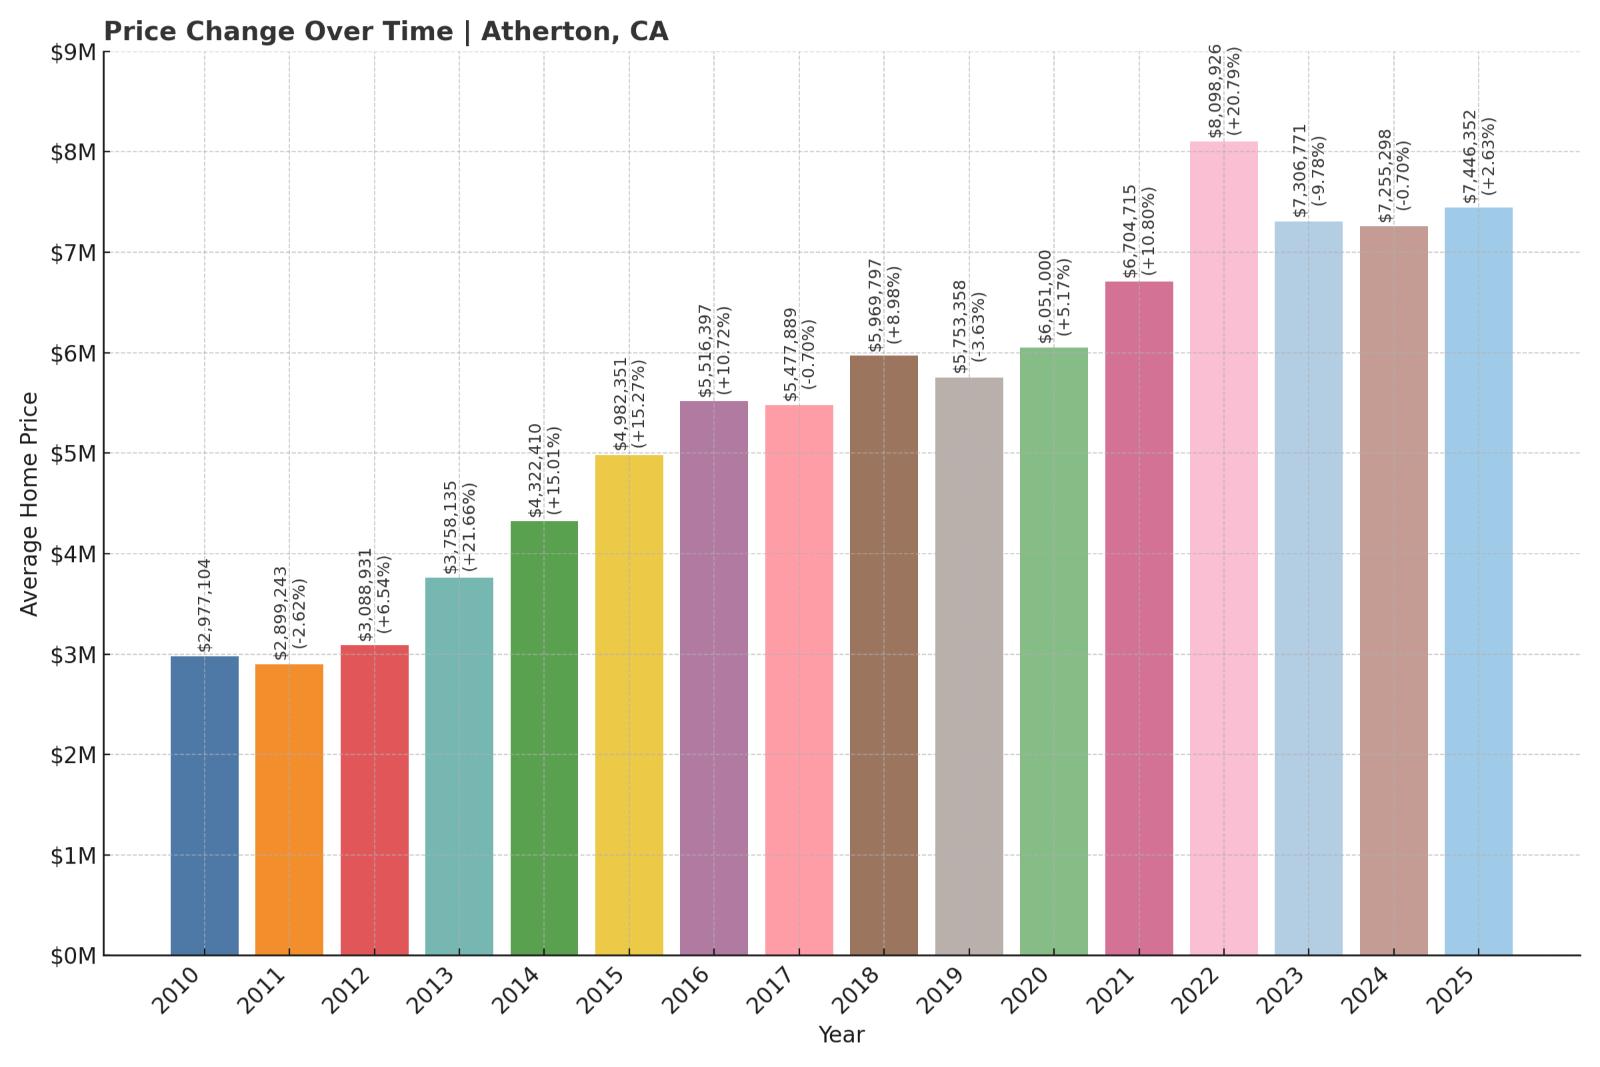
- 2010: $2,977,104
- 2011: $2,899,243 ($-77,861, -2.62% from previous year)
- 2012: $3,088,931 (+$189,688, +6.54% from previous year)
- 2013: $3,758,135 (+$669,204, +21.66% from previous year)
- 2014: $4,322,410 (+$564,275, +15.01% from previous year)
- 2015: $4,982,351 (+$659,941, +15.27% from previous year)
- 2016: $5,516,397 (+$534,046, +10.72% from previous year)
- 2017: $5,477,889 ($-38,508, -0.70% from previous year)
- 2018: $5,969,797 (+$491,908, +8.98% from previous year)
- 2019: $5,753,358 ($-216,439, -3.63% from previous year)
- 2020: $6,051,000 (+$297,642, +5.17% from previous year)
- 2021: $6,704,715 (+$653,715, +10.80% from previous year)
- 2022: $8,098,926 (+$1,394,212, +20.79% from previous year)
- 2023: $7,306,771 ($-792,155, -9.78% from previous year)
- 2024: $7,255,298 ($-51,473, -0.70% from previous year)
- 2025: $7,446,352 (+$191,054, +2.63% from previous year)
With a staggering average price of $7.45 million in 2025, Atherton remains California’s most expensive housing market. Prices have soared 150% since 2010, and despite some volatility, the town has held firm to its elite status at the top of Silicon Valley’s luxury tier.
Atherton – Elite, Exclusive, and Endlessly Expensive
Atherton is home to some of the wealthiest people in America—tech CEOs, venture capital titans, and business magnates. The town features palatial estates, private security patrols, and strict zoning laws that preserve large lots and ensure a residential-only atmosphere. There are no sidewalks, no businesses, and virtually no noise—just multi-acre compounds tucked behind hedges and gates.
Its central location between San Francisco and San Jose, coupled with the unmatched prestige of its address, keeps Atherton in a league of its own. Even with a dip after the 2022 peak, the market has stabilized and remains the gold standard for ultra-luxury real estate in California—and the nation.


