🔥 Would you like to save this?
Connecticut’s home prices may be up more than 10% this year, but not every market looks built to last. Zillow’s Home Value Index reveals warning signs in 21 towns—places where price surges, shaky momentum, and past crash patterns suggest a potential correction could be brewing. Some have been through this before. Others are riding too high, too fast. Using a mix of volatility data, long-term trends, and historical red flags, we pinpointed the spots most likely to wobble if the market shifts. If you own, invest, or plan to buy in the Nutmeg State, keep these towns on your radar.
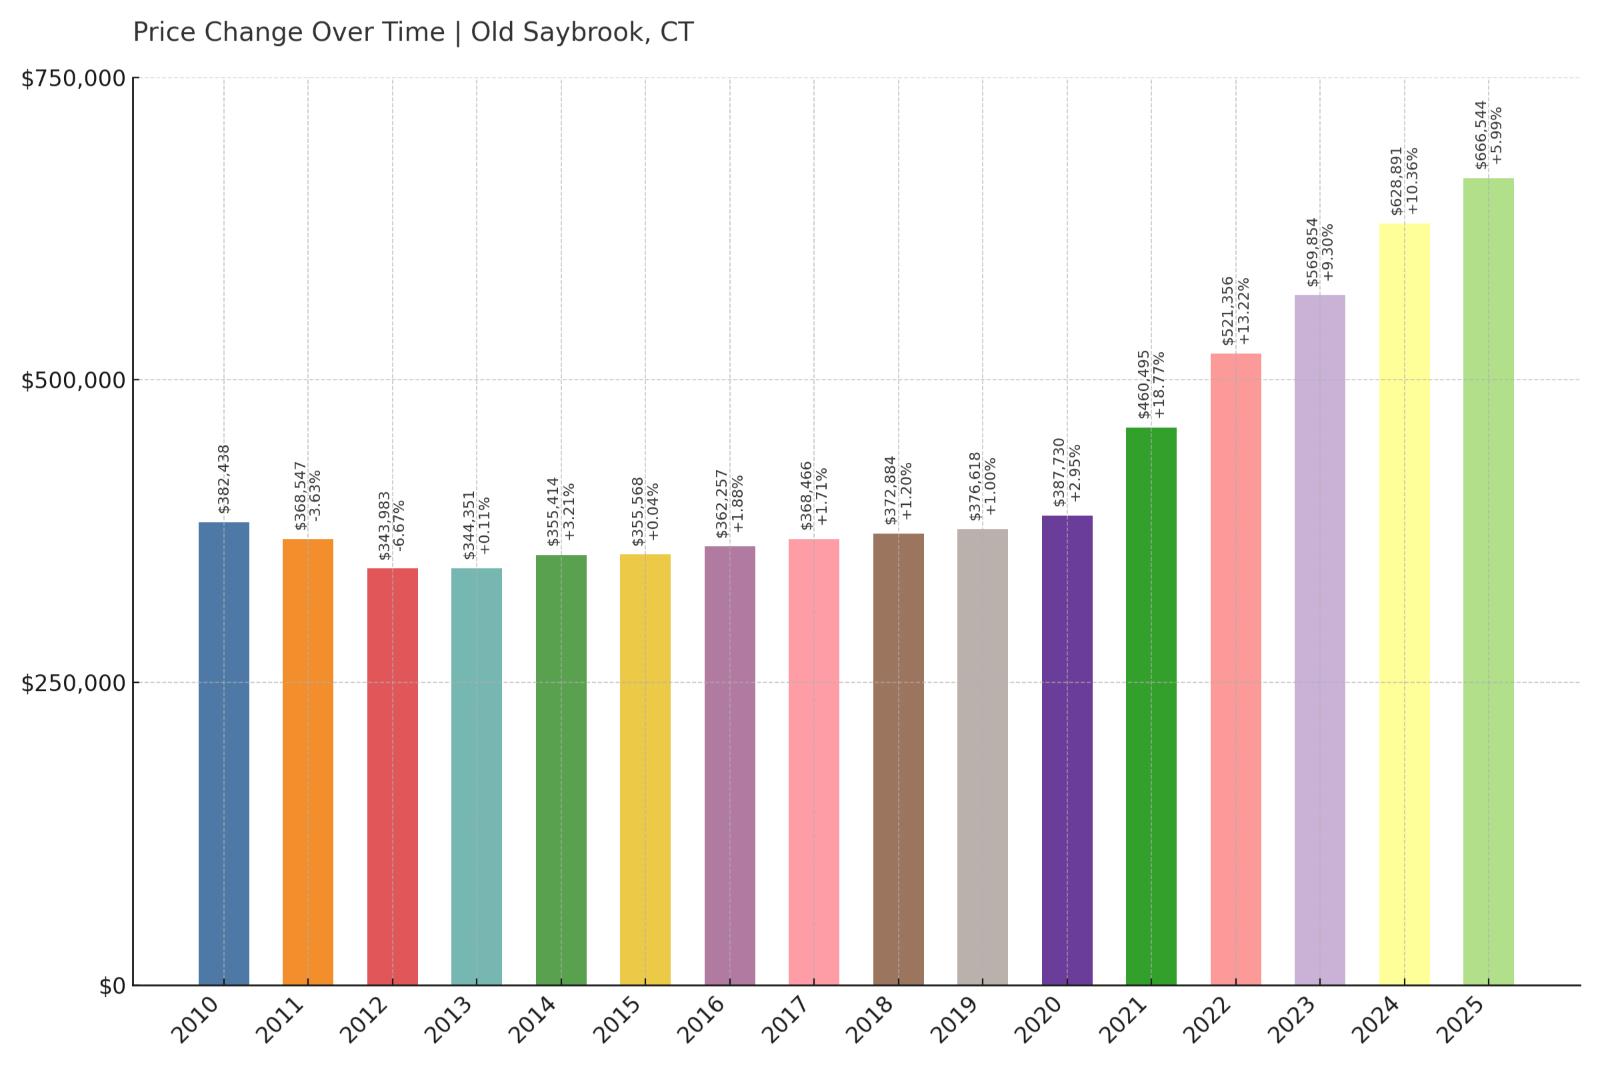
21. Old Saybrook – Crash Risk Percentage: 50.50%
- Crash Risk Percentage: 50.50%
- Historical crashes (8%+ drops): 0
- Worst historical crash: -6.7% (2012)
- Total price increase since 2010: 74.3%
- Overextended above long-term average: 55.3%
- Price volatility (annual swings): 6.8%
- Current 2025 price: $666,544
Old Saybrook’s housing market appears relatively stable on the surface, having avoided major crashes during the 2008-2012 financial crisis with only a 6.7% decline. However, the coastal town’s 74.3% price surge since 2010 has pushed values 55.3% above their long-term sustainable level. This dramatic appreciation has created a precarious situation where homes are mathematically overvalued despite the town’s desirable shoreline location and strong tourism economy.
In order to come up with the very specific design ideas, we create most designs with the assistance of state-of-the-art AI interior design software.
Old Saybrook – Coastal Premium Creating Vulnerability

Located along Connecticut’s shoreline between the Connecticut River and Long Island Sound, Old Saybrook has become a magnet for buyers seeking coastal living within commuting distance of major employment centers. The town’s historic charm, beach access, and highly-rated schools have driven intense demand that has outpaced fundamental economic indicators. Current median home prices of $666,544 reflect this coastal premium, but the 55.3% overextension suggests the market has moved beyond what local income levels can sustainably support.
The town’s economy relies heavily on tourism, seasonal residents, and commuters to Hartford and New Haven, creating inherent volatility during economic downturns. While Old Saybrook avoided major price declines during the last recession, the current level of overvaluation far exceeds what existed in 2007. The combination of stretched affordability and dependence on discretionary spending from higher-income buyers makes this market particularly vulnerable to external economic shocks that could trigger significant price corrections.
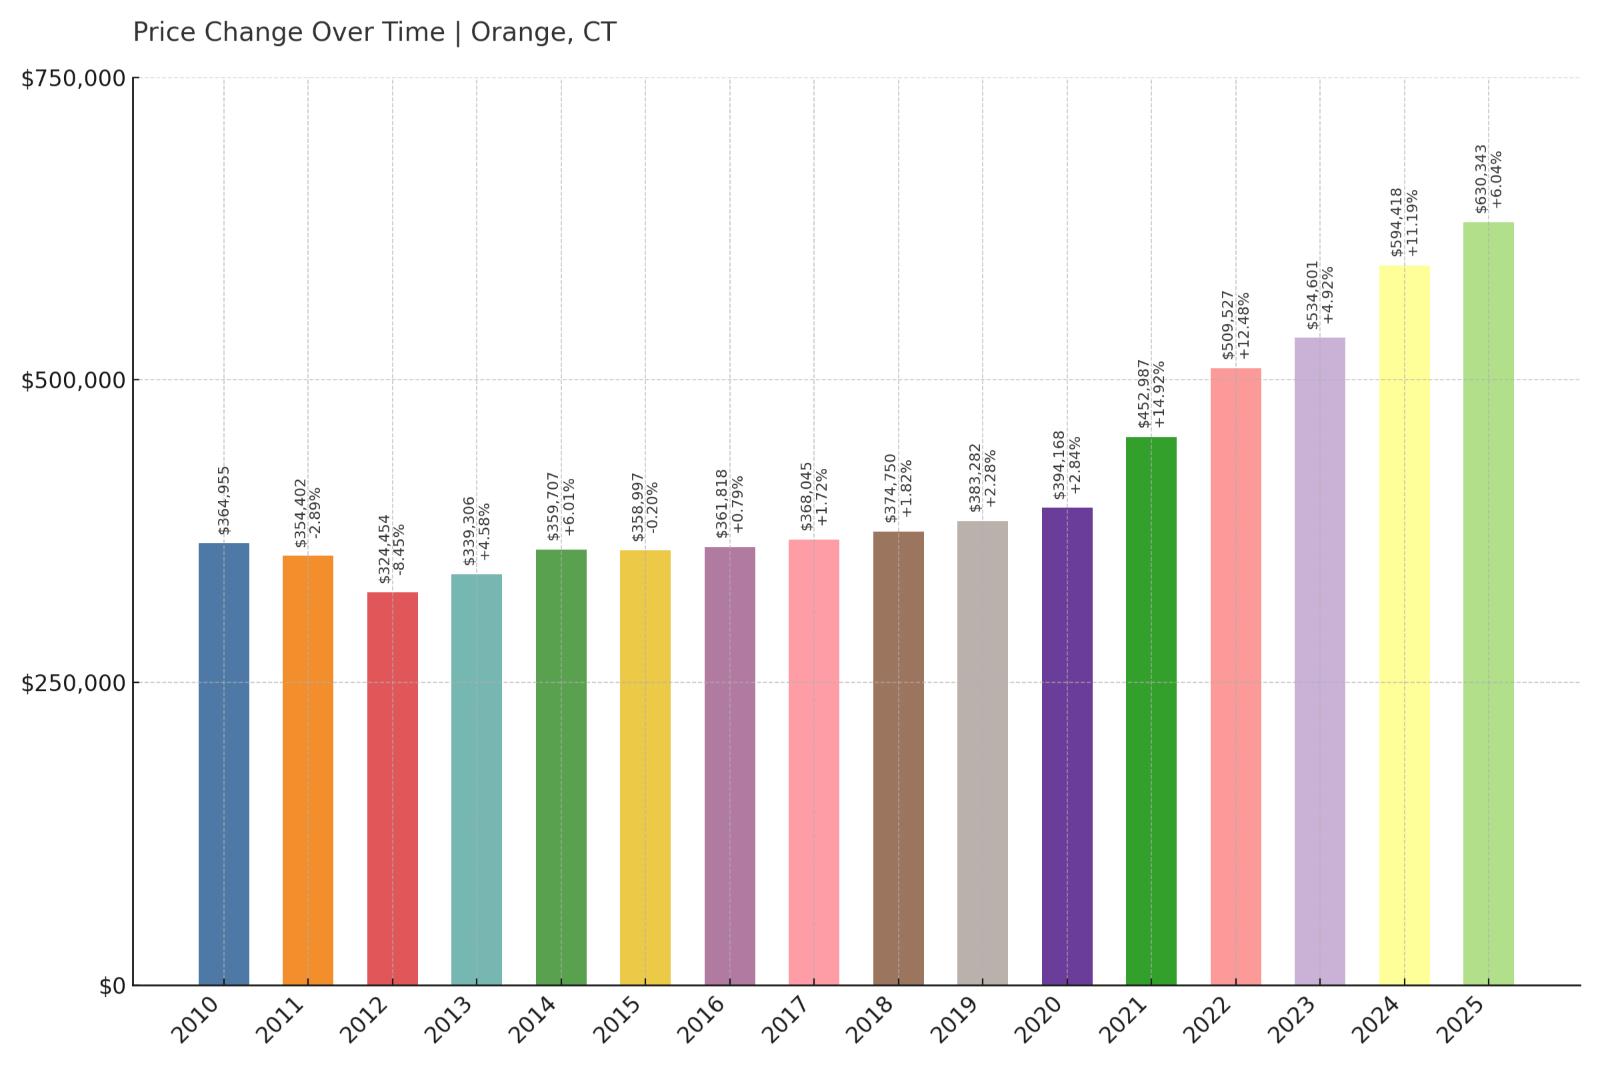
20. Orange – Crash Risk Percentage: 51.00%
- Crash Risk Percentage: 51.00%
- Historical crashes (8%+ drops): 1
- Worst historical crash: -8.5% (2012)
- Total price increase since 2010: 72.7%
- Overextended above long-term average: 50.4%
- Price volatility (annual swings): 5.8%
- Current 2025 price: $630,343
Orange demonstrates the classic pattern of a market that has learned to crash, experiencing an 8.5% decline in 2012 during the broader Connecticut housing correction. The suburban town’s 72.7% price appreciation since 2010 has created dangerous overextension at 50.4% above sustainable levels. Despite relatively low volatility at 5.8%, the combination of previous crash history and current overvaluation creates significant risk for homeowners who have seen their equity multiply over the past decade.
Orange – Suburban Overextension in New Haven County
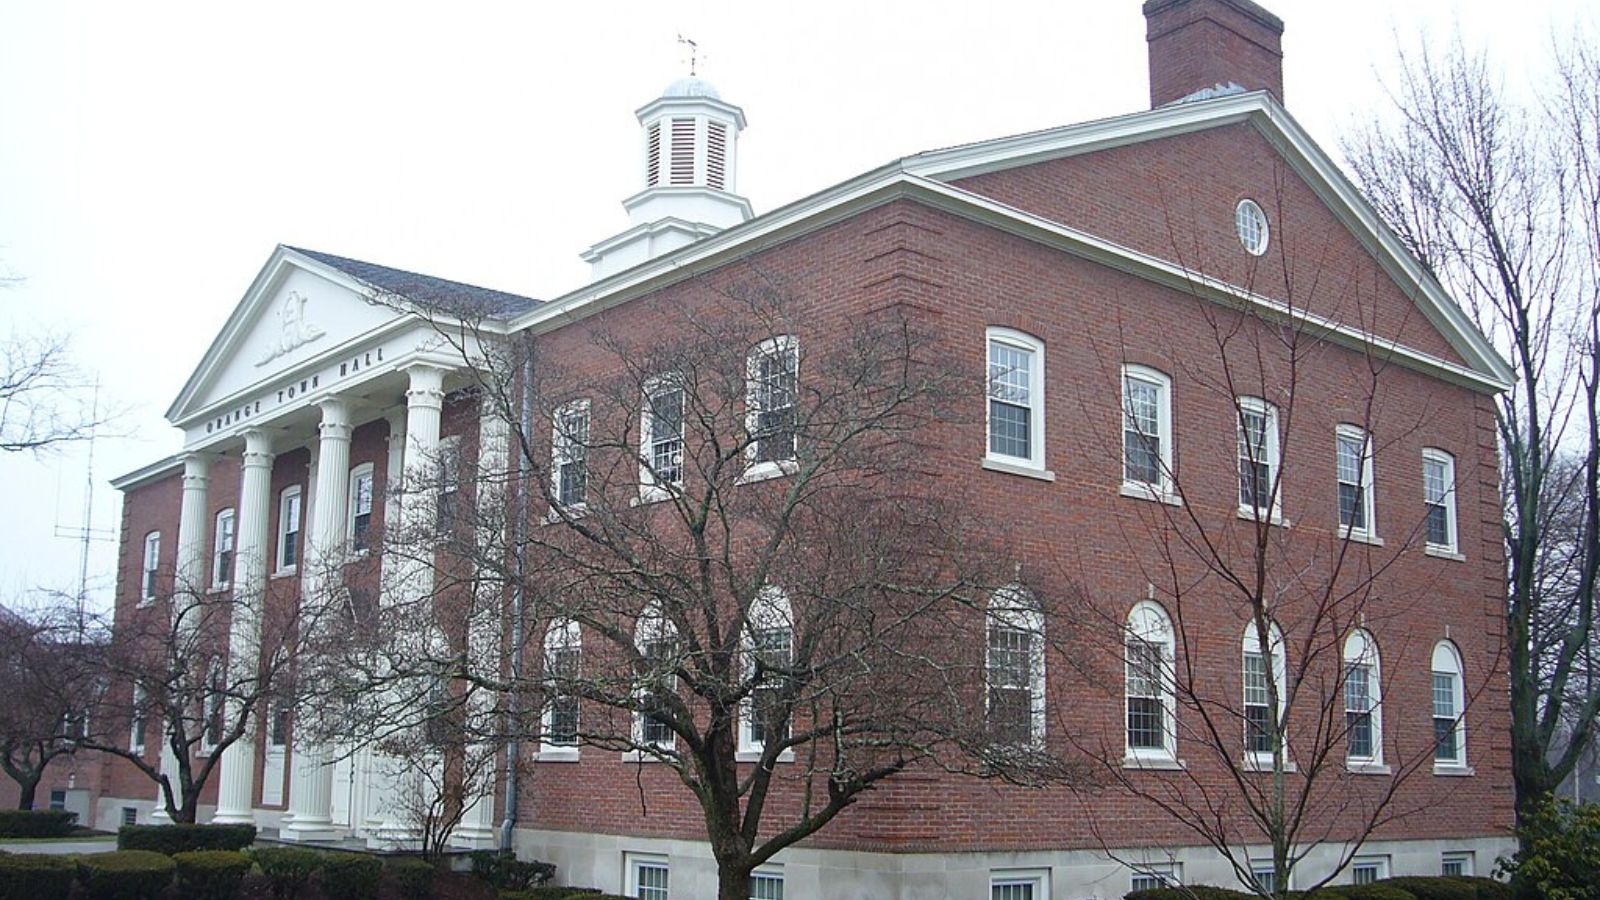
Situated in New Haven County with excellent schools and family-friendly neighborhoods, Orange has attracted buyers willing to stretch budgets for its suburban lifestyle and proximity to major employers. The town’s current median price of $630,343 reflects strong demand for its residential character, but this 50.4% overextension above long-term trends suggests prices have moved beyond fundamental support. Orange’s economy benefits from its location near Yale University, major hospitals, and corporate headquarters, yet this same proximity creates vulnerability to regional economic downturns.
The 2012 crash that caused an 8.5% decline occurred when Orange was significantly less overvalued than today’s levels. Current market conditions show mathematical similarities to pre-crash periods, with rapid appreciation pushing prices beyond what median household incomes can sustainably support. The town’s dependence on commuter buyers and higher-income residents makes it particularly susceptible to interest rate increases or economic uncertainty that could force rapid price adjustments to restore affordability.
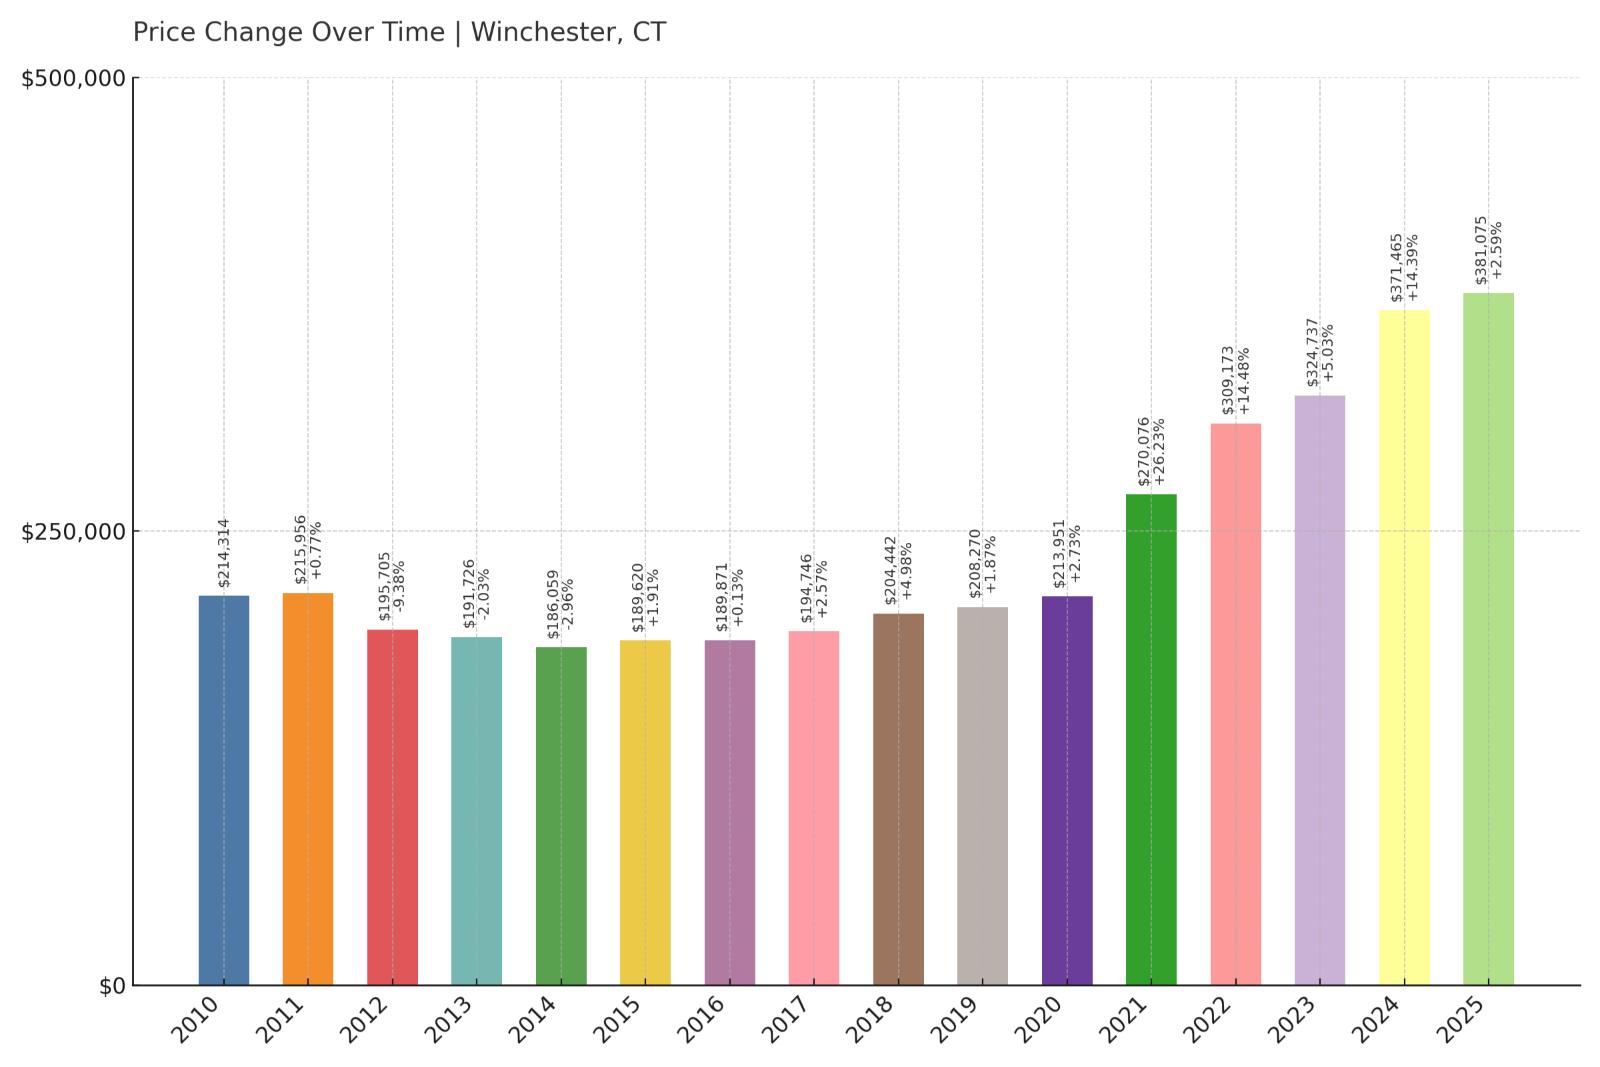
19. Winchester – Crash Risk Percentage: 51.05%
- Crash Risk Percentage: 51.05%
- Historical crashes (8%+ drops): 1
- Worst historical crash: -9.4% (2012)
- Total price increase since 2010: 77.8%
- Overextended above long-term average: 57.9%
- Price volatility (annual swings): 8.2%
- Current 2025 price: $381,075
Winchester’s housing market exhibits multiple warning signs of instability, including a previous 9.4% crash in 2012 and current overextension of 57.9% above sustainable levels. The rural Litchfield County town has experienced dramatic 77.8% price growth since 2010, pushing median values to $381,075 despite limited local employment opportunities. Higher price volatility at 8.2% indicates this market experiences more dramatic swings than many Connecticut communities, suggesting greater sensitivity to economic changes.
Winchester – Rural Market Showing Crash Vulnerability
Located in northwestern Connecticut’s Litchfield County, Winchester offers rural charm and outdoor recreation opportunities that have attracted buyers seeking alternatives to urban living. However, the town’s economy relies heavily on commuter income and seasonal residents, creating inherent instability during economic downturns. The 77.8% price appreciation since 2010 has pushed homes 57.9% above their long-term sustainable levels, creating a dangerous disconnect between local economic fundamentals and housing costs.
Winchester’s previous 9.4% crash in 2012 demonstrates this market’s vulnerability to broader economic pressures, and current conditions suggest even greater risk today. The combination of limited local employment, higher price volatility, and extreme overvaluation creates conditions similar to those that preceded the last major correction. Rural markets like Winchester often experience more severe price swings than urban areas due to thinner buyer pools and greater dependence on discretionary purchases by higher-income buyers who can delay home purchases during uncertain times.
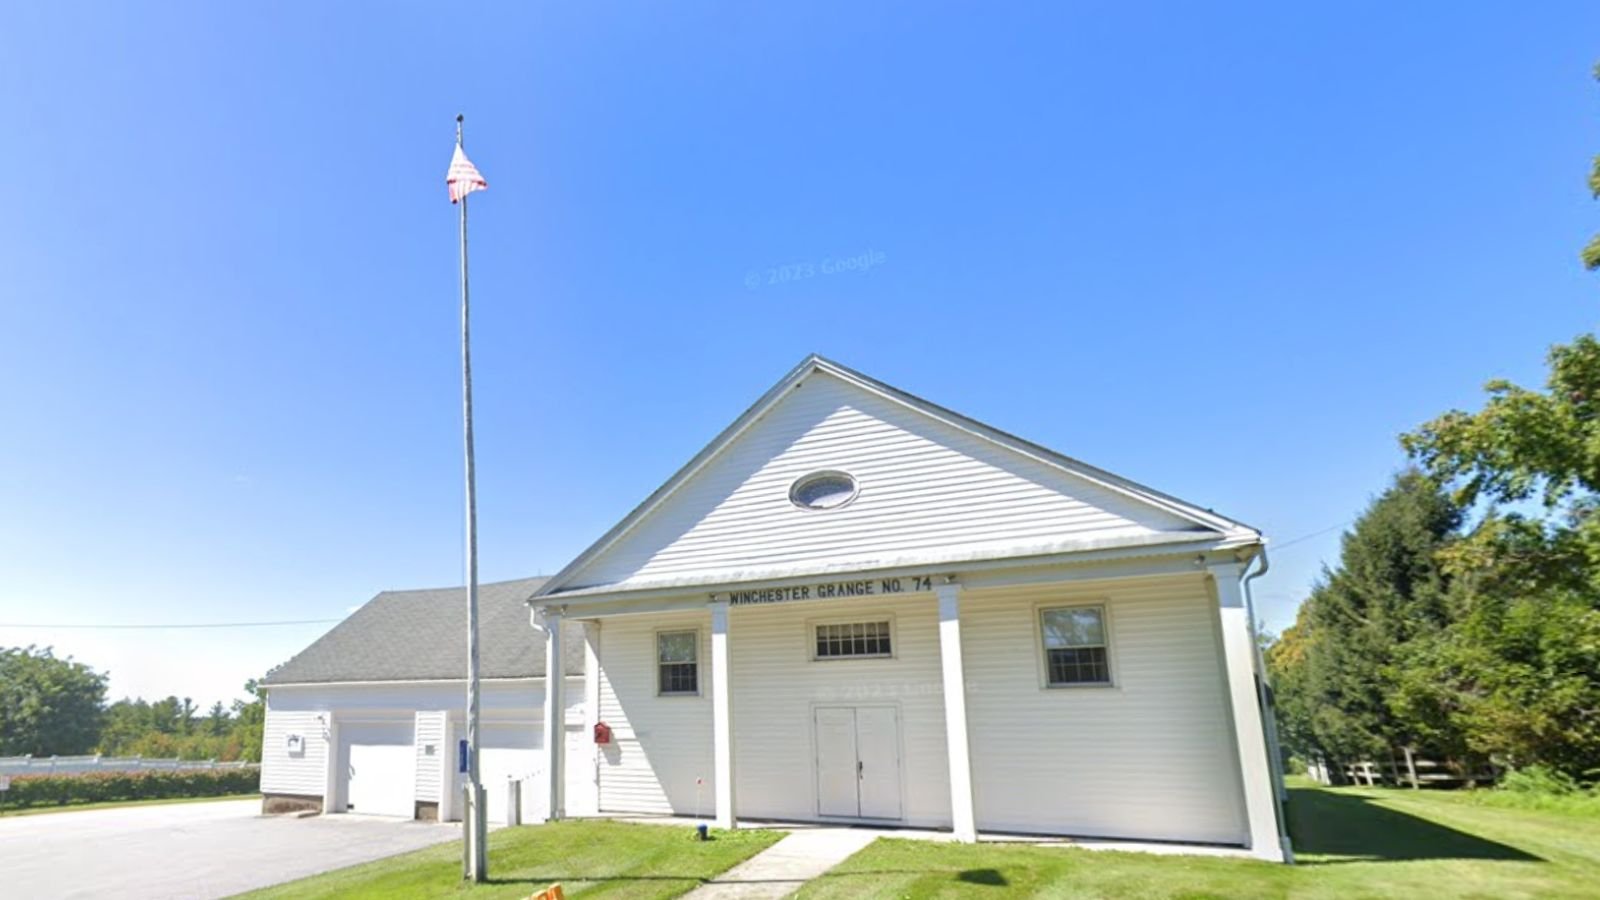
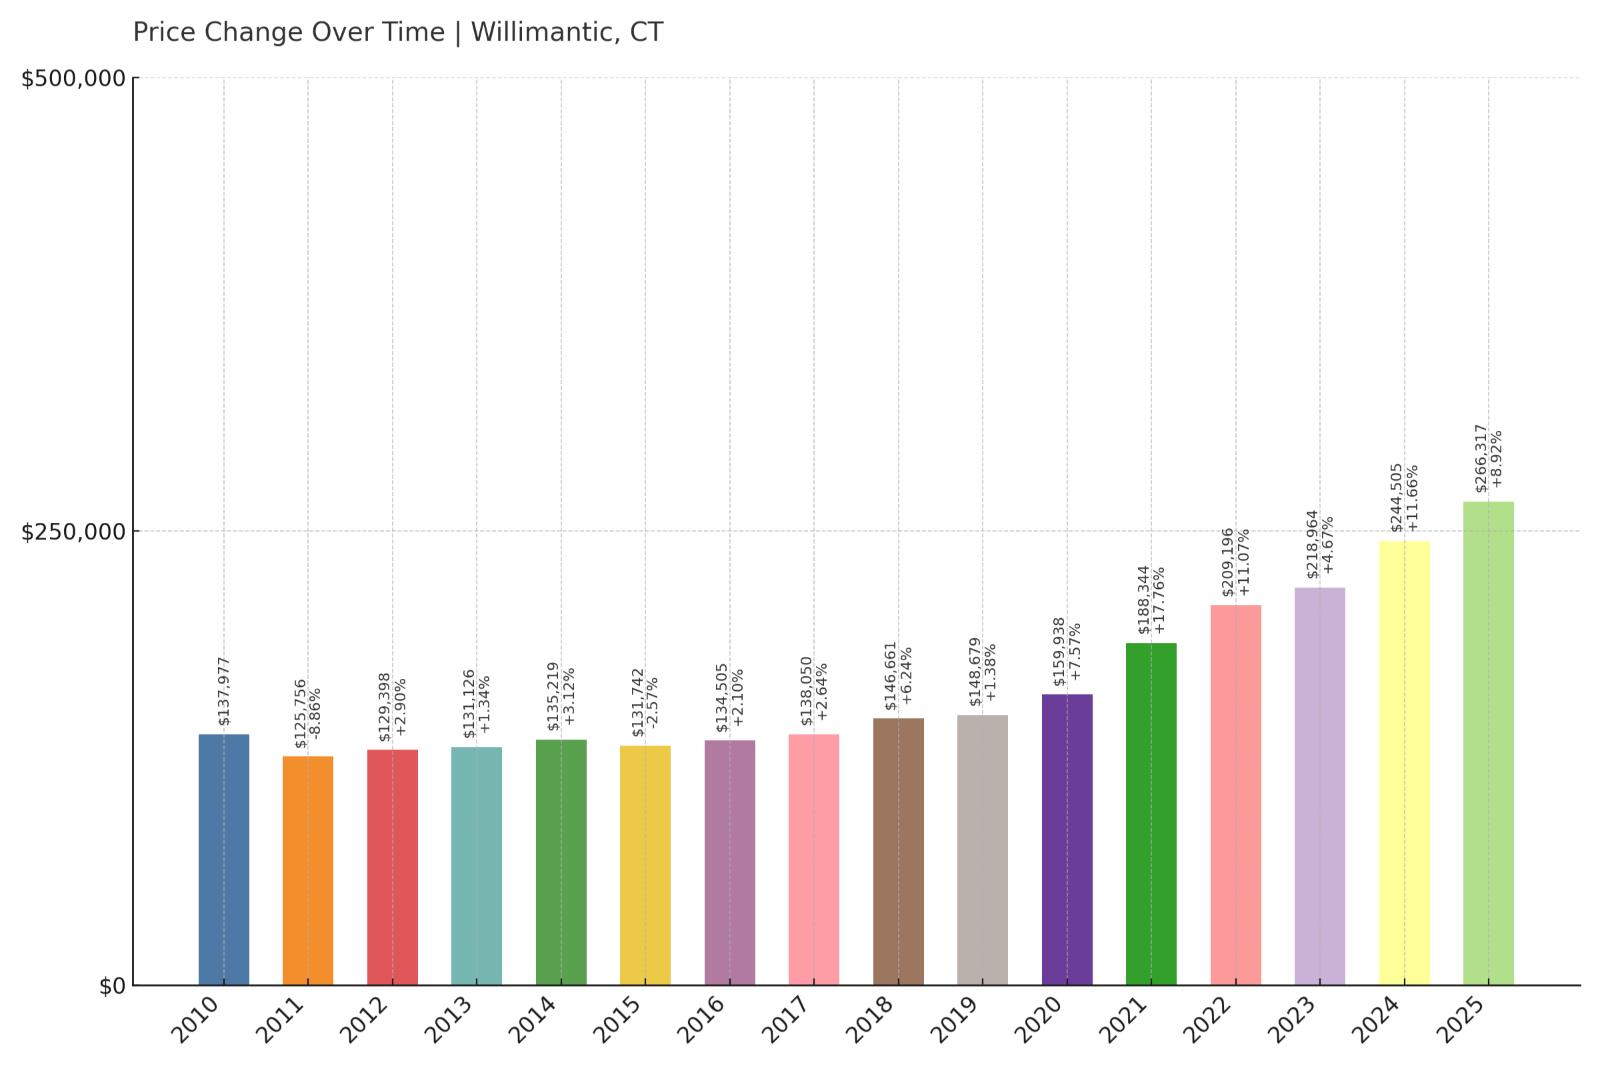
18. Willimantic – Crash Risk Percentage: 51.15%
- Crash Risk Percentage: 51.15%
- Historical crashes (8%+ drops): 1
- Worst historical crash: -8.9% (2011)
- Total price increase since 2010: 93.0%
- Overextended above long-term average: 61.0%
- Price volatility (annual swings): 6.1%
- Current 2025 price: $266,317
Willimantic presents a particularly concerning case with explosive 93.0% price growth since 2010 pushing the market 61.0% above sustainable levels. This college town experienced an 8.9% crash in 2011, demonstrating its vulnerability to economic cycles. Despite relatively affordable median prices at $266,317, the degree of overextension suggests current values are mathematically unsustainable given local economic conditions and income levels in this eastern Connecticut community.
Willimantic – College Town Bubble Dynamics
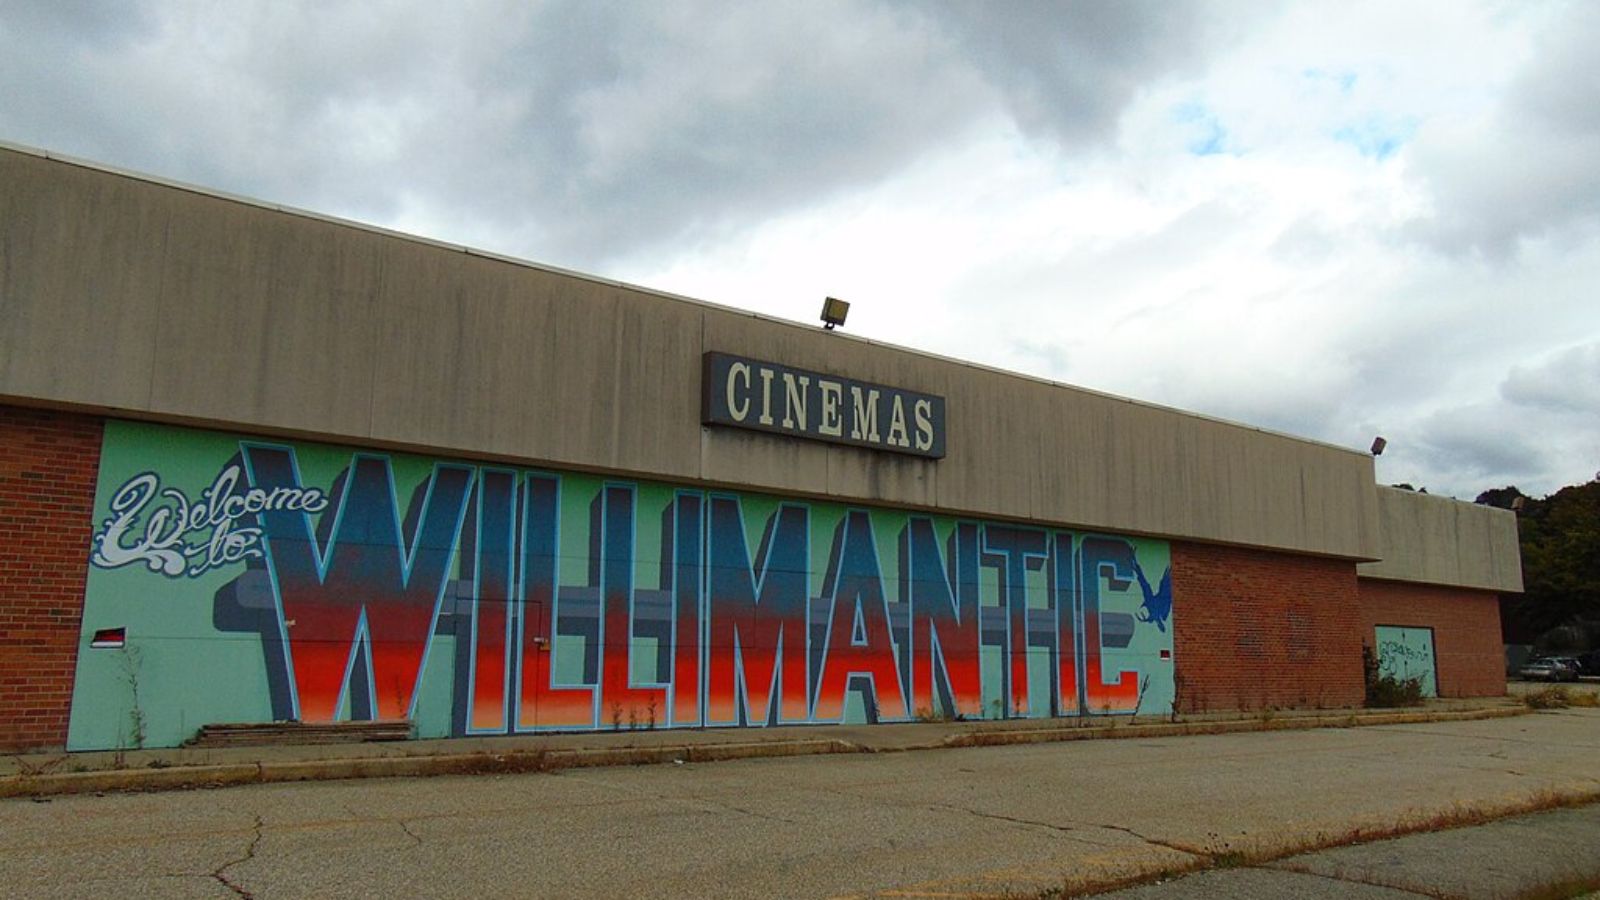
Home to the University of Connecticut’s regional campus, Willimantic’s housing market reflects classic college town dynamics with investor activity and student housing demand driving prices beyond what local employment can support. The dramatic 93.0% price appreciation since 2010 has created the highest overextension ratio among lower-priced Connecticut markets at 61.0% above long-term trends. This level of overvaluation in a community with limited economic diversity outside the university creates significant vulnerability to market corrections.
The 2011 crash that produced an 8.9% decline occurred when Willimantic was far less overextended than current levels, suggesting today’s market faces even greater correction risk. College towns often experience boom-bust cycles tied to enrollment changes, state funding for higher education, and investor sentiment around student housing. Current prices of $266,317 may appear affordable compared to other Connecticut markets, but they represent dangerous overvaluation relative to local income levels and economic fundamentals that could trigger significant price reversion.
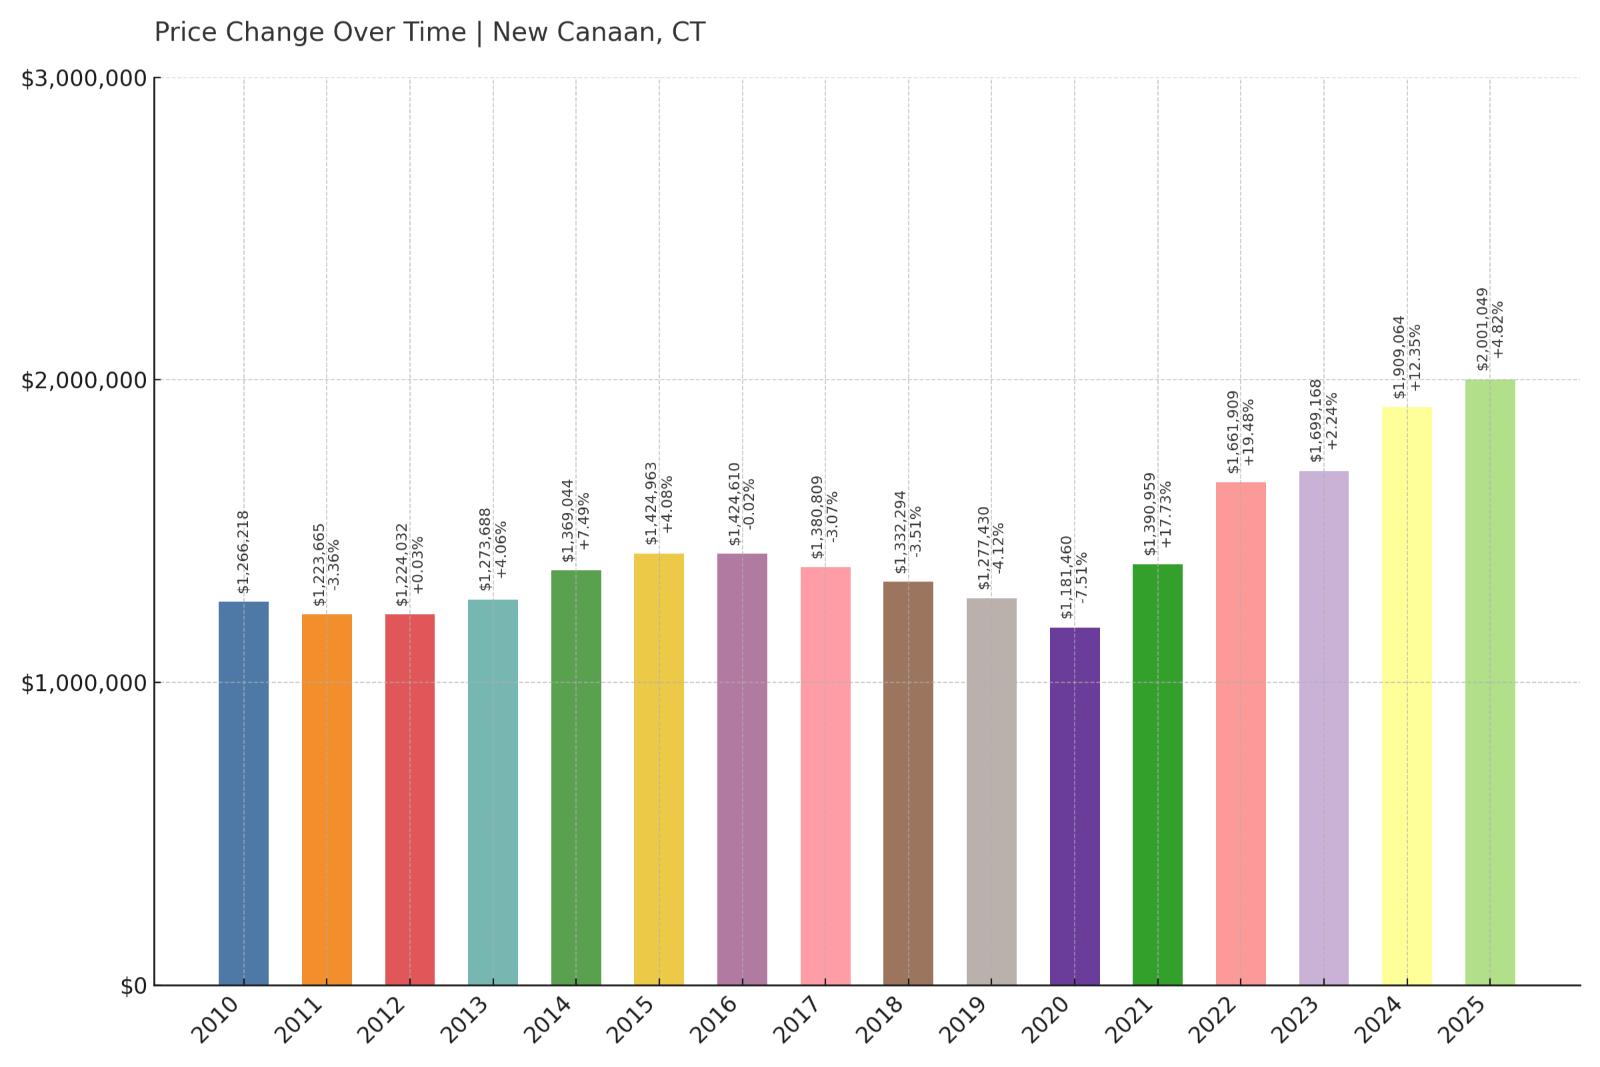
17. New Canaan – Crash Risk Percentage: 51.30%
- Crash Risk Percentage: 51.30%
- Historical crashes (8%+ drops): 0
- Worst historical crash: -7.5% (2020)
- Total price increase since 2010: 58.0%
- Overextended above long-term average: 39.0%
- Price volatility (annual swings): 6.2%
- Current 2025 price: $2,001,049
New Canaan’s luxury market shows warning signs despite its reputation for stability, with median home prices reaching $2,001,049 and the market extended 39.0% above long-term averages. While the wealthy Fairfield County enclave avoided major crashes during the 2008-2012 crisis, it did experience a 7.5% decline in 2020, suggesting even affluent markets face correction risk. The 58.0% price appreciation since 2010 has pushed this already expensive market into potentially unsustainable territory.
New Canaan – Luxury Market Vulnerability

As one of Connecticut’s most affluent communities, New Canaan attracts high-earning professionals who commute to New York City and regional financial centers. The town’s excellent schools, historic charm, and proximity to Manhattan have created intense demand that has driven median prices above $2 million. However, even luxury markets face mathematical limits, and the current 39.0% overextension suggests prices have moved beyond what even high-income buyers can sustainably support, particularly if economic conditions deteriorate or tax policies change.
The 2020 decline of 7.5% occurred during a period of significant uncertainty around remote work and urban exodus trends that initially benefited suburban markets like New Canaan. Current conditions present different but equally serious risks, including potential changes to state and local tax policies, interest rate impacts on jumbo mortgages, and broader economic uncertainty affecting high-income employment. Luxury markets often experience sharper corrections than average-priced communities because discretionary buyers can more easily delay purchases, and seller motivation can evaporate quickly when market sentiment shifts.
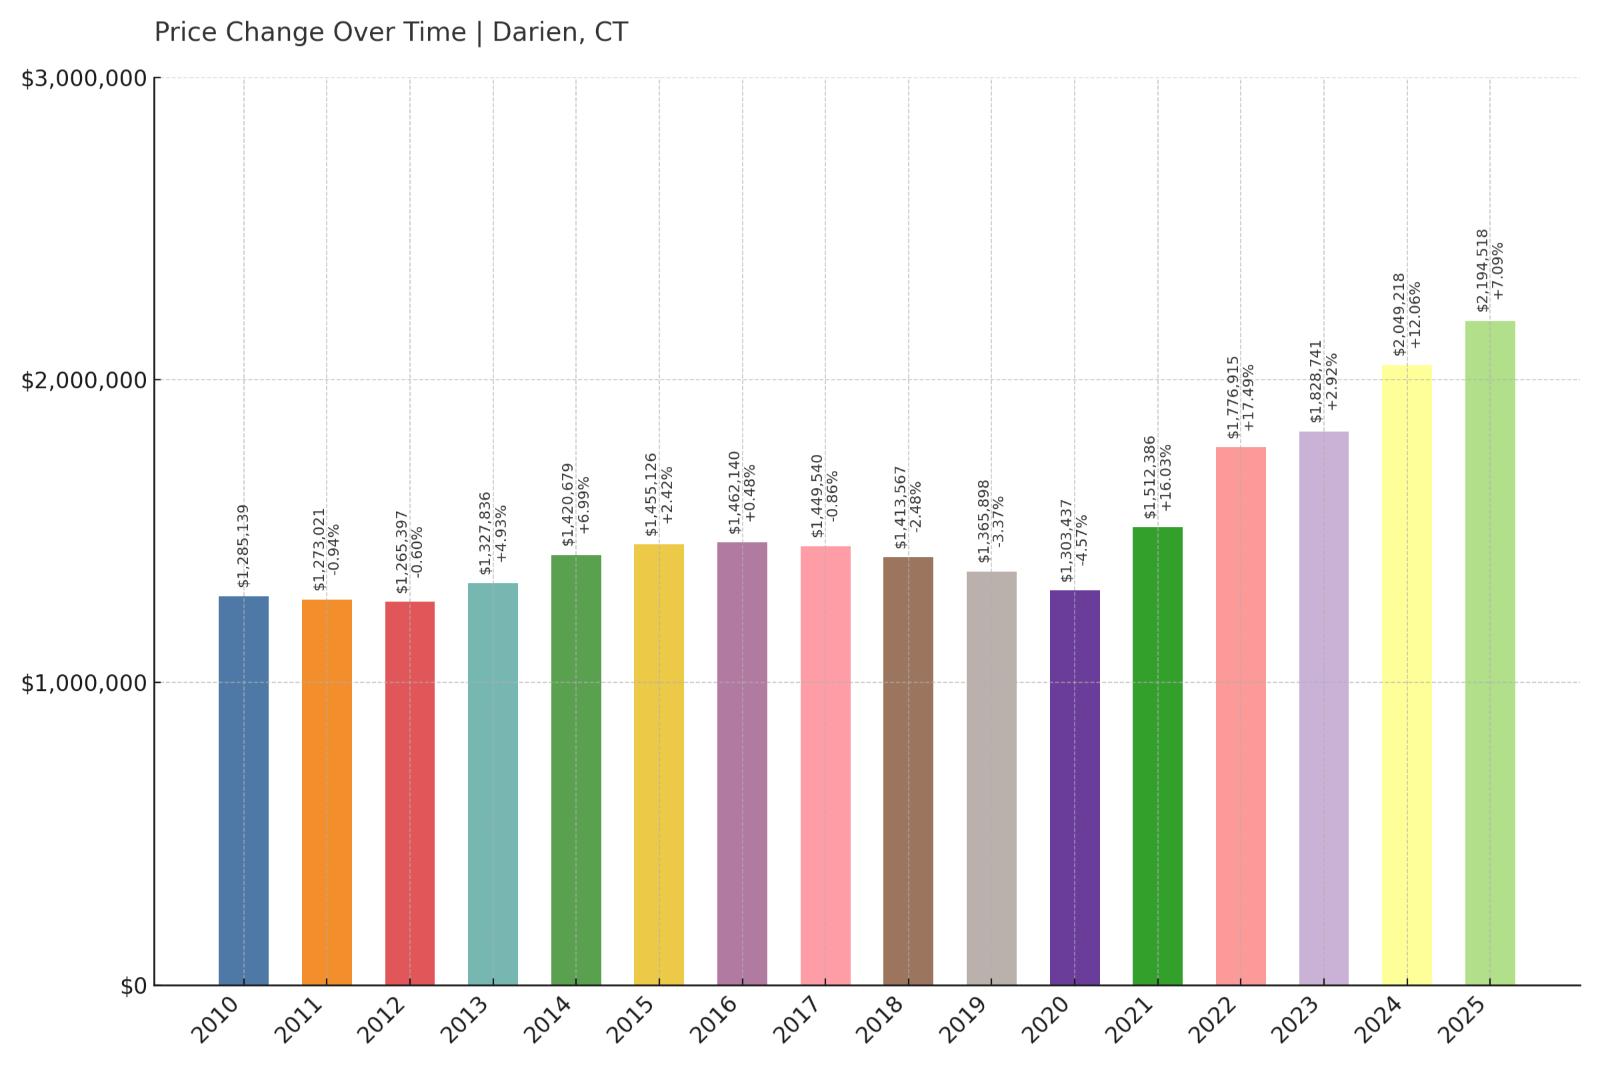
16. Darien – Crash Risk Percentage: 51.40%
- Crash Risk Percentage: 51.40%
- Historical crashes (8%+ drops): 0
- Worst historical crash: -4.6% (2020)
- Total price increase since 2010: 70.8%
- Overextended above long-term average: 44.0%
- Price volatility (annual swings): 5.9%
- Current 2025 price: $2,194,518
Darien represents Connecticut’s most expensive housing market with median prices at $2,194,518, reflecting the town’s status as a premier commuter community for New York City financial professionals. The 70.8% price appreciation since 2010 has pushed this luxury market 44.0% above sustainable levels, creating vulnerability despite the town’s historically stable performance. Even the modest 4.6% decline in 2020 demonstrates that high-end markets can experience corrections when economic conditions shift.
Darien – Peak Luxury Market Risks
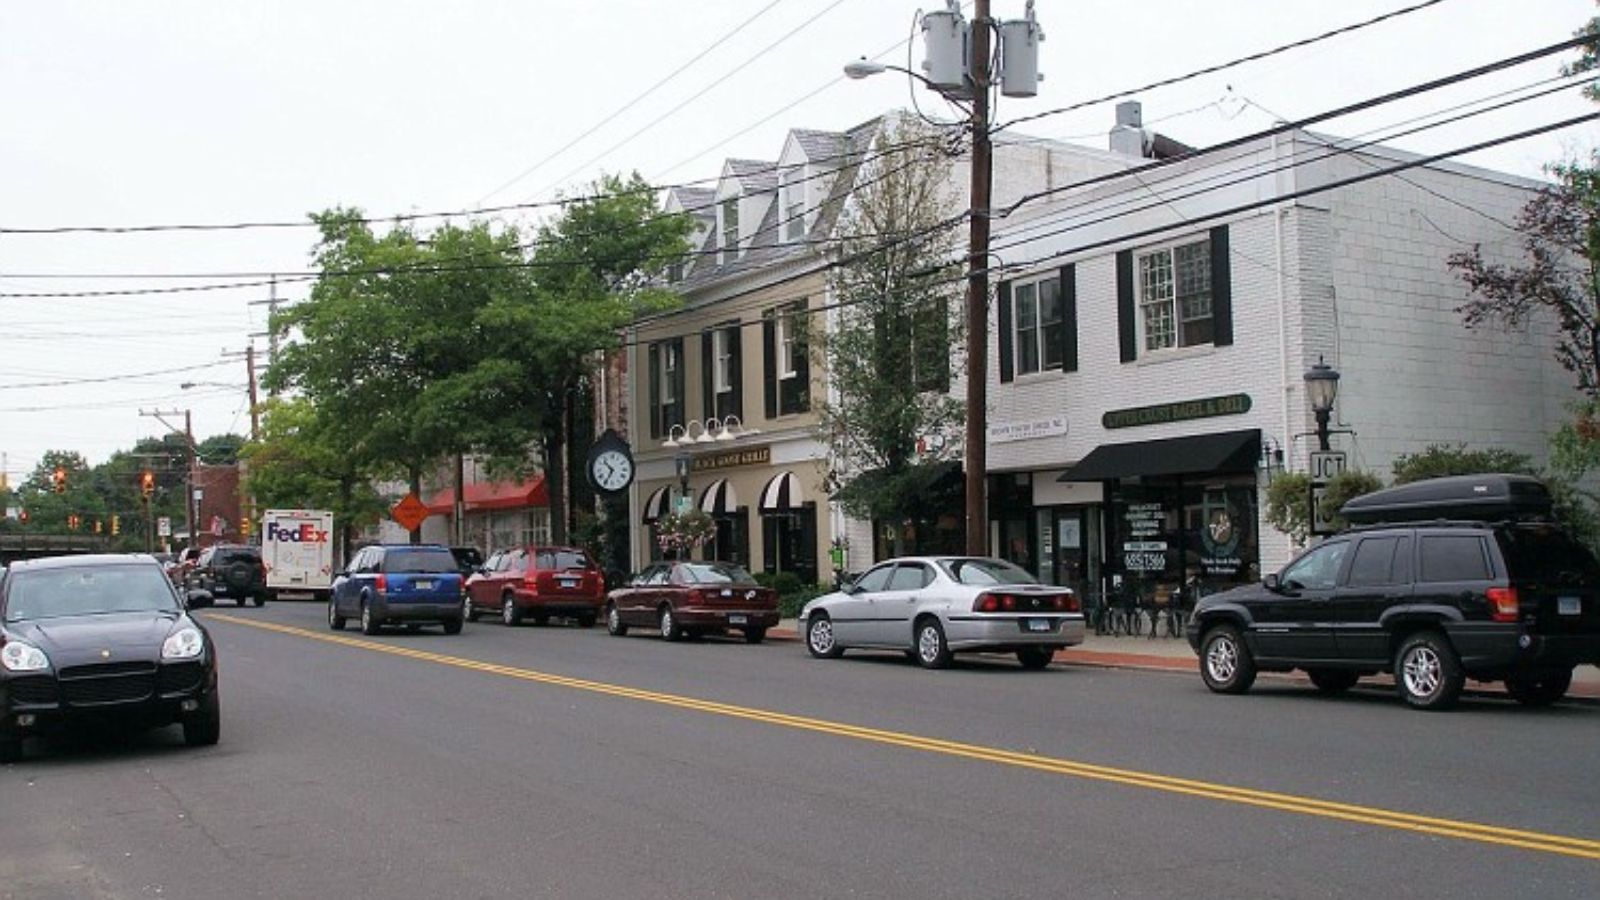
Located in lower Fairfield County with direct train access to Manhattan, Darien has long been considered Connecticut’s gold standard for affluent suburban living. The town’s top-rated schools, pristine neighborhoods, and proximity to major financial centers have created seemingly insatiable demand that has driven prices to unprecedented levels. However, current median values above $2.1 million represent a 44.0% premium over historical norms, suggesting even this elite market has reached potentially unsustainable territory.
Darien’s economy depends heavily on high-income commuters working in finance, law, and other professional services, creating vulnerability to sector-specific downturns or changes in remote work policies. The 2020 decline, though modest at 4.6%, occurred despite massive fiscal stimulus and historically low interest rates, suggesting this market is more sensitive to economic shifts than previously believed. Current conditions present multiple risk factors including rising borrowing costs for jumbo mortgages, potential tax policy changes, and broader economic uncertainty that could force significant price adjustments in this previously stable luxury enclave.
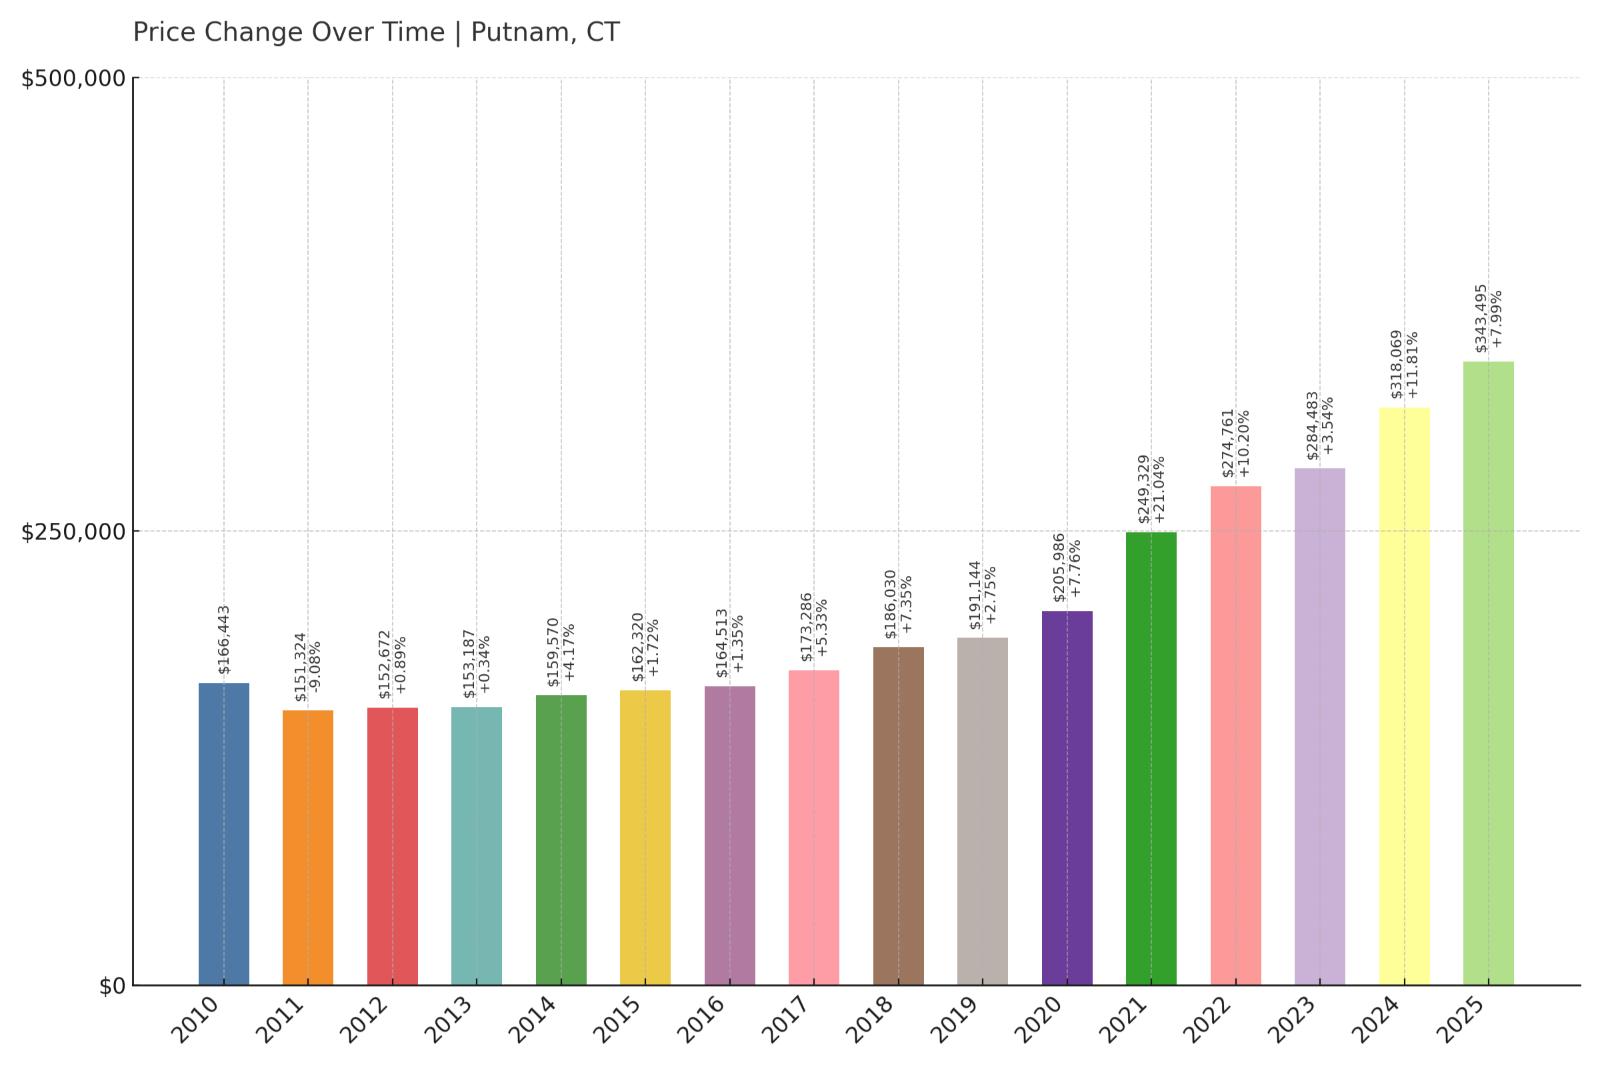
15. Putnam – Crash Risk Percentage: 52.05%
🔥 Would you like to save this?
- Crash Risk Percentage: 52.05%
- Historical crashes (8%+ drops): 1
- Worst historical crash: -9.1% (2011)
- Total price increase since 2010: 106.4%
- Overextended above long-term average: 64.7%
- Price volatility (annual swings): 6.4%
- Current 2025 price: $343,495
Putnam’s housing market shows extreme warning signs with explosive 106.4% price growth since 2010 pushing values 64.7% above sustainable levels. This northeastern Connecticut town experienced a significant 9.1% crash in 2011, establishing a pattern of vulnerability to economic downturns. The dramatic price appreciation has taken median values to $343,495, but this represents dangerous overextension in a community with limited economic diversity and employment opportunities.
Putnam – Small Town Boom-Bust Cycle

Located near the Massachusetts and Rhode Island borders, Putnam has transformed from a struggling former mill town into a popular destination for buyers seeking affordable alternatives to urban markets. The town’s historic downtown revitalization and antique shopping district have attracted new residents, but the 106.4% price surge since 2010 has created unsustainable market conditions. This level of appreciation far exceeds local economic growth and income levels, suggesting prices have been driven by speculation and external buyer demand rather than fundamental economic strength.
The 2011 crash that produced a 9.1% decline occurred when Putnam was significantly less overvalued than current conditions, indicating today’s market faces much greater correction risk. Small towns like Putnam often experience more volatile housing cycles because they have thinner buyer pools and limited economic diversity to support elevated price levels. The current 64.7% overextension represents one of the highest risk ratios among Connecticut communities, suggesting significant price reversion may be necessary to restore market equilibrium and affordability for local buyers.
14. South Windham – Crash Risk Percentage: 52.15%
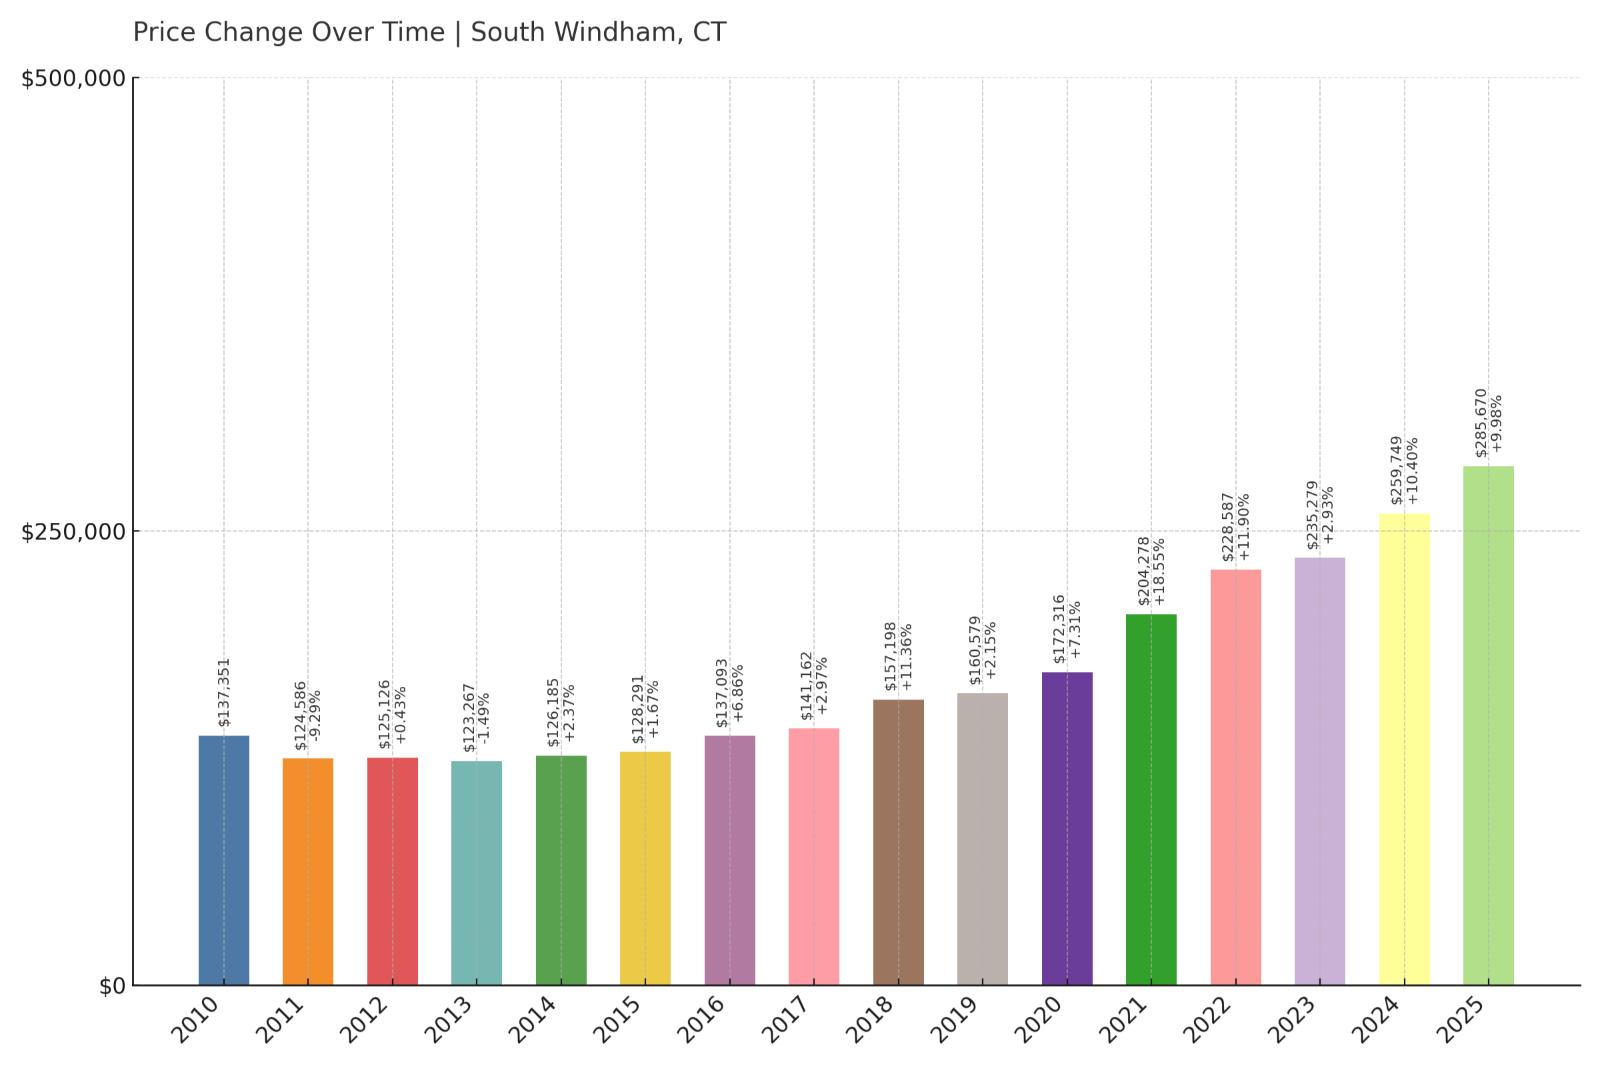
- Crash Risk Percentage: 52.15%
- Historical crashes (8%+ drops): 1
- Worst historical crash: -9.3% (2011)
- Total price increase since 2010: 108.0%
- Overextended above long-term average: 66.4%
- Price volatility (annual swings): 6.5%
- Current 2025 price: $285,670
South Windham presents one of Connecticut’s most concerning housing market scenarios with staggering 108.0% price growth since 2010 pushing the market 66.4% above sustainable levels. This eastern Connecticut community crashed 9.3% in 2011, demonstrating vulnerability to economic cycles. Despite relatively affordable median prices at $285,670, the extreme level of overextension suggests current values are mathematically impossible to sustain given local economic conditions.
South Windham – Rural Overheating Warning
Part of the larger Windham area in eastern Connecticut, South Windham has experienced dramatic price appreciation as buyers have sought affordable alternatives to higher-priced markets. The community’s rural character and lower cost of living initially attracted value-conscious buyers, but the resulting 108.0% price surge has created dangerous market conditions. This level of appreciation represents pure speculation rather than economic fundamentals, as local employment and income growth have not kept pace with housing cost increases.
The 2011 crash occurred when South Windham was far less overextended than current levels, suggesting today’s market faces catastrophic correction risk. Rural communities often experience the most severe boom-bust cycles because they lack economic diversity and depend heavily on external buyer demand that can evaporate quickly during uncertain times. The current 66.4% overextension represents unsustainable market conditions that will likely require significant price reversion to restore equilibrium between housing costs and local economic capacity.
13. Kent – Crash Risk Percentage: 52.22%
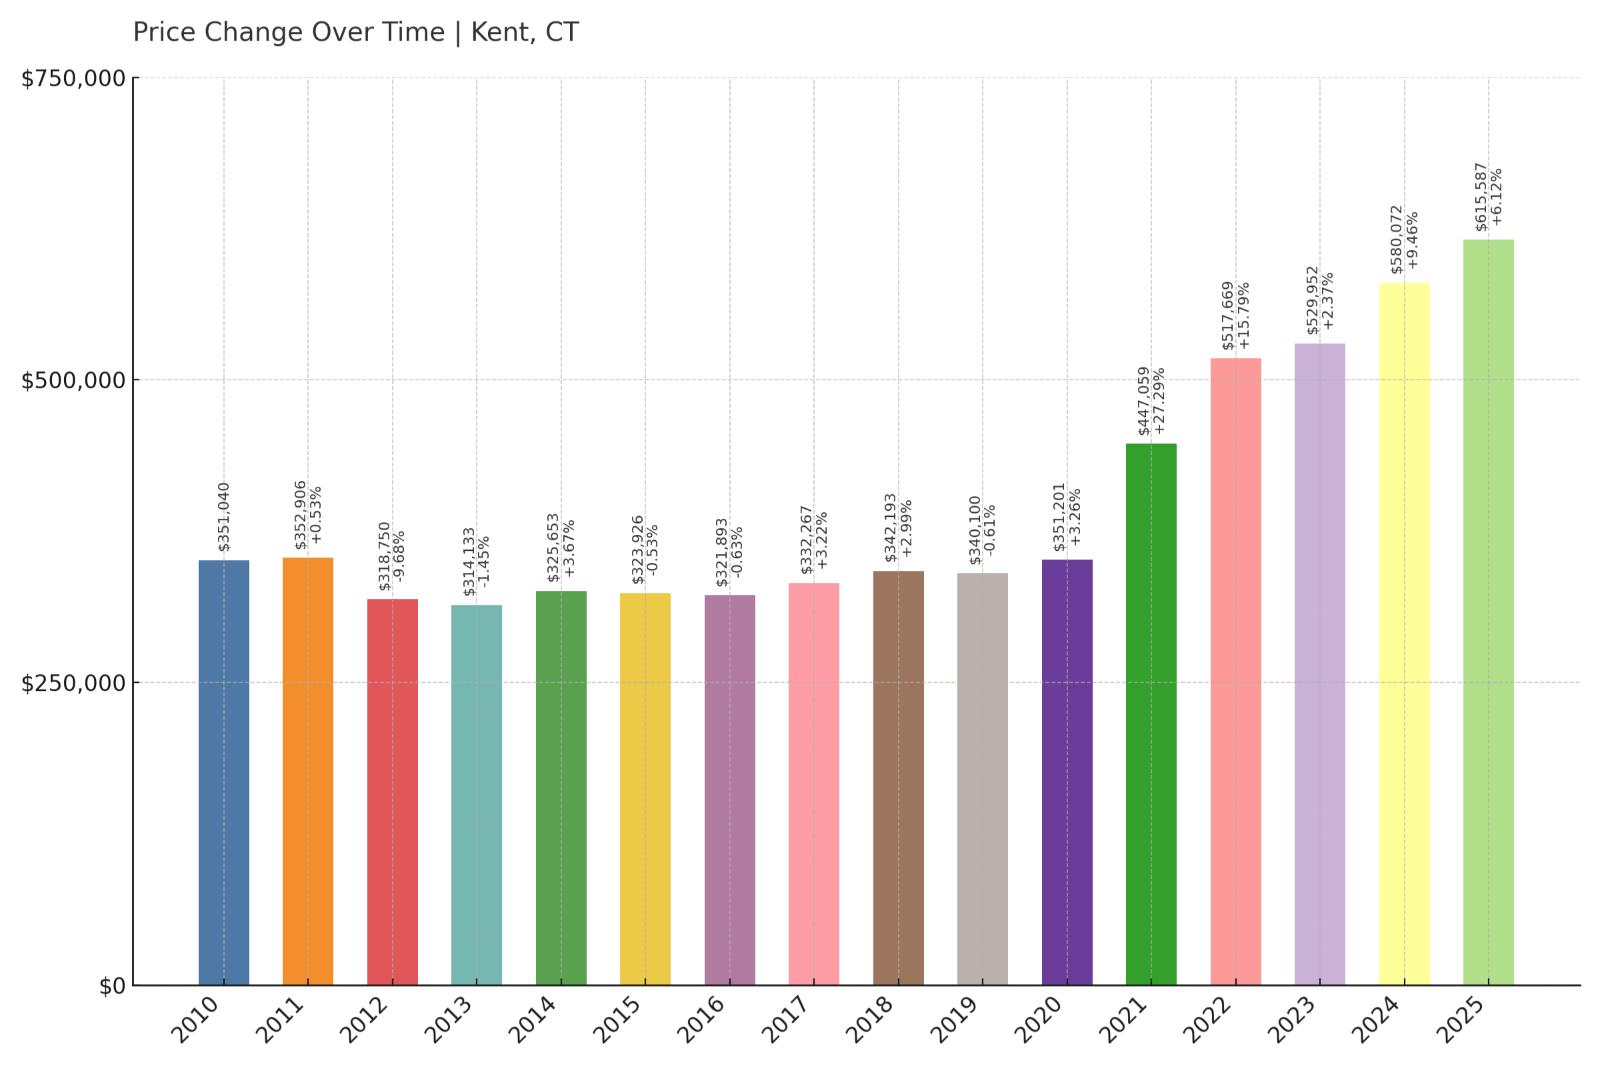
- Crash Risk Percentage: 52.22%
- Historical crashes (8%+ drops): 1
- Worst historical crash: -9.7% (2012)
- Total price increase since 2010: 75.4%
- Overextended above long-term average: 54.8%
- Price volatility (annual swings): 8.2%
- Current 2025 price: $615,587
Kent’s picturesque Litchfield County location has driven significant price appreciation, but the 9.7% crash in 2012 demonstrates this market’s vulnerability to corrections. The 75.4% price growth since 2010 has pushed median values to $615,587 while extending the market 54.8% above sustainable levels. Higher price volatility at 8.2% indicates this rural community experiences more dramatic market swings than many Connecticut towns, suggesting greater sensitivity to economic changes and buyer sentiment shifts.
Kent – Scenic Market Instability
Located in northwestern Connecticut’s scenic Litchfield Hills, Kent attracts buyers seeking rural beauty and recreational opportunities near New York state borders. The town’s natural attractions, including Kent Falls State Park and the Appalachian Trail, have created demand from both primary and secondary home buyers. However, this recreational market dependence creates inherent volatility, as evidenced by the significant 9.7% crash in 2012 when discretionary real estate spending declined during economic uncertainty.
Current market conditions show greater risk than existed before the 2012 correction, with prices now 54.8% above long-term sustainable levels compared to lower overextension ratios during the previous crash. Rural recreational markets like Kent often experience severe corrections because they depend on discretionary spending by higher-income buyers who can easily postpone or cancel purchases during uncertain times. The combination of previous crash history, current overvaluation, and high price volatility creates conditions for potentially significant price reversion in this scenic but economically vulnerable community.
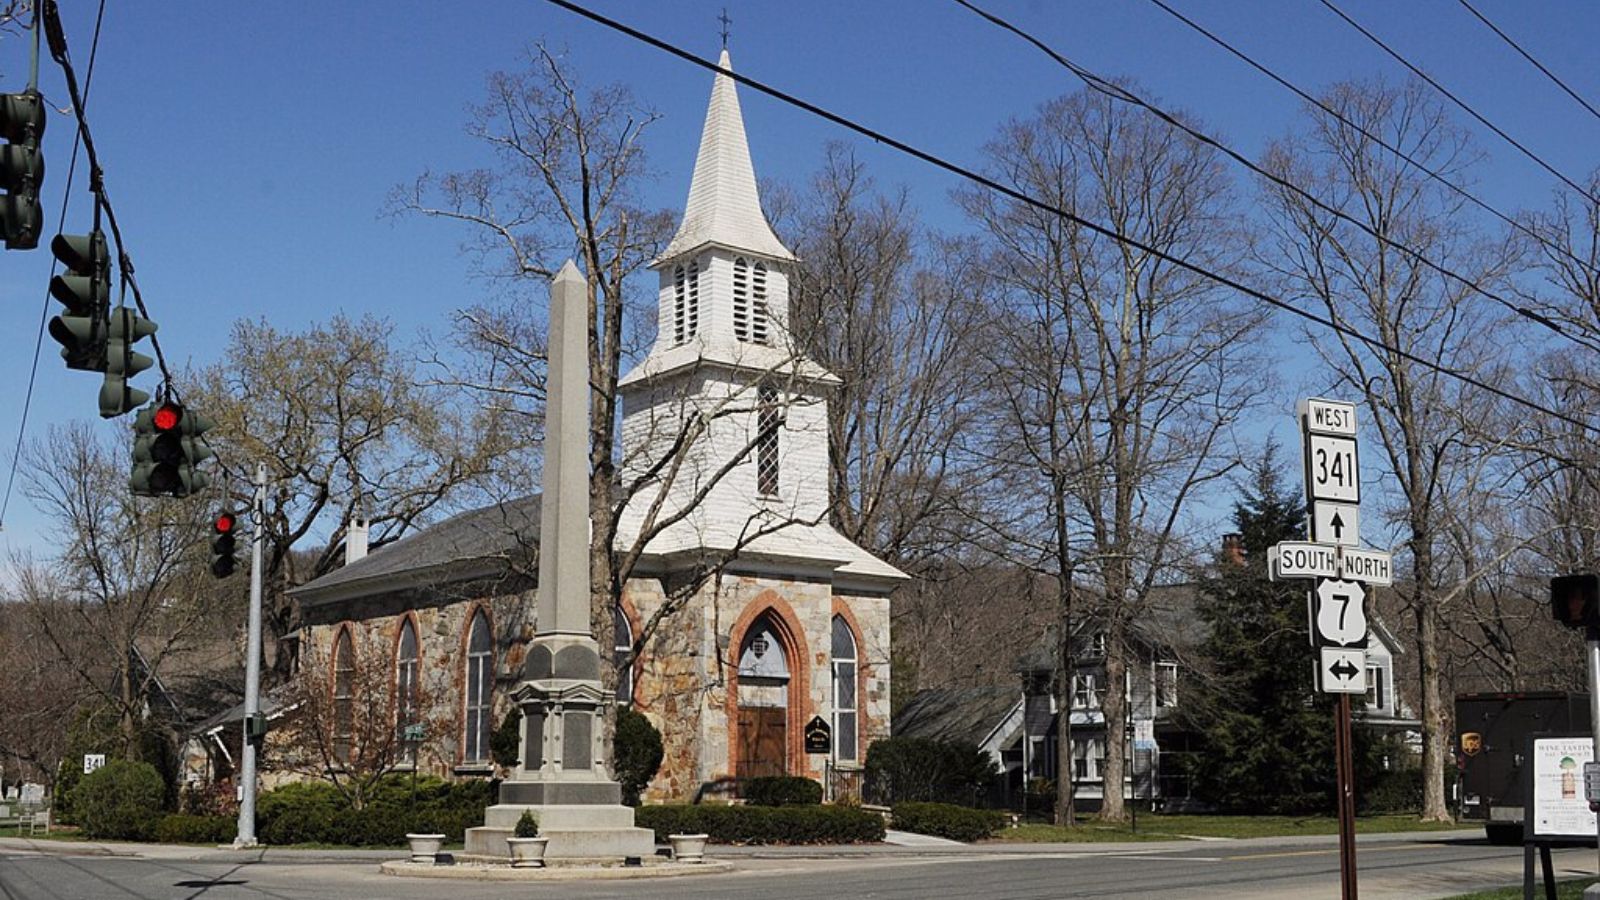
12. Goshen – Crash Risk Percentage: 52.25%
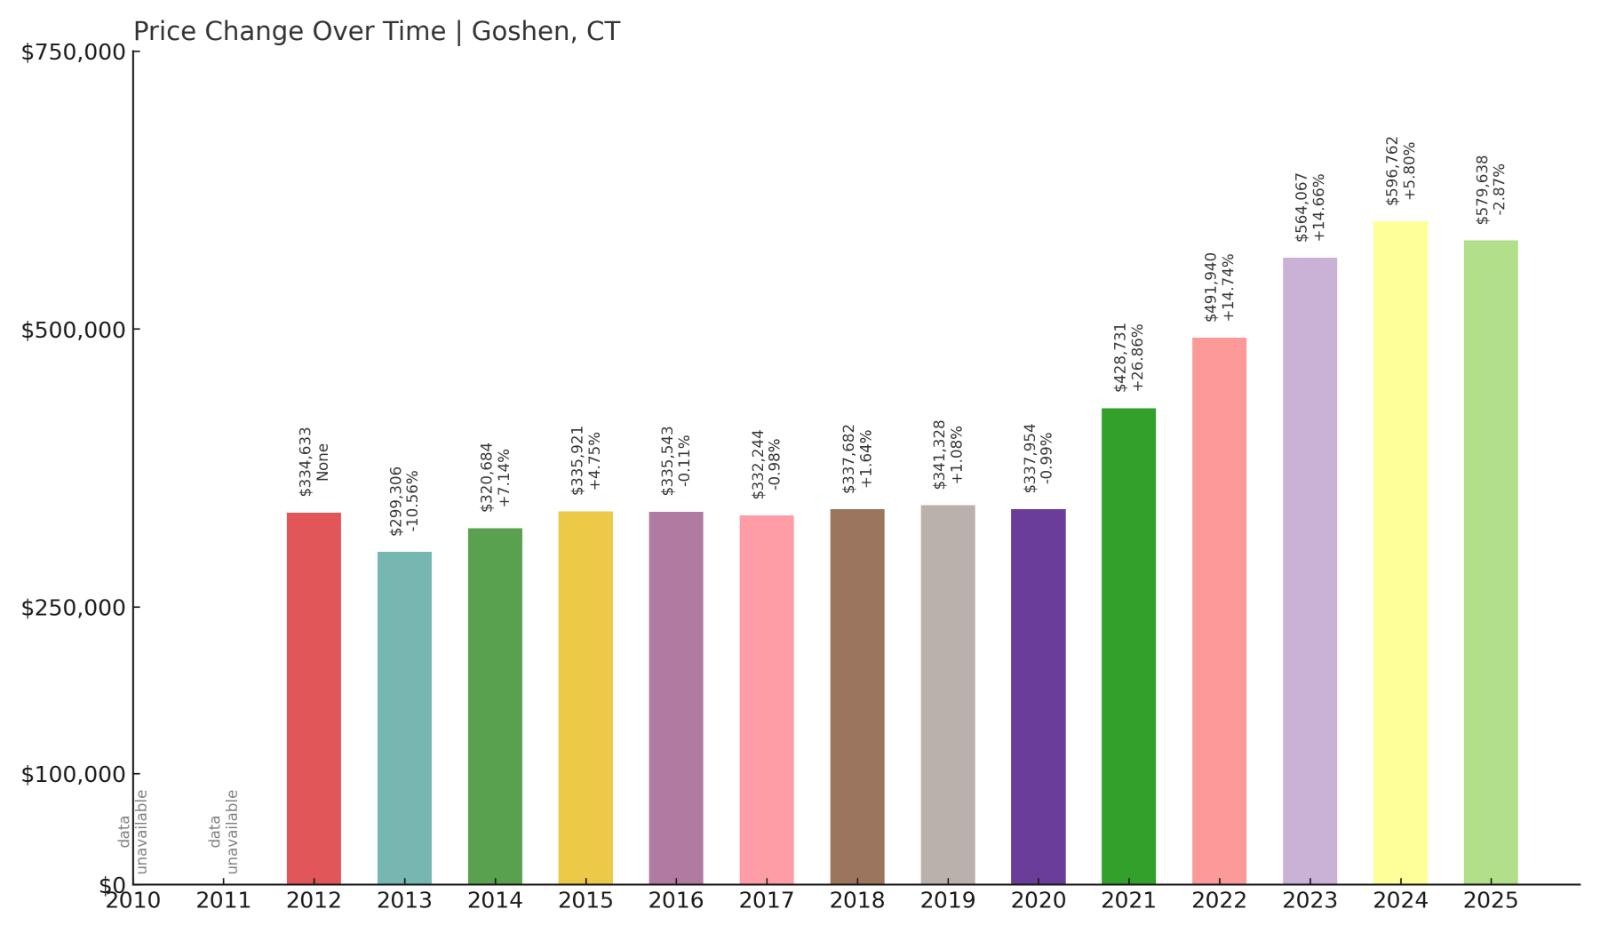
- Crash Risk Percentage: 52.25%
- Historical crashes (8%+ drops): 1
- Worst historical crash: -9.4% (2013)
- Total price increase since 2012: 73.2%
- Overextended above long-term average: 45.9%
- Price volatility (annual swings): 8.5%
- Current 2025 price: $579,638
Goshen’s rural Litchfield County market shows classic warning signs of instability with a previous 9.4% crash in 2013 and current overextension of 45.9% above sustainable levels. The 73.2% price appreciation since 2012 has driven median values to $579,638, but high price volatility at 8.5% indicates this market experiences significant swings that create risk for homeowners. This northwestern Connecticut community’s dependence on discretionary buyers creates vulnerability during economic downturns.
Goshen – Rural Litchfield County Risks
Situated in Connecticut’s scenic northwest corner, Goshen offers rural tranquility and outdoor recreation that appeals to buyers seeking alternatives to urban living. The town’s agricultural character and proximity to recreational areas have attracted both permanent residents and second-home owners, driving the 73.2% price appreciation since 2012. However, this rural market’s dependence on discretionary spending by higher-income buyers creates inherent volatility, as demonstrated by the 9.4% crash in 2013 during a period of broader economic uncertainty.
Current conditions present greater risk than existed before the previous correction, with the market now 45.9% overextended compared to lower ratios during the 2013 crash. Rural communities like Goshen often experience more severe housing cycles because they have limited economic diversity and smaller buyer pools that can shift quickly during uncertain times. The combination of high price volatility at 8.5% and significant overvaluation suggests this market is particularly vulnerable to external economic shocks that could trigger substantial price corrections to restore affordability.
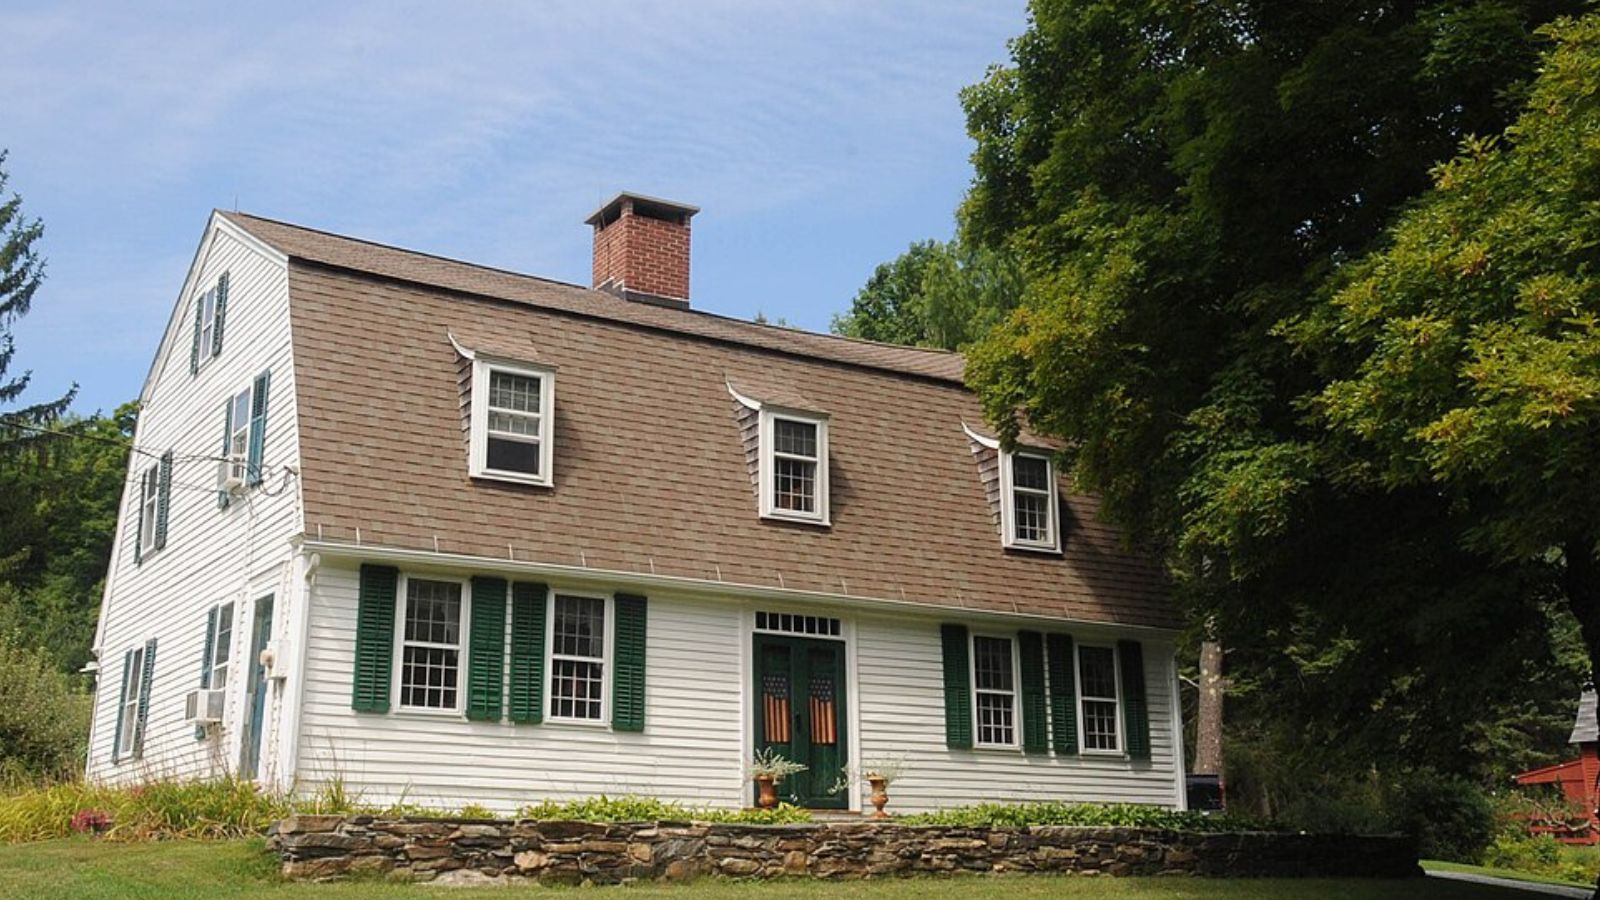
11. Norwich – Crash Risk Percentage: 52.75%
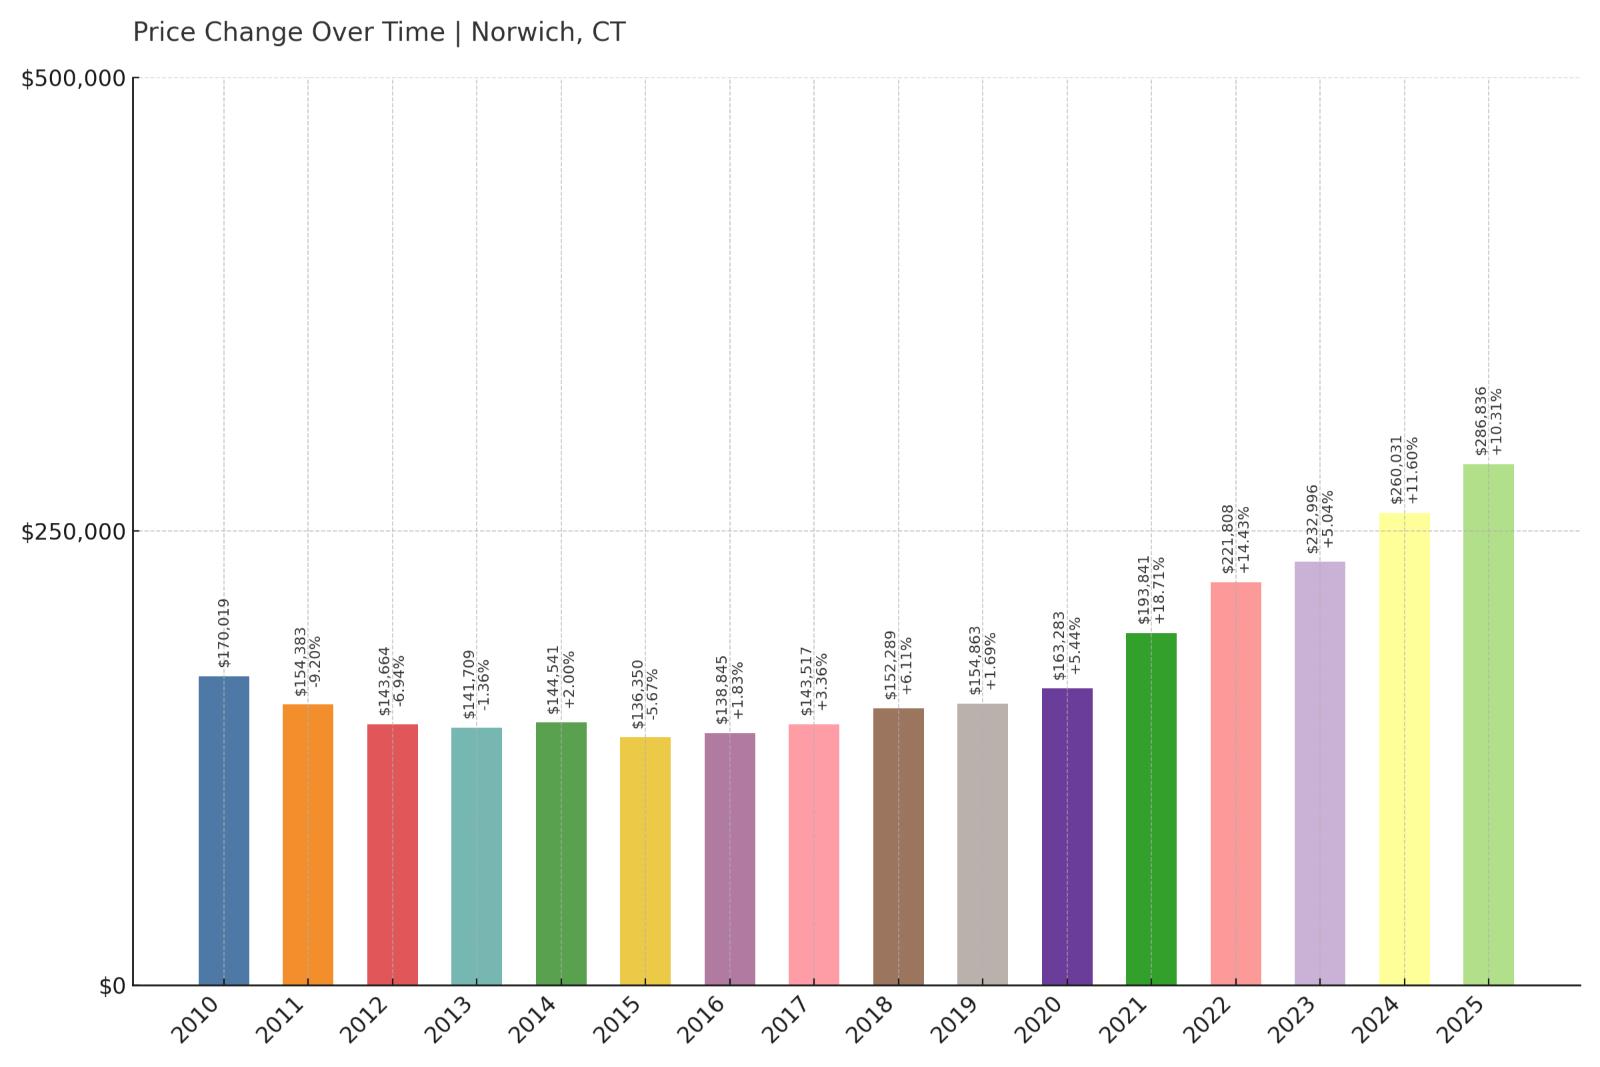
- Crash Risk Percentage: 52.75%
- Historical crashes (8%+ drops): 1
- Worst historical crash: -9.2% (2011)
- Total price increase since 2010: 68.7%
- Overextended above long-term average: 61.7%
- Price volatility (annual swings): 7.6%
- Current 2025 price: $286,836
Norwich demonstrates concerning market dynamics with a previous 9.2% crash in 2011 and extreme current overextension of 61.7% above sustainable levels. This eastern Connecticut city has experienced 68.7% price growth since 2010, pushing median values to $286,836 despite limited economic diversification beyond traditional manufacturing and gaming. The combination of crash history and current overvaluation creates significant risk for a community that lacks the economic strength to support elevated housing costs.
Norwich – Industrial City Speculation
Located in southeastern Connecticut along the Thames River, Norwich has historically been an industrial center with employment tied to manufacturing, defense contractors, and the nearby Mohegan Sun casino. The city’s 68.7% price appreciation since 2010 has pushed housing costs 61.7% above levels that local economic conditions can sustainably support. This dramatic overextension suggests prices have been driven by speculation and external investment rather than fundamental economic improvements in the region.
The 2011 crash that produced a 9.2% decline occurred when Norwich was significantly less overvalued than current conditions, indicating today’s market faces much greater correction risk. Industrial cities often experience volatile housing cycles tied to manufacturing employment and broader economic conditions that affect working-class buyers. Current median prices of $286,836 may appear affordable compared to other Connecticut markets, but they represent dangerous overvaluation relative to local income levels and economic fundamentals that could trigger significant price reversion to restore market equilibrium.
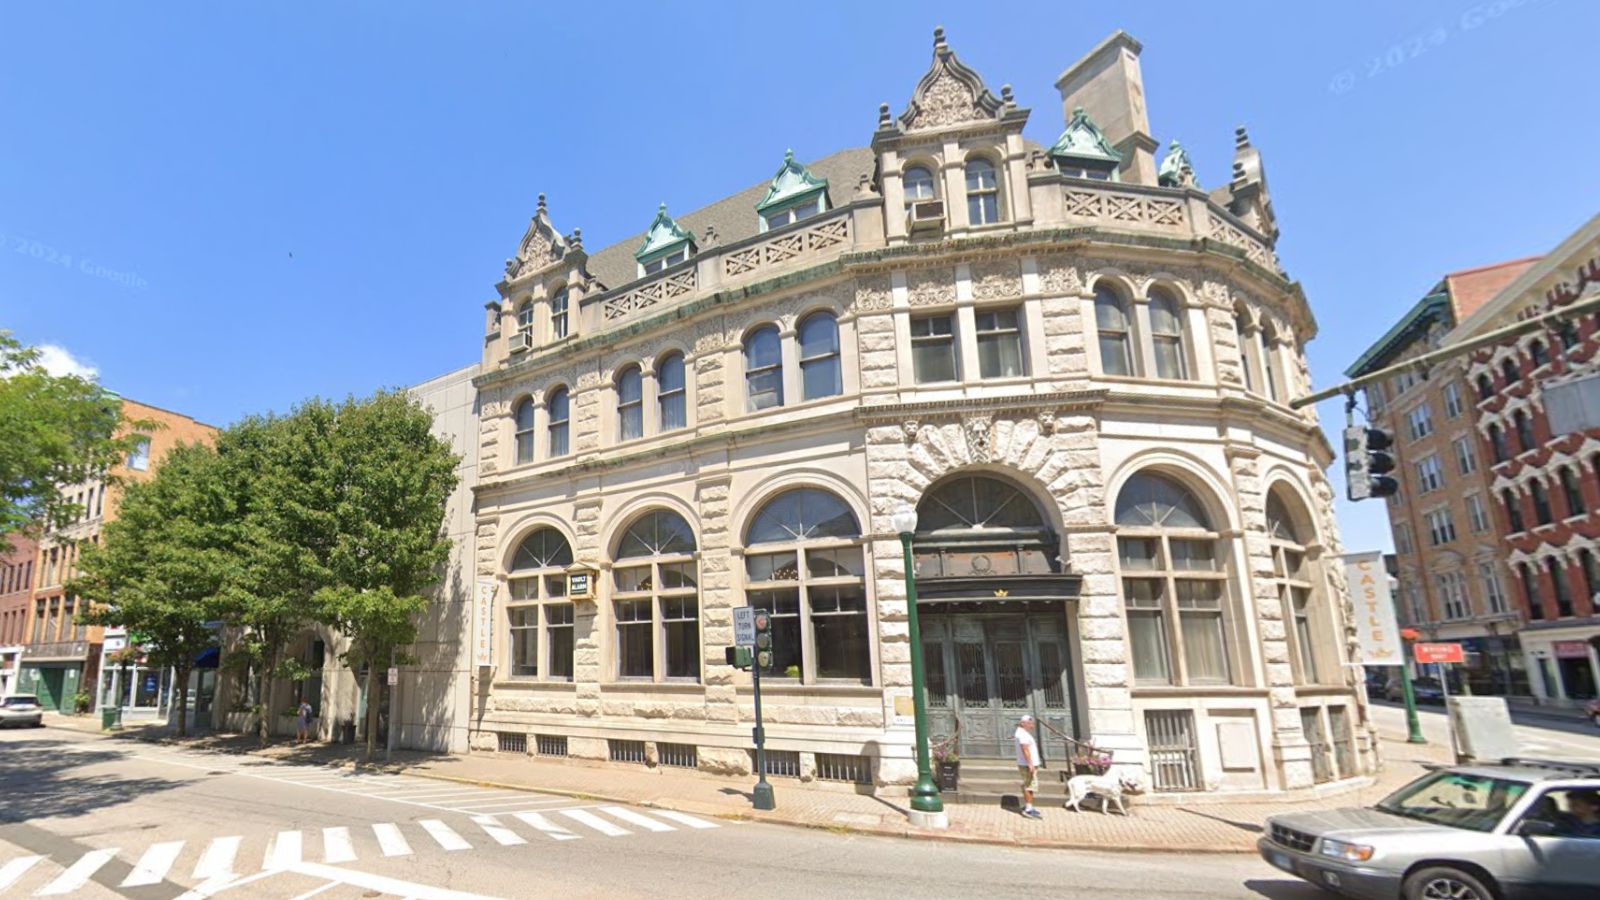
10. Washington – Crash Risk Percentage: 52.90%
- Crash Risk Percentage: 52.90%
- Historical crashes (8%+ drops): 1
- Worst historical crash: -9.2% (2012)
- Total price increase since 2010: 66.2%
- Overextended above long-term average: 51.4%
- Price volatility (annual swings): 7.9%
- Current 2025 price: $1,019,938
Washington’s prestigious Litchfield County location has driven significant appreciation, but the 9.2% crash in 2012 reveals this luxury rural market’s vulnerability to corrections. The 66.2% price growth since 2010 has pushed median values above $1 million while extending the market 51.4% above sustainable levels. Higher price volatility at 7.9% indicates this affluent community experiences more dramatic market swings than many Connecticut towns, creating risk for homeowners in this scenic but economically dependent area.
Washington – Luxury Rural Vulnerability

Situated in the heart of Connecticut’s Litchfield Hills, Washington attracts wealthy buyers seeking country estates and weekend retreats in one of the state’s most scenic areas. The town’s historic character, preserved farmland, and proximity to cultural attractions have created strong demand that has driven median prices above $1 million. However, this luxury rural market depends heavily on discretionary spending by high-income buyers who often maintain multiple residences and can delay purchases during economic uncertainty.
The 2012 crash that produced a 9.2% decline occurred when Washington was less overextended than current conditions, suggesting today’s market faces greater correction risk. Luxury rural markets often experience sharp corrections because they serve buyers with considerable discretionary income who can easily postpone real estate transactions during uncertain times. The current 51.4% overextension combined with high price volatility creates conditions for potentially significant price reversion if economic conditions deteriorate or buyer sentiment shifts toward more conservative spending patterns.
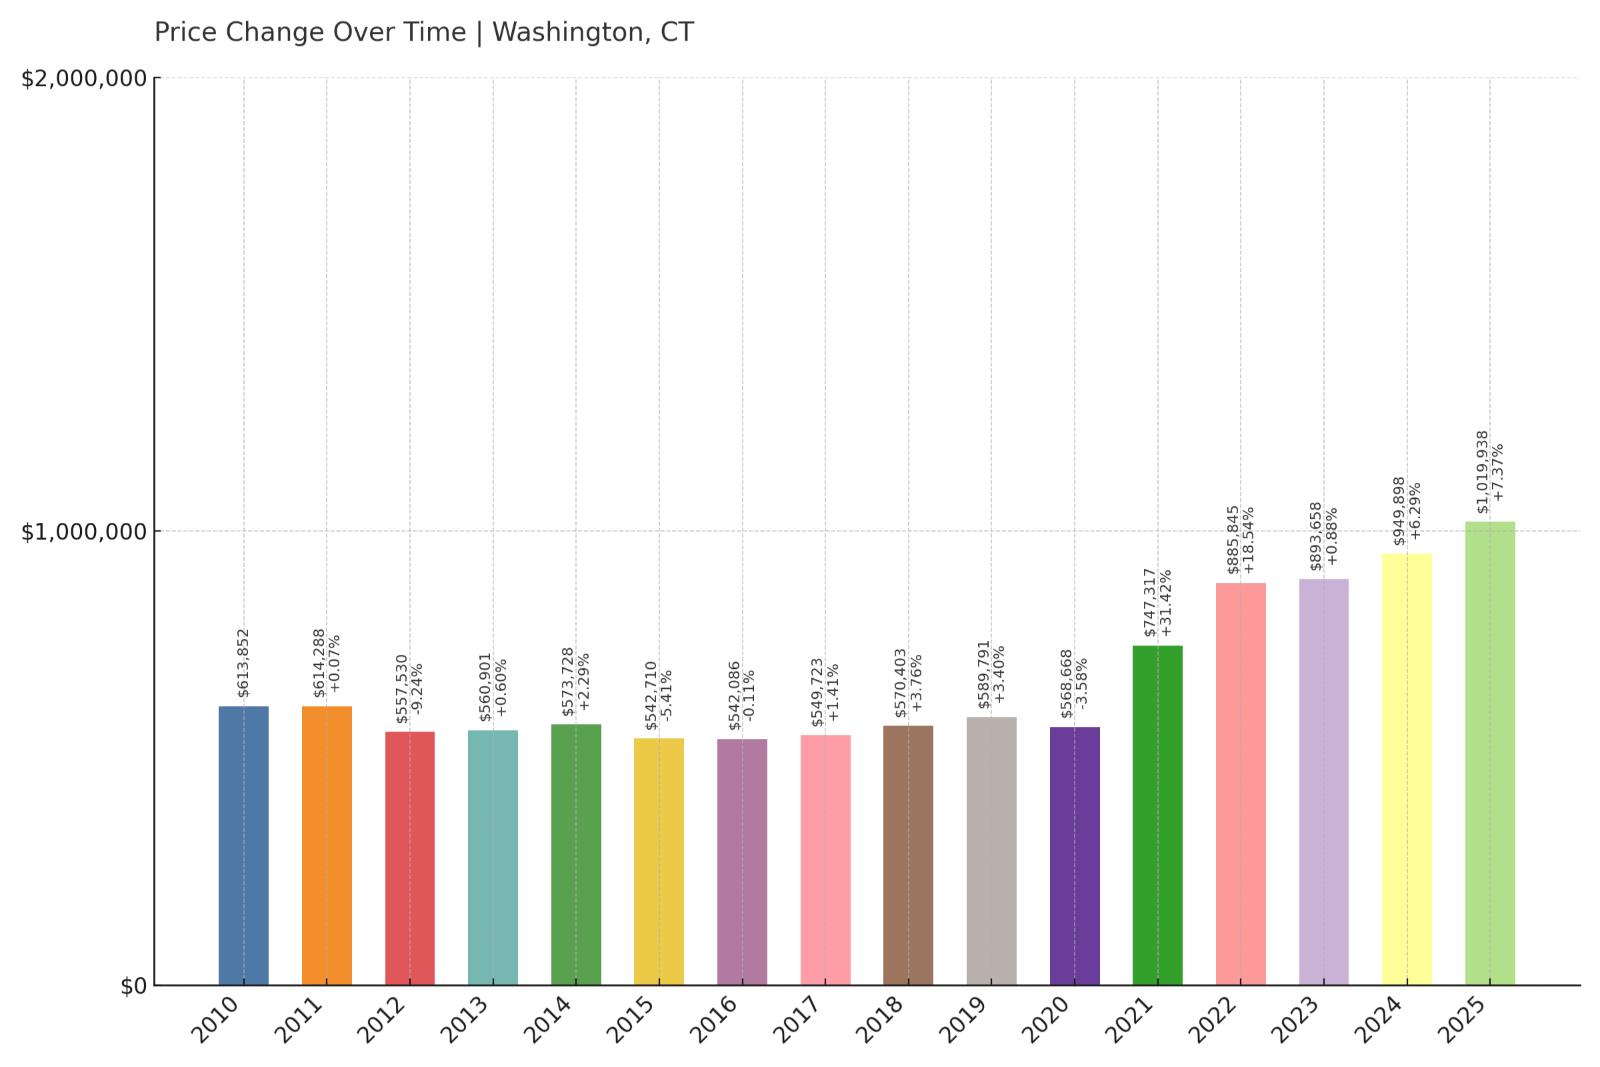
9. Haddam – Crash Risk Percentage: 52.95%
🔥 Would you like to save this?
- Crash Risk Percentage: 52.95%
- Historical crashes (8%+ drops): 2
- Worst historical crash: -14.6% (2011)
- Total price increase since 2010: 28.7%
- Overextended above long-term average: 39.3%
- Price volatility (annual swings): 7.4%
- Current 2025 price: $441,609
Haddam ranks among Connecticut’s highest crash risks due to its history of multiple market corrections, including a severe 14.6% decline in 2011 that represents one of the state’s worst single-year crashes. Despite more modest 28.7% appreciation since 2010, the market remains 39.3% overextended above sustainable levels. This rural Connecticut River town’s pattern of repeated crashes demonstrates fundamental market instability that creates ongoing risk for current homeowners at median prices of $441,609.
Haddam – Repeat Crash Offender

Located along the Connecticut River in Middlesex County, Haddam combines rural character with proximity to state employment centers, but this positioning has not prevented severe market volatility. The town’s devastating 14.6% crash in 2011 represents one of Connecticut’s most dramatic single-year housing corrections, demonstrating this market’s extreme sensitivity to economic conditions. Having experienced two separate crashes exceeding 8%, Haddam has established a clear pattern of boom-bust cycles that suggests current market conditions may be unsustainable.
While current price appreciation of 28.7% since 2010 appears modest compared to other Connecticut markets, the 39.3% overextension above long-term averages combined with the town’s crash history creates significant risk. Markets that have crashed multiple times often develop structural vulnerabilities that make them prone to future corrections. Haddam’s rural economy and limited economic diversity provide insufficient foundation to support elevated housing costs during economic downturns, making it one of Connecticut’s most dangerous markets for potential value destruction despite seemingly reasonable current price levels.
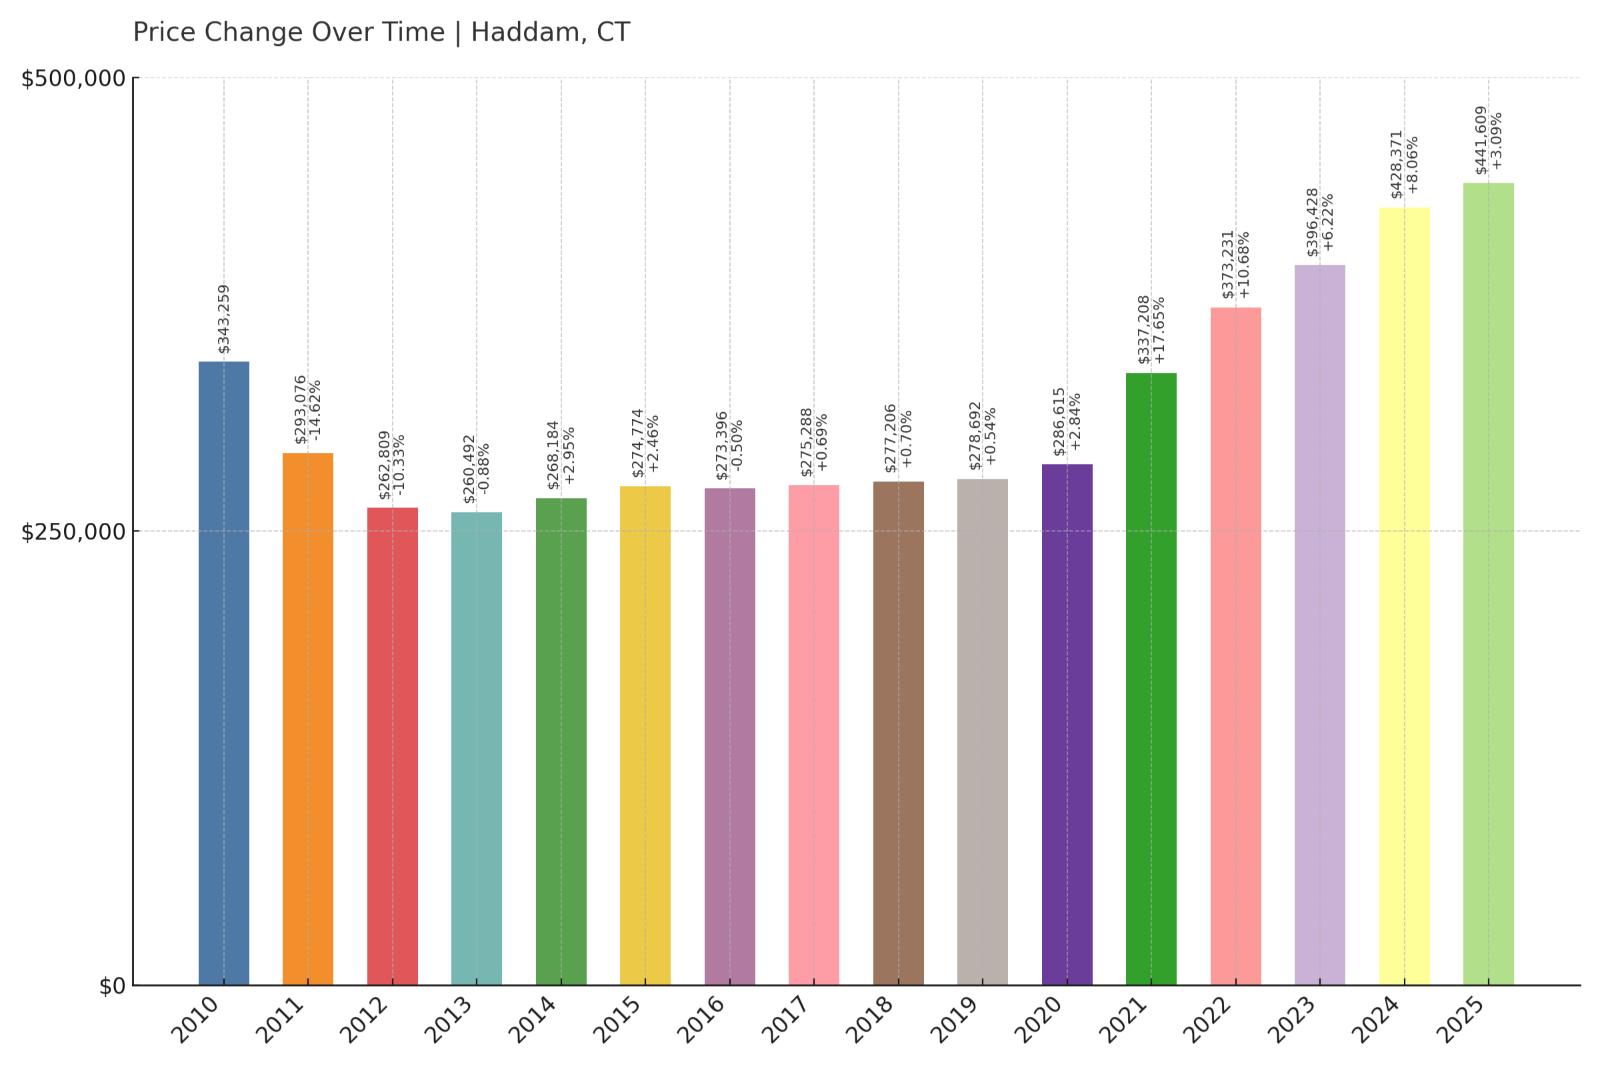
8. Bridgeport – Crash Risk Percentage: 54.65%
- Crash Risk Percentage: 54.65%
- Historical crashes (8%+ drops): 1
- Worst historical crash: -12.8% (2011)
- Total price increase since 2010: 112.6%
- Overextended above long-term average: 72.7%
- Price volatility (annual swings): 8.4%
- Current 2025 price: $349,044
Bridgeport presents one of Connecticut’s most dangerous housing scenarios with explosive 112.6% price growth since 2010 pushing the market 72.7% above sustainable levels. Connecticut’s largest city experienced a severe 12.8% crash in 2011, demonstrating significant vulnerability to economic downturns. Despite current median prices of $349,044 appearing affordable by state standards, the extreme overextension suggests values have moved far beyond what local economic conditions can support in this urban center.
Bridgeport – Urban Market Overheating
As Connecticut’s most populous city, Bridgeport has undergone significant transformation with downtown revitalization efforts and proximity to major employment centers driving investor interest and price appreciation. The city’s strategic location between New York and Hartford, combined with ongoing development projects, has attracted buyers seeking urban amenities at relatively affordable prices. However, the staggering 112.6% price surge since 2010 has created unsustainable market conditions that far exceed the pace of local economic development and income growth.
The devastating 12.8% crash in 2011 occurred when Bridgeport was significantly less overvalued than current conditions, indicating today’s market faces catastrophic correction risk. Urban markets often experience severe boom-bust cycles when speculative investment drives prices beyond what local employment and income levels can support. The current 72.7% overextension represents one of Connecticut’s highest risk ratios, suggesting significant price reversion may be inevitable to restore affordability for local residents and establish sustainable market conditions.
7. Salisbury – Crash Risk Percentage: 55.00%
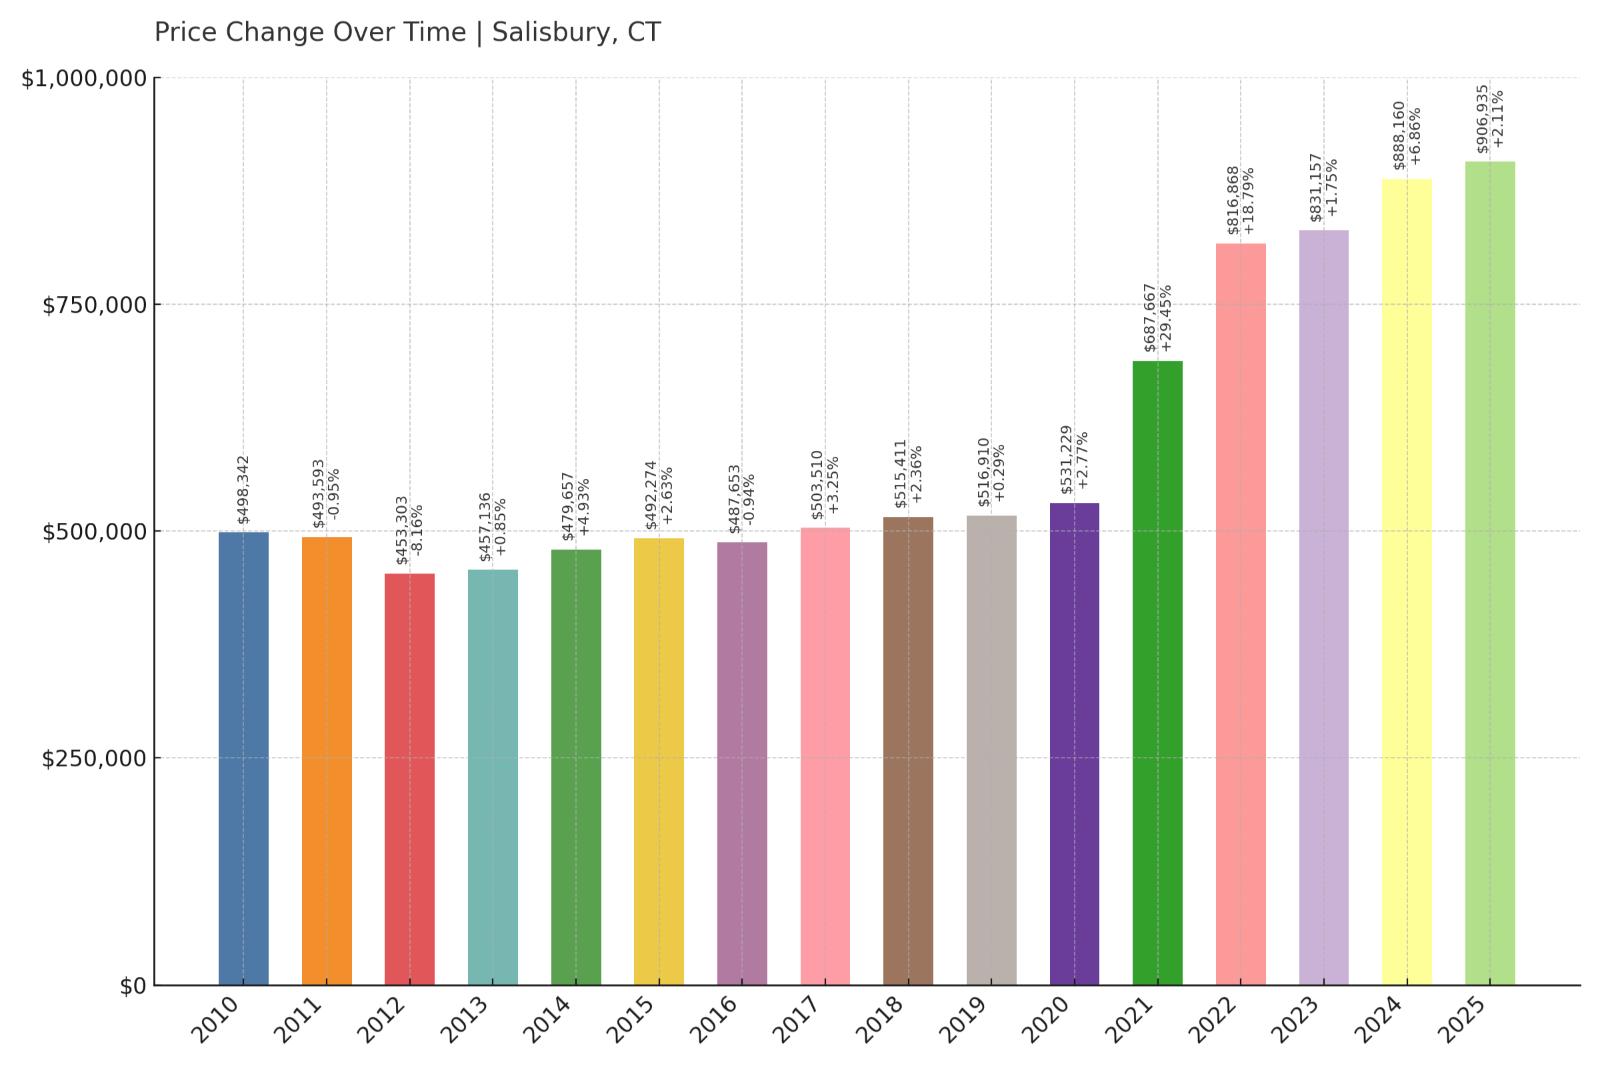
- Crash Risk Percentage: 55.00%
- Historical crashes (8%+ drops): 1
- Worst historical crash: -8.2% (2012)
- Total price increase since 2010: 82.0%
- Overextended above long-term average: 51.8%
- Price volatility (annual swings): 8.6%
- Current 2025 price: $906,935
Salisbury’s northwestern Connecticut location has driven substantial appreciation with 82.0% price growth since 2010 pushing this luxury rural market 51.8% above sustainable levels. The town experienced an 8.2% crash in 2012, demonstrating vulnerability despite its prestigious reputation and high median prices of $906,935. High price volatility at 8.6% indicates this scenic Litchfield County community experiences significant market swings that create risk for homeowners in this recreation-dependent economy.
Salisbury – Luxury Recreation Market Risks
Located near the New York and Massachusetts borders in Connecticut’s scenic northwest corner, Salisbury attracts wealthy buyers seeking country estates and recreational properties near prestigious prep schools and cultural institutions. The town’s proximity to Lime Rock Park racing circuit and numerous outdoor recreation opportunities has created strong demand from both permanent and seasonal residents. However, this luxury recreational market’s dependence on discretionary spending by high-income buyers creates inherent volatility during economic uncertainty.
The 2012 crash that produced an 8.2% decline occurred when Salisbury was less overextended than current conditions, suggesting today’s market faces greater correction risk. Luxury recreational markets often experience sharp corrections because they serve buyers with considerable discretionary income who can easily postpone real estate transactions during uncertain times. The current 51.8% overextension combined with high price volatility creates conditions for potentially significant price reversion if economic conditions deteriorate or buyer preferences shift toward more conservative spending patterns in this high-end but vulnerable market.
6. Torrington – Crash Risk Percentage: 55.95%
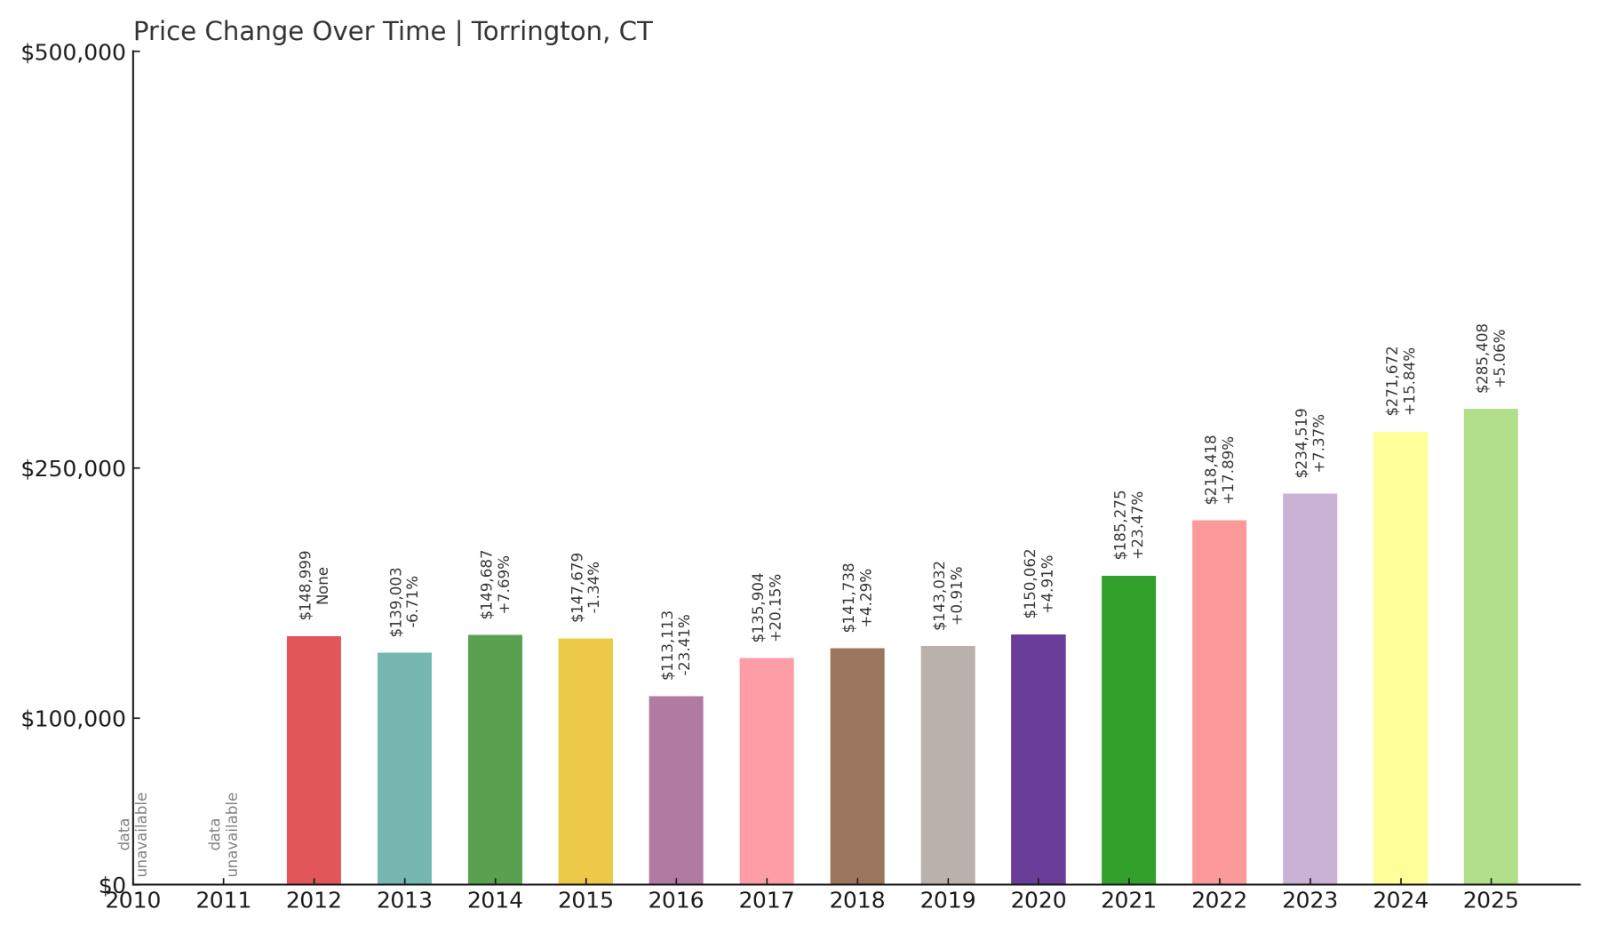
- Crash Risk Percentage: 55.95%
- Historical crashes (8%+ drops): 1
- Worst historical crash: -8.5% (2016)
- Total price increase since 2012: 91.7%
- Overextended above long-term average: 60.7%
- Price volatility (annual swings): 8.8%
- Current 2025 price: $285,408
Torrington shows concerning market dynamics with dramatic 91.7% price growth since 2012 pushing this northwestern Connecticut city 60.7% above sustainable levels. The town experienced an 8.5% crash as recently as 2016, demonstrating ongoing vulnerability to market corrections. Despite relatively affordable median prices at $285,408, the extreme overextension and high price volatility at 8.8% create significant risk in this former manufacturing center that lacks economic diversity to support elevated housing costs.
Torrington – Post-Industrial Speculation
As the largest city in Litchfield County, Torrington has worked to reinvent itself from its industrial past while maintaining affordability compared to other Connecticut markets. The city’s historic downtown, cultural institutions, and proximity to recreational areas have attracted new residents seeking value, driving the remarkable 91.7% price surge since 2012. However, this level of appreciation far exceeds local economic development and employment growth, suggesting prices have been driven by speculation rather than fundamental improvements in the regional economy.
The 2016 crash that produced an 8.5% decline demonstrates this market’s ongoing vulnerability even during relatively stable economic conditions, indicating structural weaknesses that could trigger more severe corrections under stress. Post-industrial cities like Torrington often experience volatile housing cycles because they lack economic diversity and depend on external investment that can shift quickly. The current 60.7% overextension represents dangerous market conditions that will likely require significant price reversion to restore equilibrium between housing costs and local economic capacity in this vulnerable former manufacturing center.
5. Newtown – Crash Risk Percentage: 56.65%
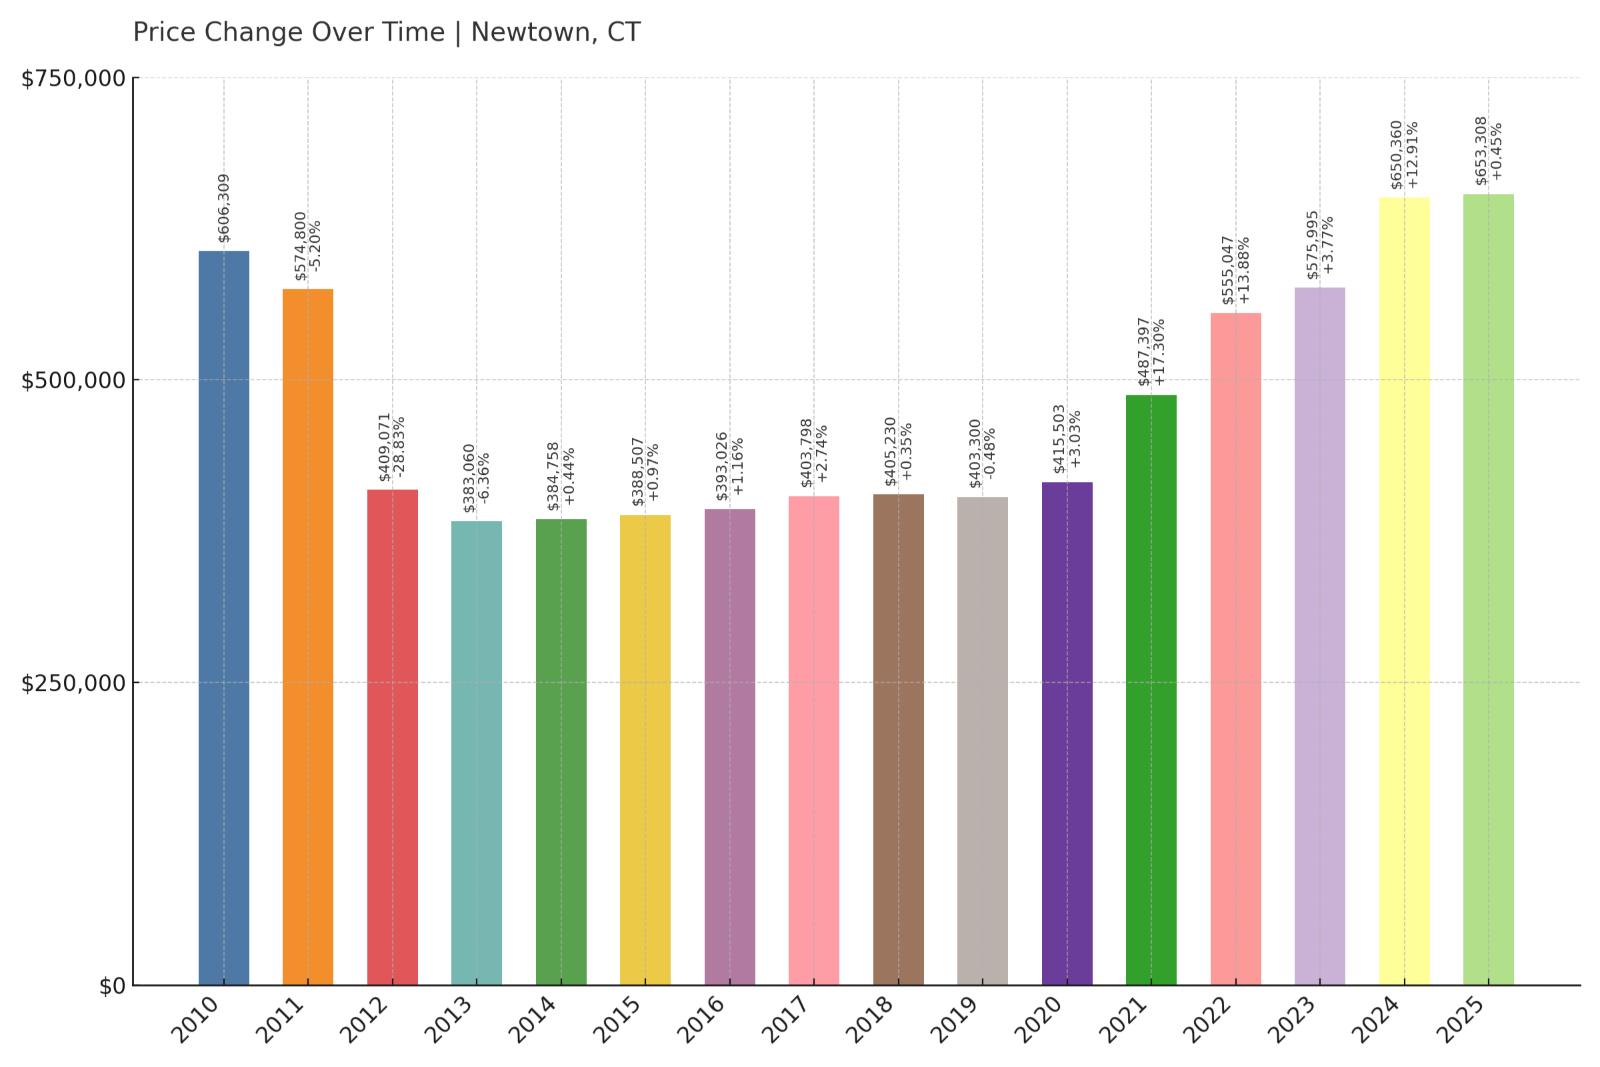
- Crash Risk Percentage: 56.65%
- Historical crashes (8%+ drops): 1
- Worst historical crash: -28.8% (2012)
- Total price increase since 2010: 7.8%
- Overextended above long-term average: 35.9%
- Price volatility (annual swings): 14.1%
- Current 2025 price: $653,308
Newtown stands out with Connecticut’s most severe historical crash at -28.8% in 2012, demonstrating this market’s capacity for devastating corrections. Despite modest 7.8% appreciation since 2010, the market remains 35.9% overextended above sustainable levels. Extreme price volatility at 14.1% indicates this Fairfield County town experiences the most dramatic market swings in Connecticut, creating ongoing risk for homeowners despite current median prices of $653,308 that appear relatively stable.
Newtown – Extreme Volatility Warning

🔥 Would you like to save this?
Located in northern Fairfield County, Newtown combines suburban character with proximity to major employment centers, but this positioning has not prevented extreme market volatility. The catastrophic 28.8% crash in 2012 represents Connecticut’s most severe single-year housing correction, demonstrating this market’s extreme sensitivity to economic and social factors. The town’s recovery has been modest with only 7.8% appreciation since 2010, but extreme price volatility at 14.1% indicates ongoing structural instability that creates significant risk for current homeowners.
Markets that experience severe crashes often develop long-term vulnerabilities that make them prone to future corrections, even when current conditions appear stable. Newtown’s pattern of extreme volatility combined with continued overextension above sustainable levels suggests this market remains fundamentally unstable despite its suburban appeal and decent school system. The combination of crash history and ongoing volatility makes this one of Connecticut’s most dangerous markets for potential catastrophic value destruction, warranting extreme caution from prospective buyers and current homeowners considering major financial decisions.
4. Columbia – Crash Risk Percentage: 61.45%
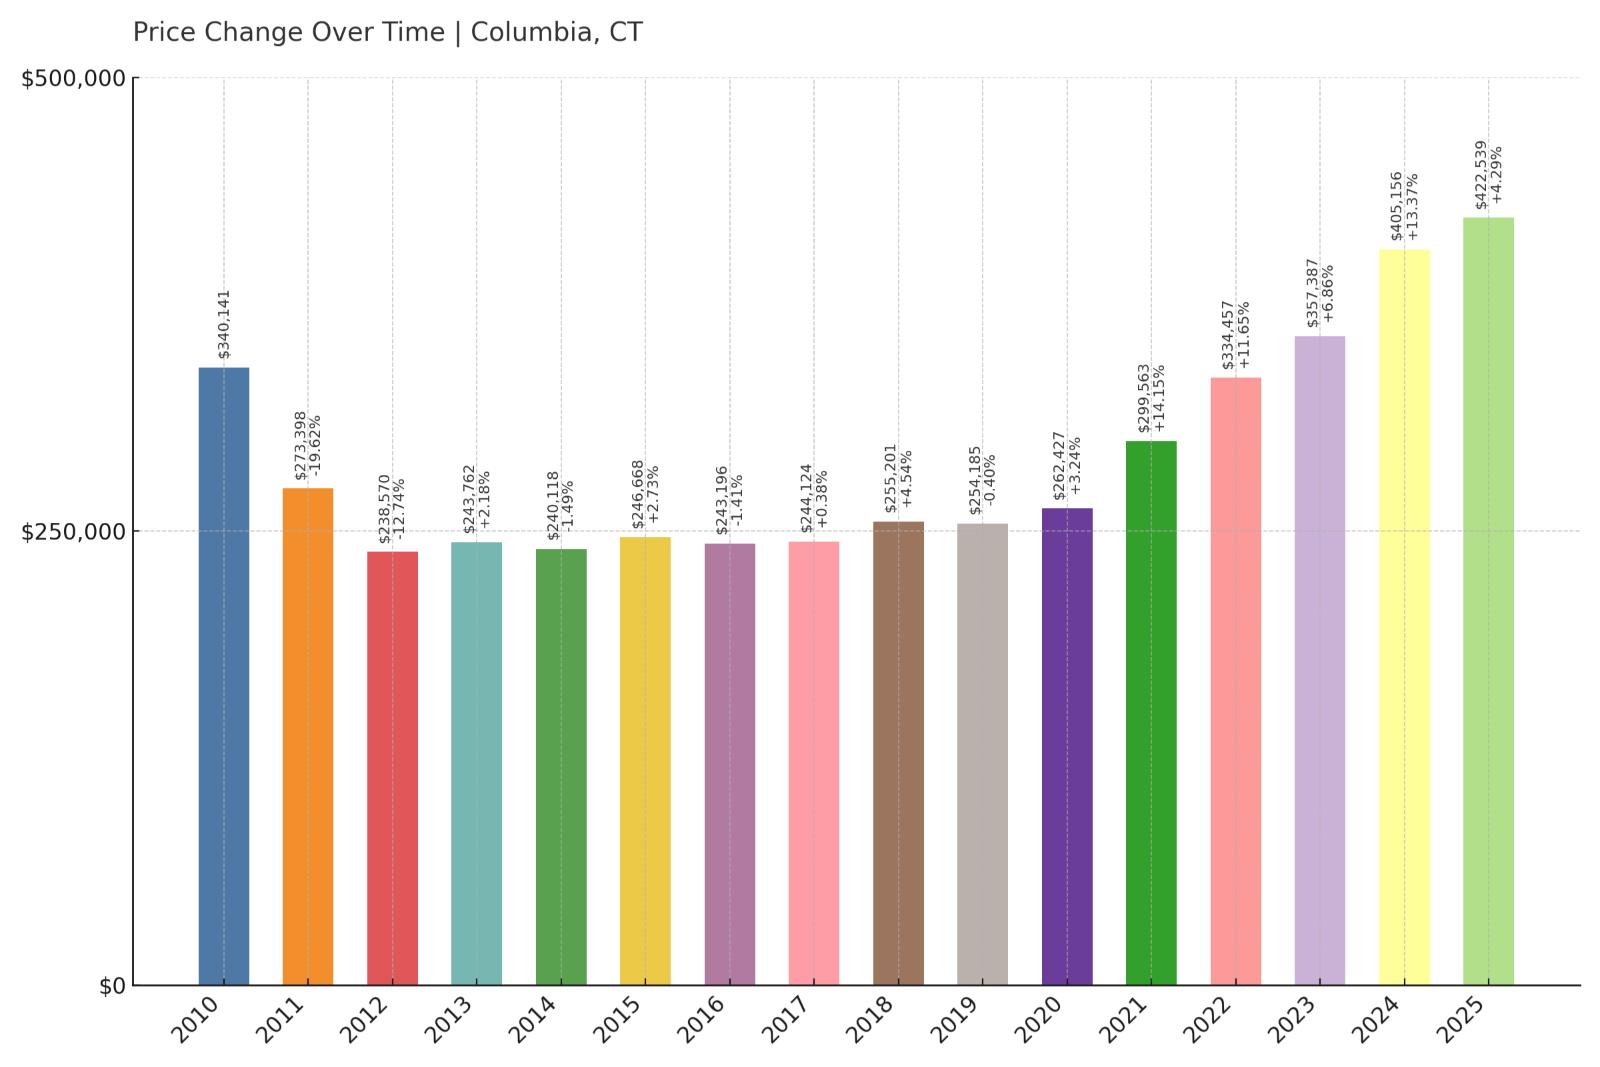
- Crash Risk Percentage: 61.45%
- Historical crashes (8%+ drops): 2
- Worst historical crash: -19.6% (2011)
- Total price increase since 2010: 24.2%
- Overextended above long-term average: 45.1%
- Price volatility (annual swings): 8.7%
- Current 2025 price: $422,539
Columbia ranks among Connecticut’s highest-risk markets with two separate crashes exceeding 8%, including a severe 19.6% decline in 2011 that represents one of the state’s most devastating corrections. Despite modest 24.2% appreciation since 2010, the market remains 45.1% overextended above sustainable levels. This eastern Connecticut town’s pattern of multiple crashes demonstrates fundamental market instability that creates ongoing risk for current homeowners at median prices of $422,539.
Columbia – Multiple Crash Pattern

Situated in eastern Connecticut’s Tolland County, Columbia has experienced repeated boom-bust cycles that establish it as one of the state’s most volatile housing markets. The devastating 19.6% crash in 2011 followed by additional corrections demonstrates this rural community’s extreme sensitivity to economic conditions and inability to maintain stable housing values. Despite appearing to offer suburban tranquility and reasonable prices, Columbia’s crash history reveals underlying market weaknesses that create ongoing risk for residents.
Markets that crash multiple times often develop structural vulnerabilities that make them prone to future severe corrections. Columbia’s pattern of repeated crashes combined with continued overextension above sustainable levels suggests fundamental economic conditions cannot support stable housing values in this community. The combination of multiple crash history, current overvaluation, and rural economic limitations makes this one of Connecticut’s most dangerous markets for potential catastrophic value destruction, warranting extreme caution from anyone considering real estate investment in this historically volatile area.
3. New Hartford – Crash Risk Percentage: 62.25%
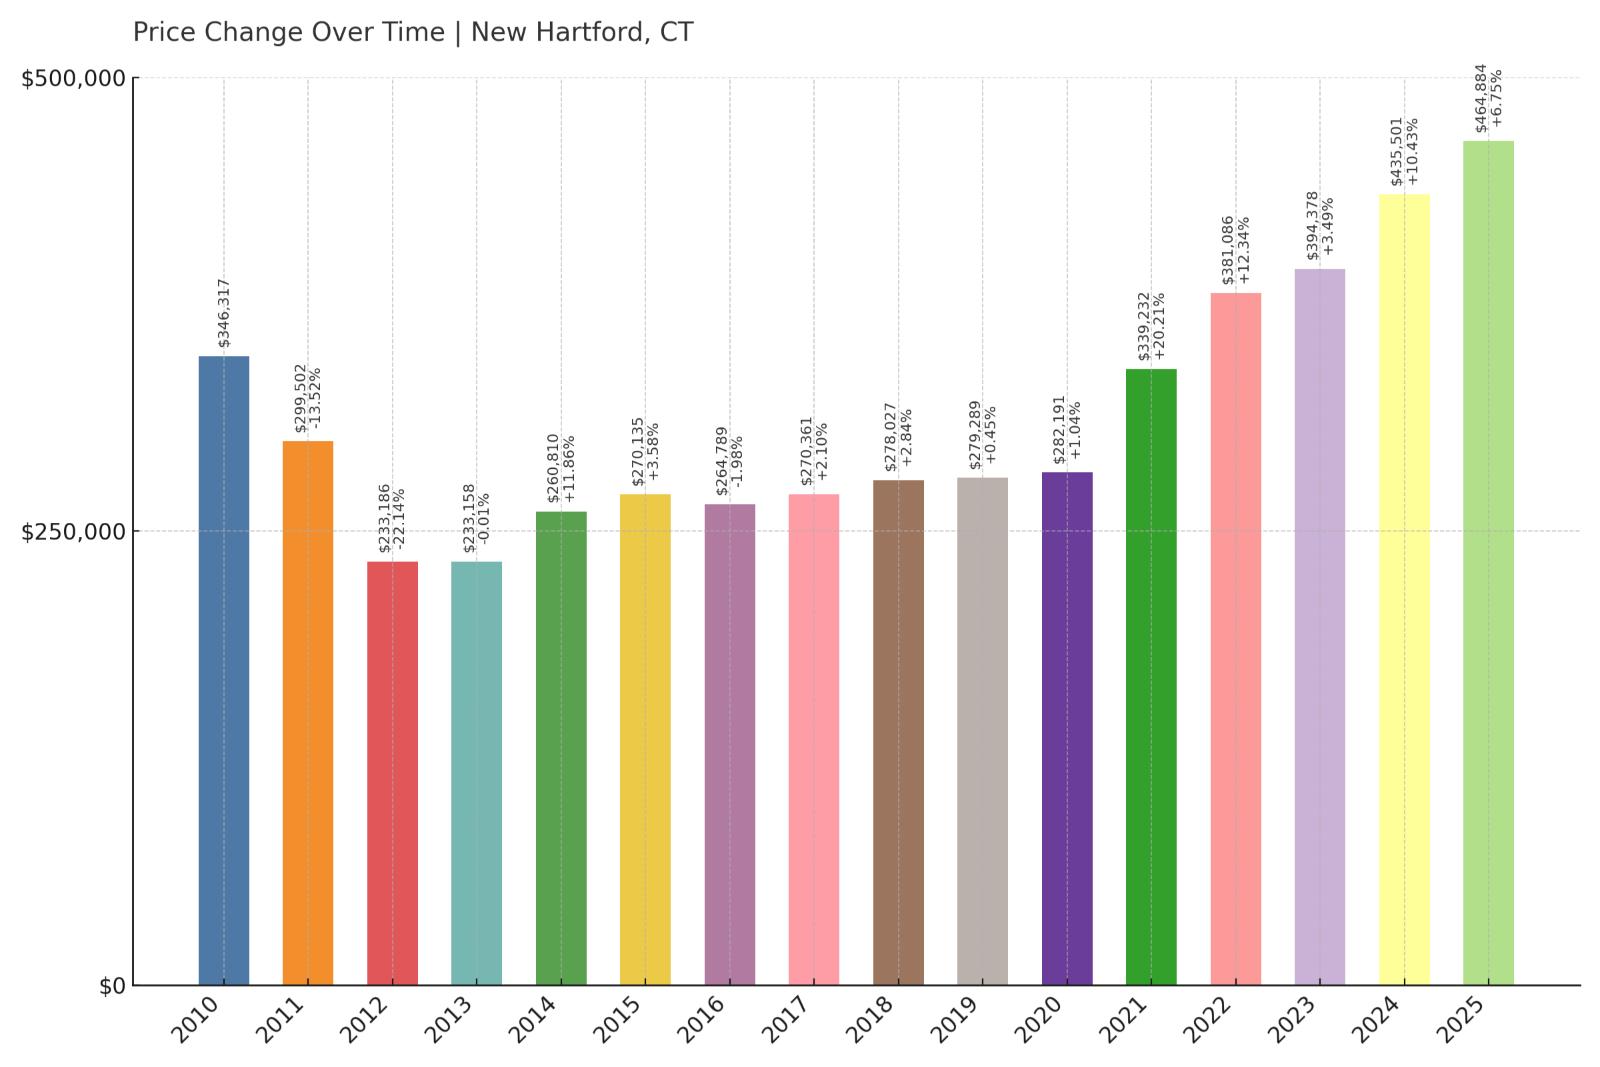
- Crash Risk Percentage: 62.25%
- Historical crashes (8%+ drops): 2
- Worst historical crash: -22.1% (2012)
- Total price increase since 2010: 34.2%
- Overextended above long-term average: 47.8%
- Price volatility (annual swings): 9.9%
- Current 2025 price: $464,884
New Hartford presents extreme crash risk with two separate corrections exceeding 8%, including a catastrophic 22.1% decline in 2012 that ranks among Connecticut’s most severe single-year crashes. Despite moderate 34.2% appreciation since 2010, the market remains 47.8% overextended above sustainable levels. High price volatility at 9.9% combined with this Litchfield County town’s history of multiple crashes creates significant ongoing risk for homeowners at current median prices of $464,884.
New Hartford – Severe Crash Vulnerability
Located in northwestern Connecticut’s scenic Litchfield County, New Hartford offers rural charm and outdoor recreation opportunities, but these attractions have not prevented severe market volatility. The devastating 22.1% crash in 2012 represents one of Connecticut’s most catastrophic housing corrections, demonstrating this market’s extreme vulnerability to economic downturns. Having experienced multiple crashes exceeding 8%, New Hartford has established a clear pattern of boom-bust cycles that suggests current market conditions may be fundamentally unsustainable.
Markets with severe crash histories often develop structural vulnerabilities that make them prone to future devastating corrections. New Hartford’s pattern of repeated crashes combined with continued overextension above sustainable levels indicates fundamental economic conditions cannot support stable housing values in this rural community. The combination of multiple crash history, current overvaluation, and high price volatility makes this one of Connecticut’s most dangerous markets for potential catastrophic value destruction, representing extreme risk for current homeowners and prospective buyers in this historically volatile mountain community.
2. Redding – Crash Risk Percentage: 63.25%
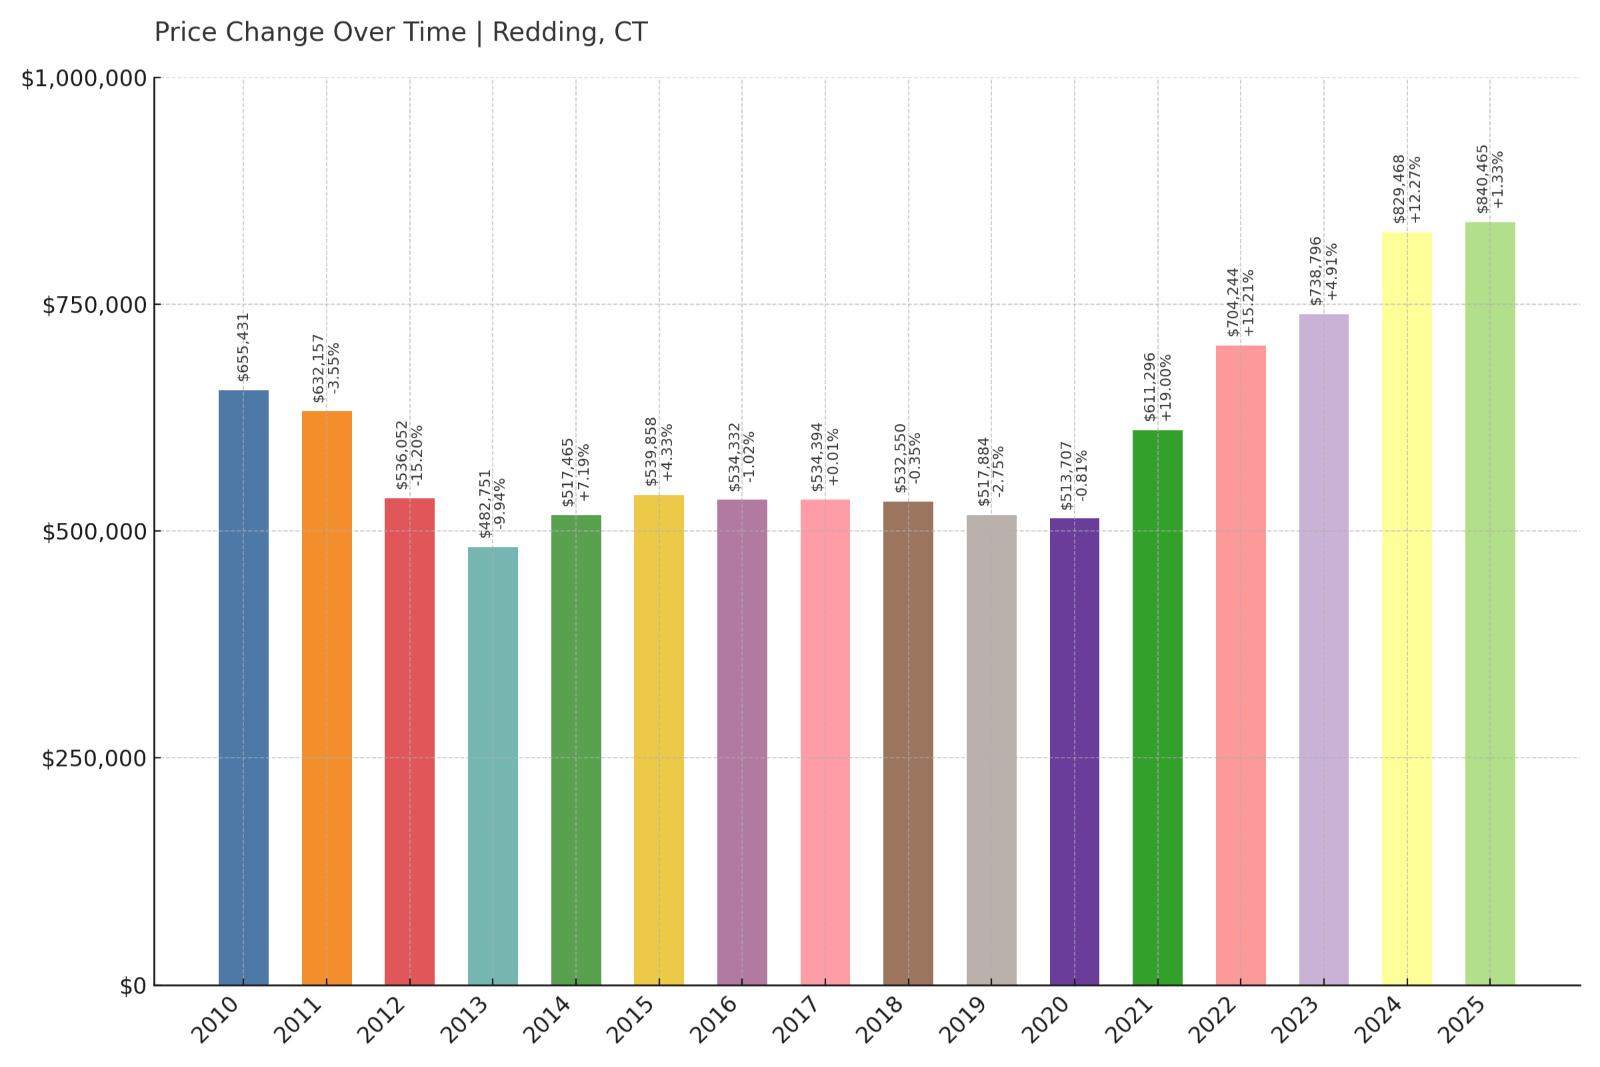
- Crash Risk Percentage: 63.25%
- Historical crashes (8%+ drops): 2
- Worst historical crash: -15.2% (2012)
- Total price increase since 2010: 28.2%
- Overextended above long-term average: 38.3%
- Price volatility (annual swings): 8.7%
- Current 2025 price: $840,465
Redding ranks as Connecticut’s second-highest crash risk with two separate corrections exceeding 8%, including a severe 15.2% decline in 2012. Despite modest 28.2% appreciation since 2010, this affluent Fairfield County town remains 38.3% overextended above sustainable levels at median prices of $840,465. The combination of multiple crash history and continued overvaluation in this luxury market creates significant risk for homeowners who may face substantial equity destruction during the next economic downturn.
Redding – Luxury Market Instability
Situated in lower Fairfield County with proximity to New York employment centers, Redding attracts affluent buyers seeking country estates and privacy while maintaining commuter access. The town’s large lots, excellent schools, and celebrity residents have created strong demand, but this luxury market’s history of multiple crashes reveals underlying vulnerabilities. The severe 15.2% decline in 2012 demonstrates that even expensive markets can experience devastating corrections when economic conditions deteriorate or buyer sentiment shifts.
Luxury markets often experience particularly sharp corrections because they serve discretionary buyers who can easily postpone purchases during uncertain times. Redding’s pattern of repeated crashes combined with continued overextension suggests fundamental market instabilities that could trigger future severe corrections. The current 38.3% overextension above sustainable levels, while seemingly modest, represents dangerous overvaluation in a market with proven vulnerability to catastrophic value destruction. This combination makes Redding one of Connecticut’s most dangerous luxury markets for potential devastating financial losses.
1. Waterbury – Crash Risk Percentage: 75.05%
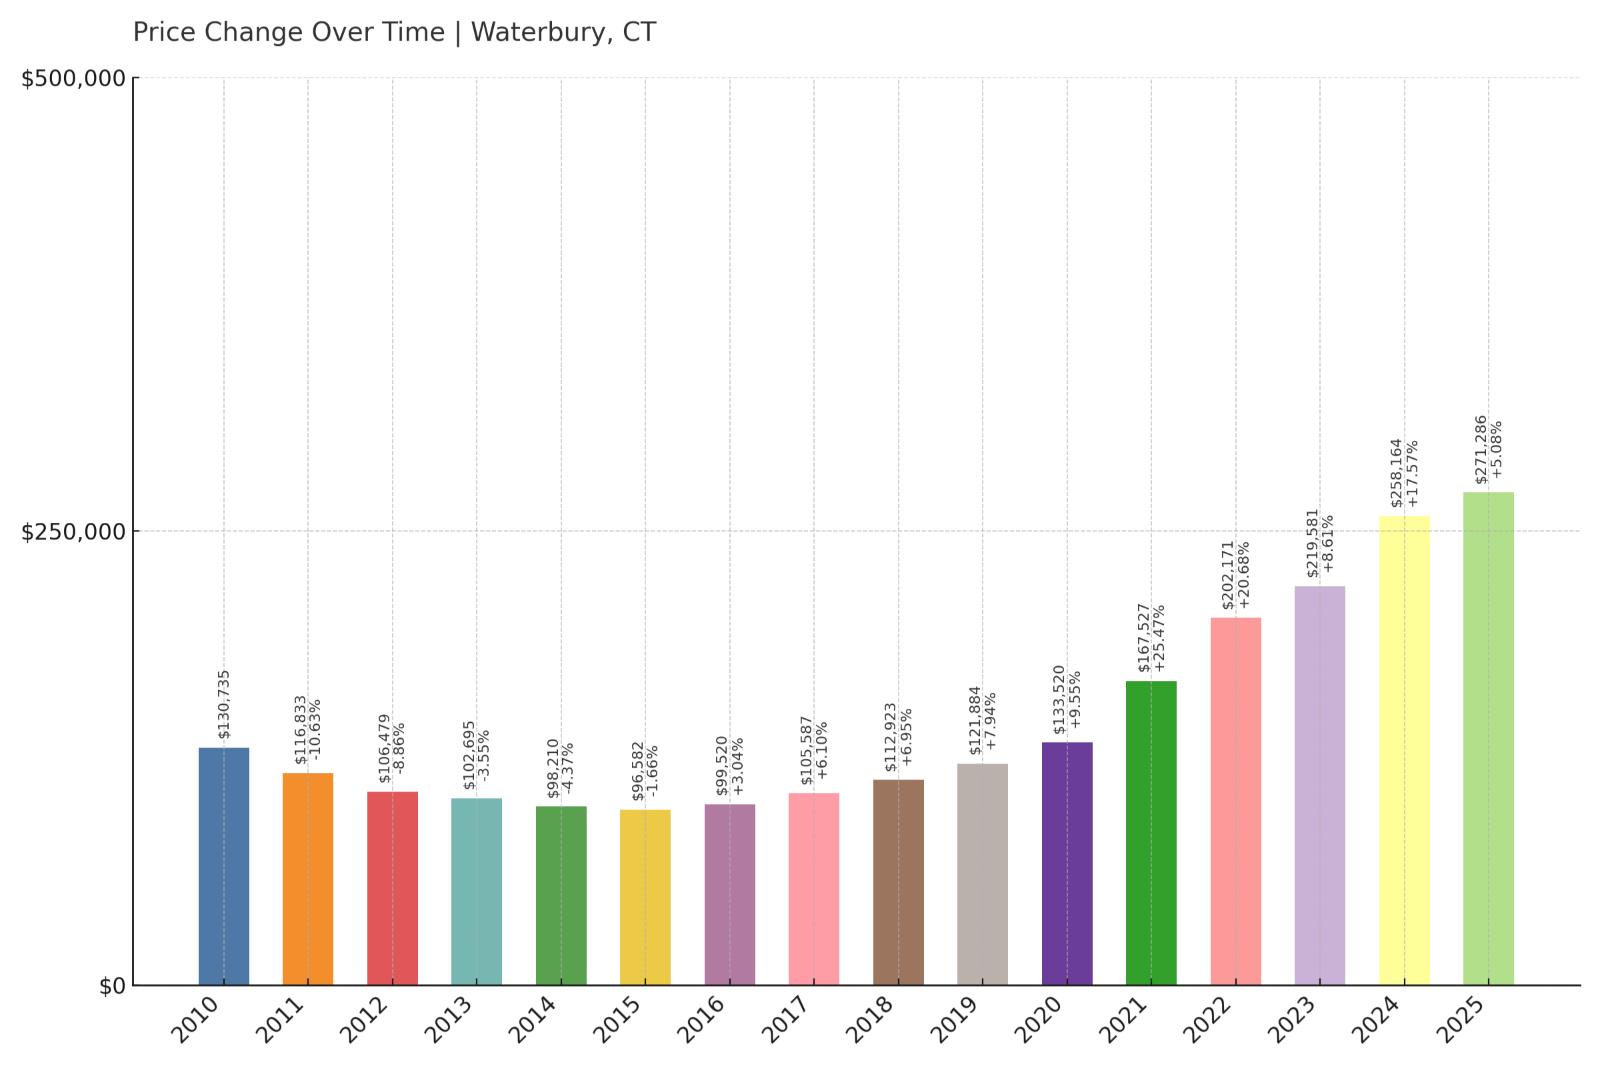
- Crash Risk Percentage: 75.05%
- Historical crashes (8%+ drops): 2
- Worst historical crash: -10.6% (2011)
- Total price increase since 2010: 107.5%
- Overextended above long-term average: 85.2%
- Price volatility (annual swings): 10.0%
- Current 2025 price: $271,286
Waterbury tops Connecticut’s crash risk rankings with a catastrophic 75.05% vulnerability score driven by extreme market conditions across all risk factors. This former industrial city has experienced explosive 107.5% price growth since 2010, pushing the market a staggering 85.2% above sustainable levels – the highest overextension in Connecticut. Despite seemingly affordable median prices at $271,286, this represents the most dangerous overvaluation scenario in the state, with two previous crashes exceeding 8% and high price volatility at 10.0%.
Waterbury – Connecticut’s Highest Crash Risk
Connecticut’s fourth-largest city, Waterbury has struggled with post-industrial economic transition while experiencing speculative real estate investment that has driven prices far beyond sustainable levels. The city’s proximity to major employment centers and relatively affordable entry prices have attracted investors and buyers seeking value, but the resulting 107.5% price surge since 2010 has created the most dangerous market conditions in Connecticut. This level of appreciation far exceeds any reasonable measure of local economic improvement or income growth.
The staggering 85.2% overextension above long-term sustainable levels represents mathematical impossibility – local economic conditions simply cannot support current housing costs. Waterbury’s history of multiple crashes, including a 10.6% decline in 2011, demonstrates this market’s extreme vulnerability to corrections. Current conditions suggest the potential for a correction far more severe than previous crashes, as the level of overvaluation now exceeds anything seen in the city’s history. This combination of extreme overvaluation, crash history, and economic limitations makes Waterbury Connecticut’s most dangerous housing market for catastrophic value destruction.