🔥 Would you like to save this?
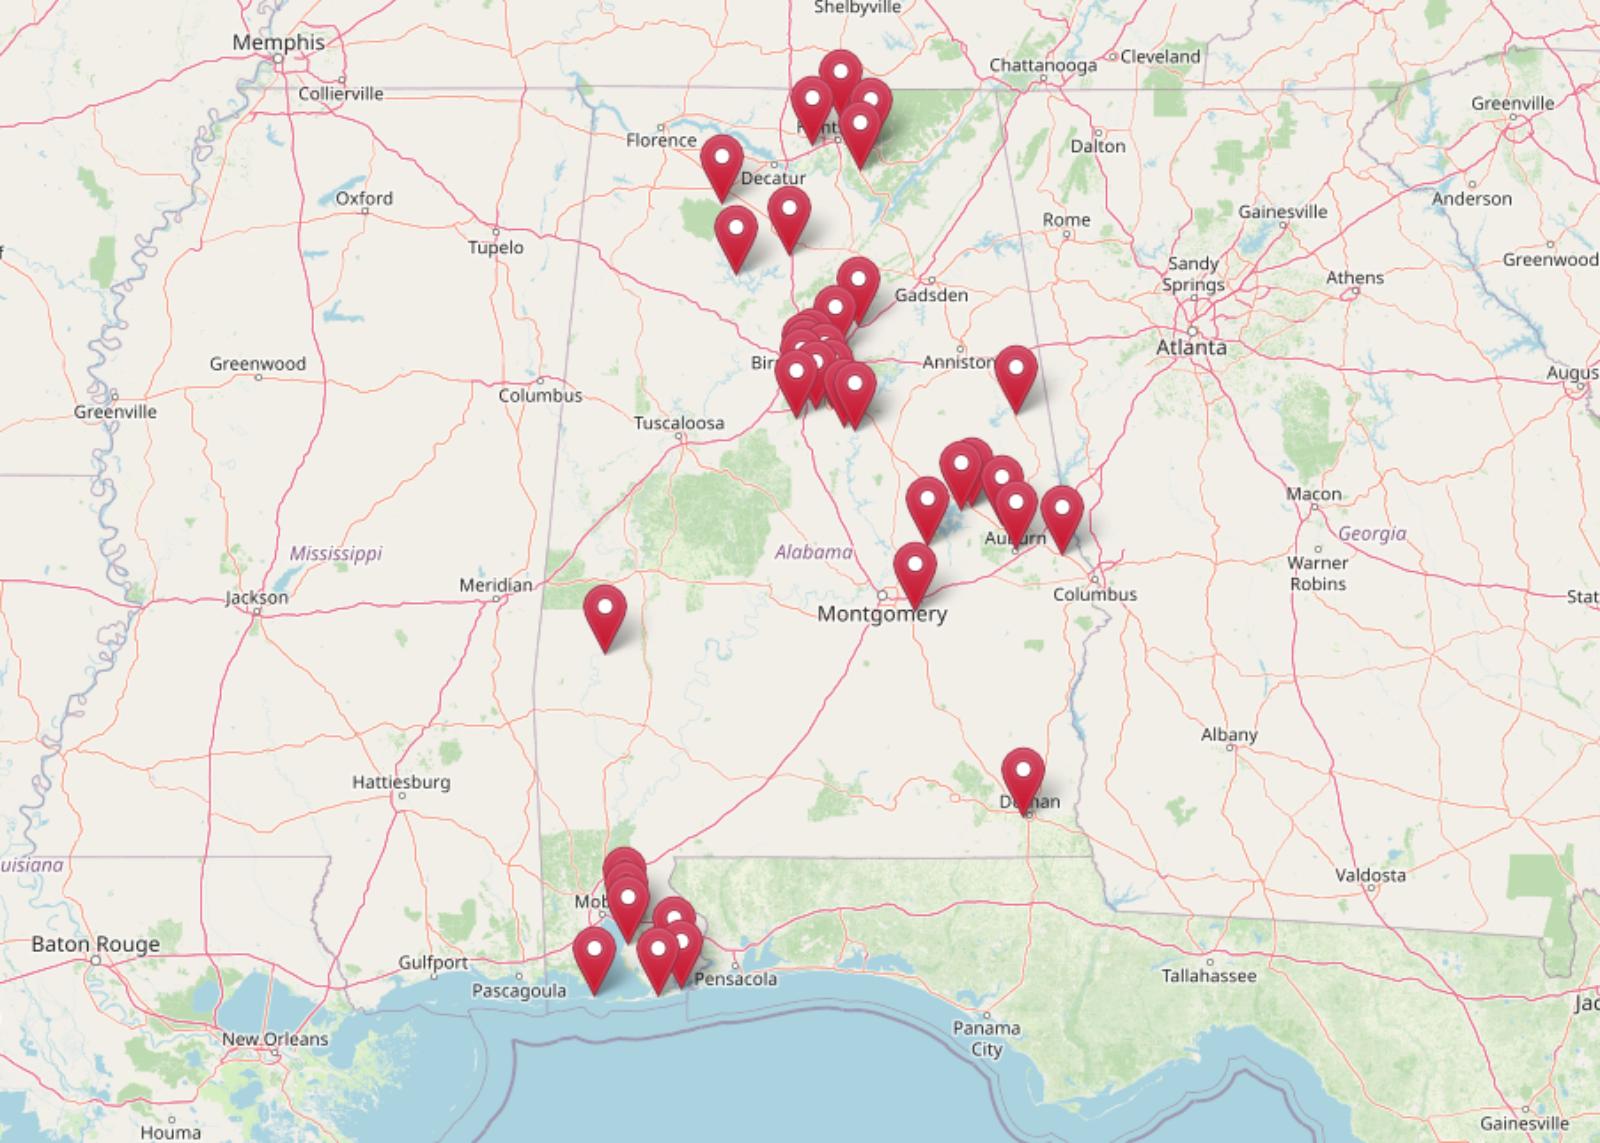
Alabama isn’t all low-cost living—some towns now top $900,000 for a median home. According to the Zillow Home Value Index, 36 communities across the state have climbed the ranks to become the priciest places to buy property. While many parts of Alabama remain budget-friendly, this list reveals where long-term demand, local appeal, and steady growth have pushed prices sky high.
36. Salem – 101% Home Price Increase Since 2010

- 2010: $159,791
- 2011: $151,646 (−$8,144, −5.10% from previous year)
- 2012: $153,849 (+$2,203, +1.45% from previous year)
- 2013: $162,793 (+$8,943, +5.81% from previous year)
- 2014: $170,660 (+$7,867, +4.83% from previous year)
- 2015: $175,417 (+$4,757, +2.79% from previous year)
- 2016: $179,405 (+$3,989, +2.27% from previous year)
- 2017: $190,990 (+$11,585, +6.46% from previous year)
- 2018: $198,396 (+$7,406, +3.88% from previous year)
- 2019: $210,815 (+$12,419, +6.26% from previous year)
- 2020: $225,620 (+$14,805, +7.02% from previous year)
- 2021: $252,818 (+$27,198, +12.05% from previous year)
- 2022: $284,439 (+$31,621, +12.51% from previous year)
- 2023: $295,613 (+$11,174, +3.93% from previous year)
- 2024: $308,700 (+$13,087, +4.43% from previous year)
- 2025: $321,421 (+$12,721, +4.12% from previous year)
Salem’s home values have more than doubled since 2010, rising from just under $160,000 to over $321,000 in 2025. While the early 2010s saw modest growth, prices began to climb steadily from 2017 onward, with particularly strong gains between 2020 and 2022. Even in recent years, prices have continued to tick upward, signaling sustained demand in this part of Lee County.
In order to come up with the very specific design ideas, we create most designs with the assistance of state-of-the-art AI interior design software. Also, assume links that take you off the site are affiliate links such as links to Amazon. this means we may earn a commission if you buy something.
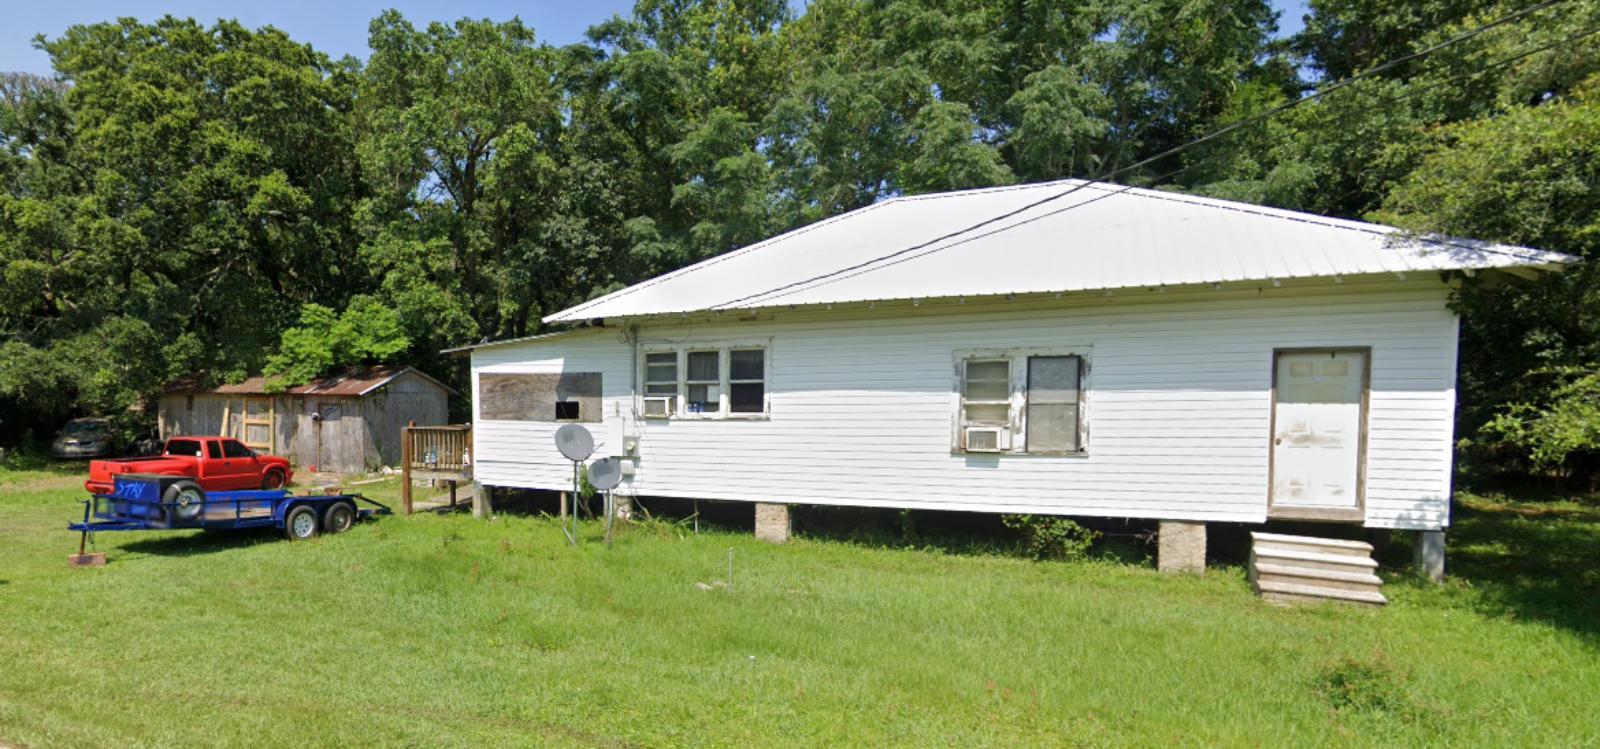
Salem – Steady Growth with Suburban Appeal

Located just east of Opelika, Salem is a quiet residential area known for its mix of countryside charm and proximity to Auburn’s job market and amenities. Families are drawn to its rural feel while still being close enough to major shopping and schools. The modest but consistent price growth reflects this balance of lifestyle and accessibility.
Unlike more volatile markets, Salem’s real estate trajectory has been mostly stable, even during national downturns. As of 2025, homes are priced around $321K—making it one of Alabama’s more expensive small-town options. Its appeal likely comes from a combination of community character, access to Auburn-area growth, and steady in-migration from neighboring states.
35. Springville – 79% Home Price Increase Since 2010

- 2010: $179,762
- 2011: $171,246 (−$8,516, −4.74% from previous year)
- 2012: $171,983 (+$737, +0.43% from previous year)
- 2013: $179,697 (+$7,715, +4.49% from previous year)
- 2014: $185,241 (+$5,543, +3.08% from previous year)
- 2015: $193,916 (+$8,675, +4.68% from previous year)
- 2016: $201,555 (+$7,639, +3.94% from previous year)
- 2017: $210,478 (+$8,923, +4.43% from previous year)
- 2018: $219,070 (+$8,592, +4.08% from previous year)
- 2019: $230,385 (+$11,316, +5.17% from previous year)
- 2020: $246,687 (+$16,302, +7.08% from previous year)
- 2021: $275,679 (+$28,992, +11.75% from previous year)
- 2022: $319,405 (+$43,726, +15.86% from previous year)
- 2023: $318,234 (−$1,172, −0.37% from previous year)
- 2024: $317,902 (−$332, −0.10% from previous year)
- 2025: $322,022 (+$4,120, +1.30% from previous year)
Springville home values have climbed nearly 80% since 2010, with a pronounced jump between 2020 and 2022. After years of steady mid-single-digit gains, prices surged in the early 2020s, then stabilized just above $320,000. Though the market cooled slightly in 2023 and 2024, it regained momentum in 2025.
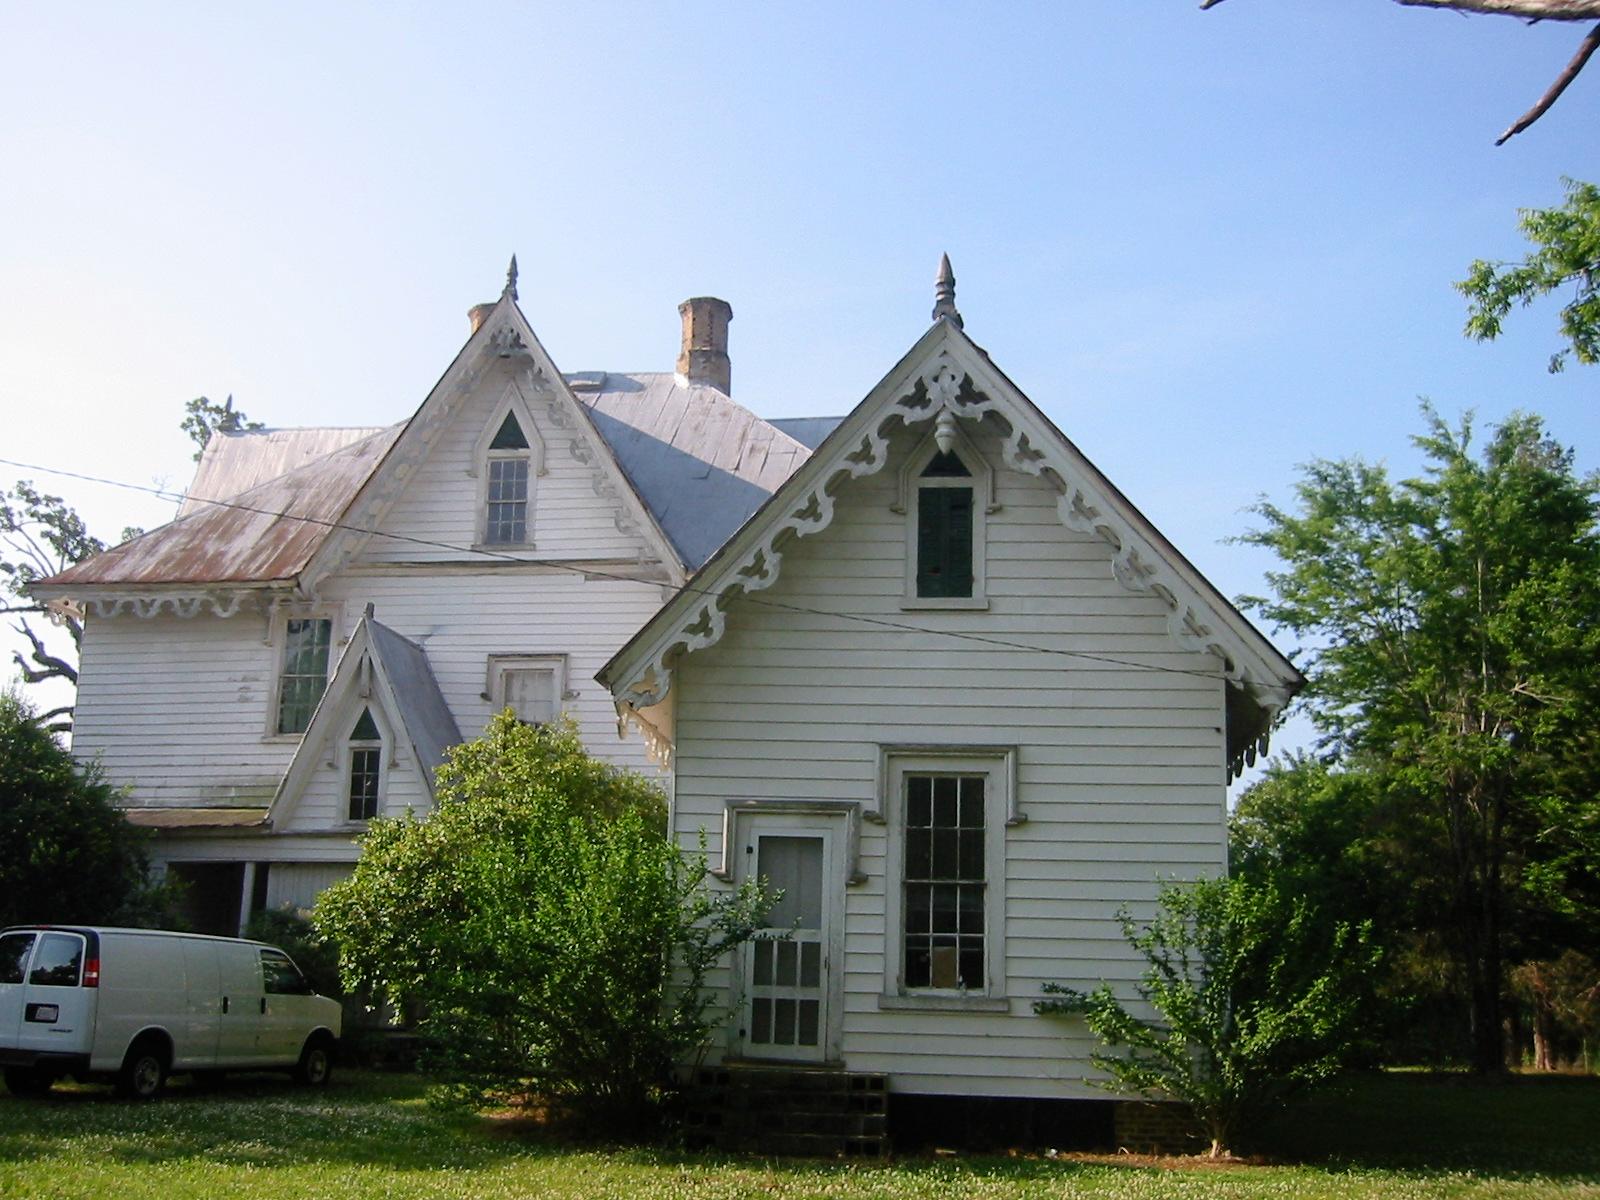
Springville – Small Town Living Meets Rising Demand

Springville, located in St. Clair County northeast of Birmingham, has become a sought-after spot for families looking to live outside the city but still within commuting distance. Its historic downtown and community events give it small-town charm, while easy access to I-59 adds convenience for daily commuters.
The area has seen infrastructure improvements and steady new construction over the past decade. That, paired with rising demand from remote workers and retirees, has pushed prices up over time. As of 2025, homes are priced just above $322K, making it one of the more costly non-metro options in the state.
34. Seminole – 108% Home Price Increase Since 2010

- 2010: $157,628
- 2011: $144,368 (−$13,259, −8.41% from previous year)
- 2012: $133,128 (−$11,240, −7.79% from previous year)
- 2013: $142,265 (+$9,137, +6.86% from previous year)
- 2014: $147,848 (+$5,583, +3.92% from previous year)
- 2015: $155,188 (+$7,340, +4.96% from previous year)
- 2016: $164,195 (+$9,007, +5.80% from previous year)
- 2017: $174,596 (+$10,402, +6.33% from previous year)
- 2018: $188,298 (+$13,702, +7.85% from previous year)
- 2019: $191,781 (+$3,483, +1.85% from previous year)
- 2020: $212,944 (+$21,163, +11.03% from previous year)
- 2021: $254,975 (+$42,032, +19.74% from previous year)
- 2022: $290,479 (+$35,504, +13.92% from previous year)
- 2023: $309,220 (+$18,741, +6.45% from previous year)
- 2024: $322,882 (+$13,662, +4.42% from previous year)
- 2025: $327,750 (+$4,868, +1.51% from previous year)
Seminole’s home values have more than doubled since 2010, with some of the strongest gains happening in the early 2020s. From a low of $133K in 2012, the town has steadily rebounded and crossed the $327K mark in 2025, largely thanks to regional housing demand and a steady stream of buyers from nearby coastal areas.
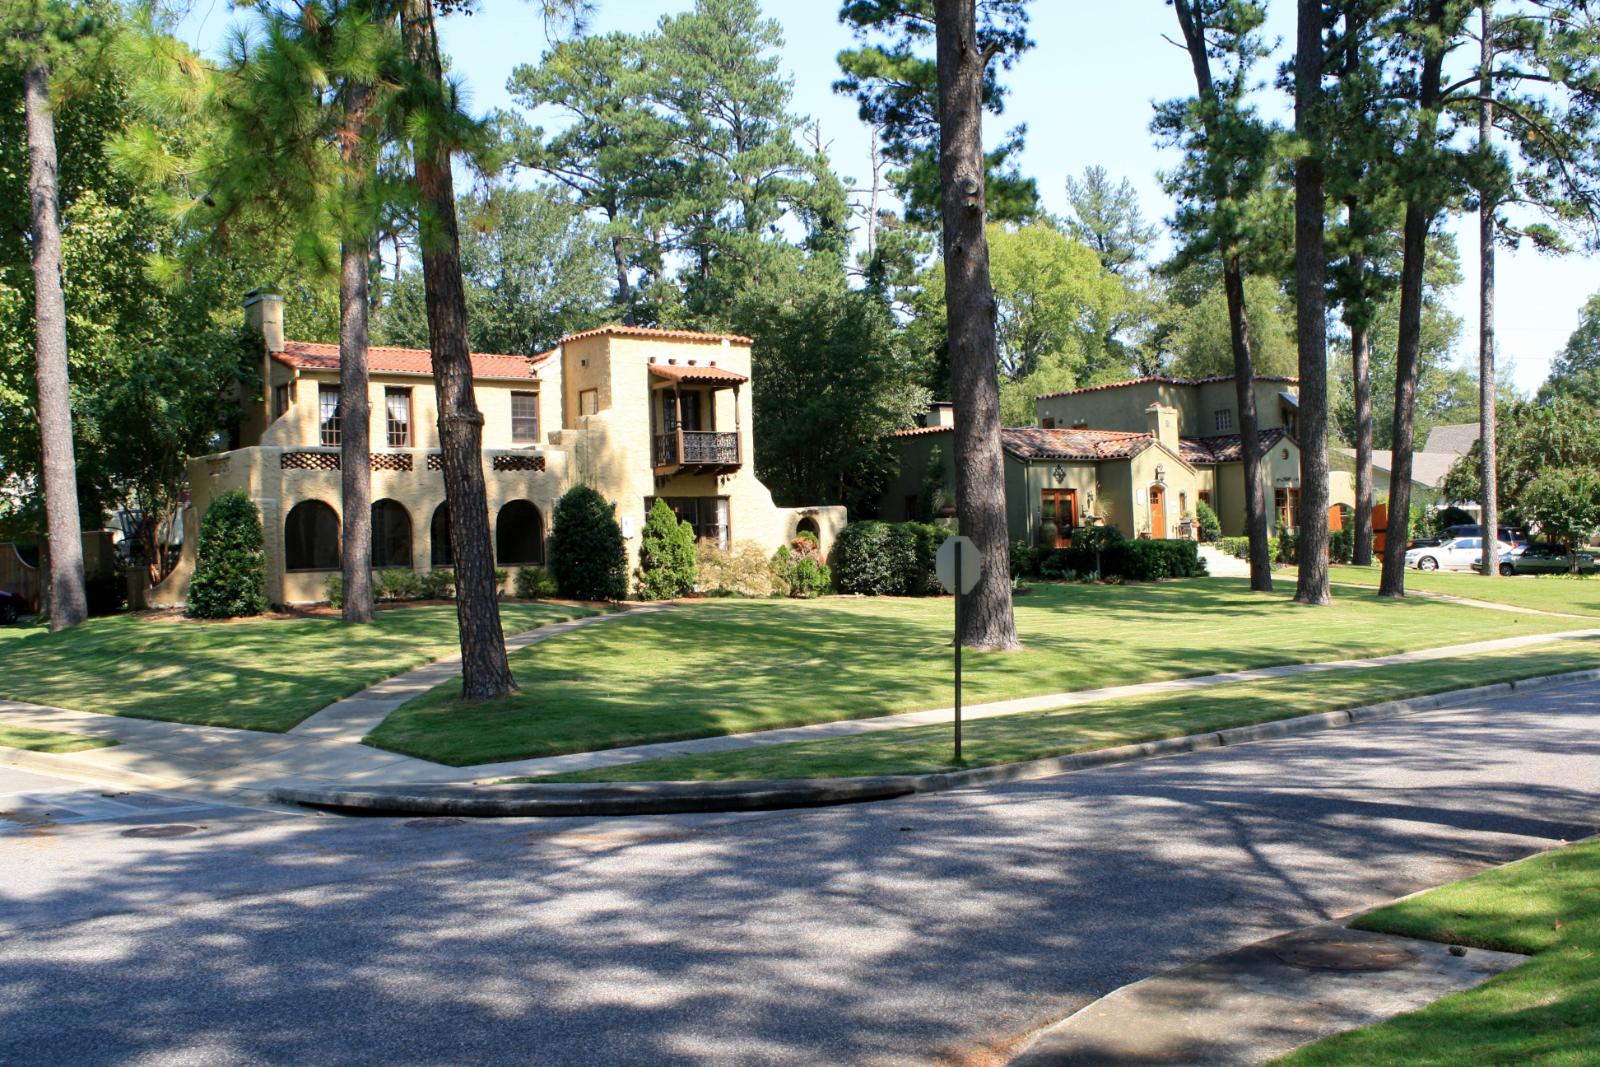
Seminole – Quiet Growth Near the Gulf Coast

Situated near Alabama’s Gulf shoreline and close to the Florida border, Seminole offers a peaceful retreat with proximity to the beaches of Perdido Key and Orange Beach. Its rural setting has become increasingly popular with retirees and vacation home buyers who want coastal access without beachfront prices.
Seminole’s price increases have been steady and demand-driven, with no major year-to-year volatility since 2013. The town’s appeal comes from its quiet roads, waterway access, and proximity to recreation. With limited supply and increasing regional growth, prices have crept up significantly over the past decade.
33. Gurley – 197% Home Price Increase Since 2010

- 2010: $112,431
- 2011: $125,283 (+$12,852, +11.43% from previous year)
- 2012: $140,750 (+$15,467, +12.35% from previous year)
- 2013: $182,993 (+$42,243, +30.01% from previous year)
- 2014: $183,879 (+$886, +0.48% from previous year)
- 2015: $187,400 (+$3,520, +1.91% from previous year)
- 2016: $194,317 (+$6,917, +3.69% from previous year)
- 2017: $199,540 (+$5,223, +2.69% from previous year)
- 2018: $208,506 (+$8,967, +4.49% from previous year)
- 2019: $219,152 (+$10,645, +5.11% from previous year)
- 2020: $248,659 (+$29,507, +13.46% from previous year)
- 2021: $294,545 (+$45,886, +18.45% from previous year)
- 2022: $347,541 (+$52,996, +17.99% from previous year)
- 2023: $346,155 (−$1,386, −0.40% from previous year)
- 2024: $339,243 (−$6,911, −2.00% from previous year)
- 2025: $334,495 (−$4,748, −1.40% from previous year)
Home prices in Gurley have soared nearly 200% since 2010, peaking at $347K in 2022 before slipping slightly. The town saw a dramatic jump in the early 2010s, particularly between 2012 and 2013, followed by a stable climb throughout the decade.
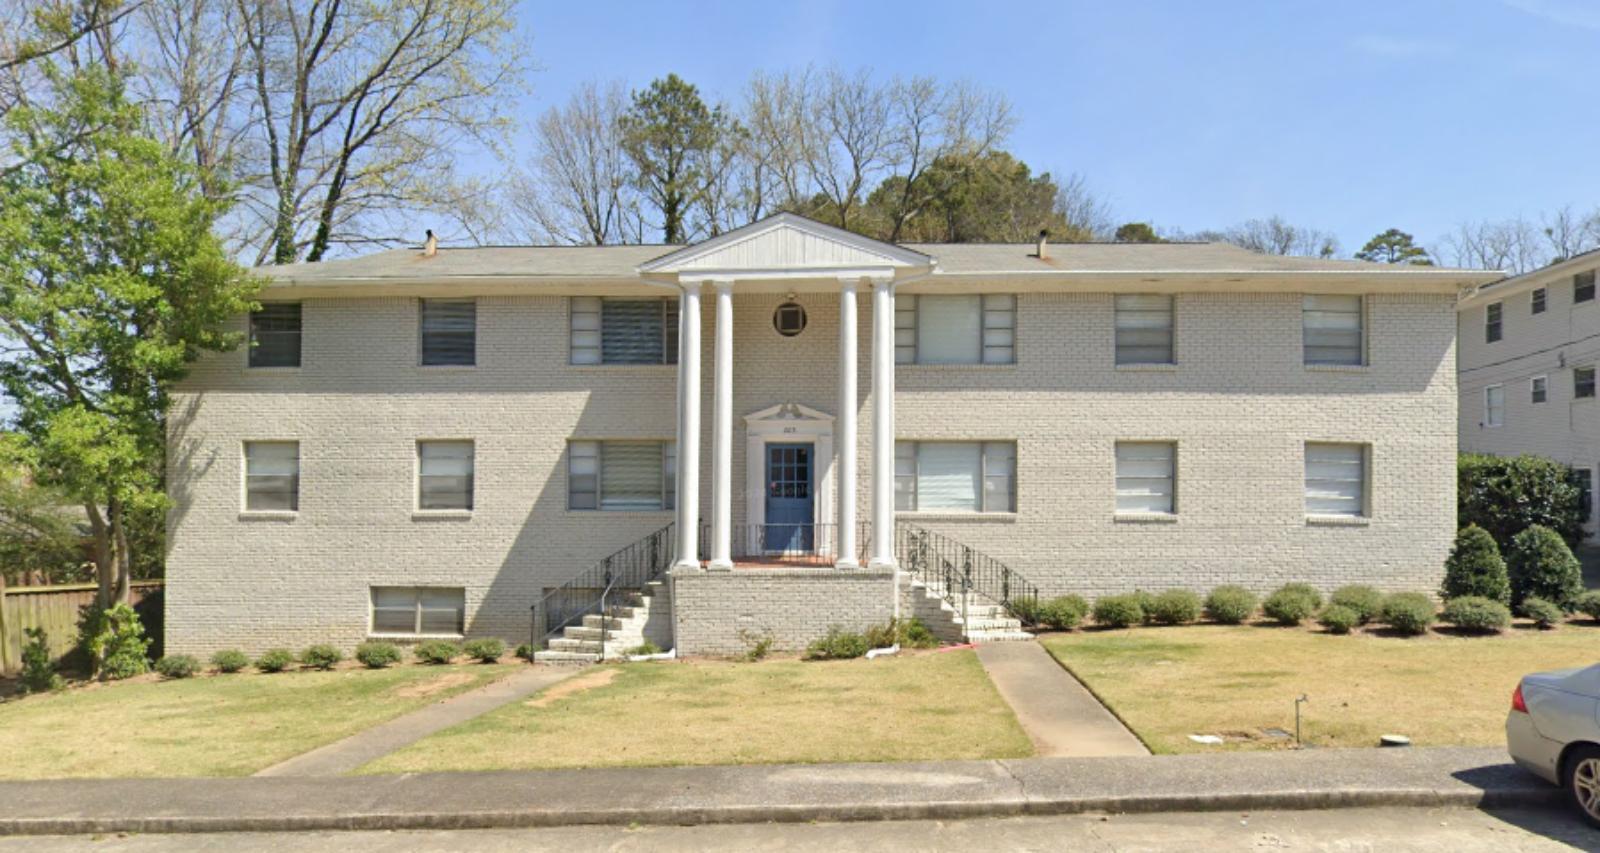
Gurley – Explosive Growth in a Small Community

Gurley is a small town in Madison County, not far from the Huntsville metro area. As Huntsville grew rapidly, Gurley began attracting buyers looking for larger lots and quieter settings with easy access to urban jobs. This spillover demand helped drive one of the biggest increases in Alabama home values over the past 15 years.
The town’s dramatic gains from 2012 to 2022 were followed by a gentle market correction. Still, with prices holding above $330K in 2025, Gurley remains one of the most expensive rural towns in the state. Its combination of scenic surroundings and regional job growth has kept it firmly on buyer radars.
32. Daphne – 82% Home Price Increase Since 2010

- 2010: $184,384
- 2011: $170,124 (−$14,260, −7.73% from previous year)
- 2012: $166,806 (−$3,318, −1.95% from previous year)
- 2013: $175,449 (+$8,643, +5.18% from previous year)
- 2014: $184,638 (+$9,189, +5.24% from previous year)
- 2015: $193,283 (+$8,645, +4.68% from previous year)
- 2016: $201,099 (+$7,816, +4.04% from previous year)
- 2017: $206,716 (+$5,617, +2.79% from previous year)
- 2018: $215,533 (+$8,817, +4.27% from previous year)
- 2019: $222,309 (+$6,776, +3.14% from previous year)
- 2020: $234,213 (+$11,904, +5.35% from previous year)
- 2021: $269,033 (+$34,820, +14.87% from previous year)
- 2022: $318,275 (+$49,242, +18.30% from previous year)
- 2023: $329,609 (+$11,333, +3.56% from previous year)
- 2024: $334,068 (+$4,459, +1.35% from previous year)
- 2025: $335,138 (+$1,070, +0.32% from previous year)
Prices in Daphne rose from $184K in 2010 to over $335K in 2025, with major leaps during the pandemic housing surge. The largest spikes occurred in 2021 and 2022, when remote work and coastal demand intensified. Since then, growth has moderated but stayed positive.
Daphne – Baldwin County’s Fast-Growing Hub

Daphne sits on the eastern shore of Mobile Bay and is one of Baldwin County’s fastest-growing cities. Known for its scenic views, good schools, and access to Mobile, it’s long been a draw for both locals and newcomers. The explosive growth from 2020 to 2022 reflects strong migration patterns and new housing development.
As of 2025, homes in Daphne average around $335K, with the market showing signs of leveling off after a sharp run-up. However, with its quality of life and growing population, demand is likely to remain strong. The area continues to see interest from retirees, military families, and regional professionals alike.
31. Wedowee – 103% Home Price Increase Since 2012

- 2012: $166,143
- 2013: $177,052 (+$10,909, +6.57% from previous year)
- 2014: $186,535 (+$9,482, +5.36% from previous year)
- 2015: $187,752 (+$1,217, +0.65% from previous year)
- 2016: $197,393 (+$9,640, +5.13% from previous year)
- 2017: $204,180 (+$6,787, +3.44% from previous year)
- 2018: $216,181 (+$12,001, +5.88% from previous year)
- 2019: $218,132 (+$1,951, +0.90% from previous year)
- 2020: $228,950 (+$10,817, +4.96% from previous year)
- 2021: $294,006 (+$65,056, +28.41% from previous year)
- 2022: $343,752 (+$49,746, +16.92% from previous year)
- 2023: $326,472 (−$17,280, −5.03% from previous year)
- 2024: $330,616 (+$4,144, +1.27% from previous year)
- 2025: $337,817 (+$7,201, +2.18% from previous year)
Wedowee’s home values have risen over 100% since 2012, driven mostly by a dramatic spike between 2020 and 2022. Though the market experienced a brief cooling in 2023, prices have since recovered, reaching nearly $338,000 in 2025. For a small town in rural Randolph County, this level of growth is significant and reflects broader trends in demand for lake-area properties and second homes.
Wedowee – Lakeside Demand Fuels Price Climb

Located near the banks of Lake Wedowee (also known as R.L. Harris Reservoir), this town has become an increasingly attractive destination for retirees, vacation homebuyers, and remote workers. The lake itself is a major draw—offering boating, fishing, and scenic views in a peaceful, uncrowded setting. As metro buyers look to smaller, lifestyle-focused destinations, towns like Wedowee have benefited from renewed interest in waterfront living.
Much of the housing demand here is for properties with lake access or views, which has significantly pushed up prices in recent years. The jump in 2021–2022 prices reflects both pandemic-related buying behavior and a limited local inventory. Wedowee also attracts part-time residents from Georgia and Florida, further increasing pressure on a small supply base. With few large-scale developments in the pipeline, values are likely to remain elevated. Buyers here aren’t just looking for a house—they’re looking for a lifestyle change, and that’s keeping demand steady even as rates fluctuate elsewhere.
30. Meridianville – 164% Home Price Increase Since 2010

🔥 Would you like to save this?
- 2010: $128,582
- 2011: $129,780 (+$1,198, +0.93% from previous year)
- 2012: $141,288 (+$11,508, +8.87% from previous year)
- 2013: $178,055 (+$36,767, +26.02% from previous year)
- 2014: $177,884 (−$170, −0.10% from previous year)
- 2015: $177,408 (−$477, −0.27% from previous year)
- 2016: $181,491 (+$4,083, +2.30% from previous year)
- 2017: $187,949 (+$6,458, +3.56% from previous year)
- 2018: $198,400 (+$10,451, +5.56% from previous year)
- 2019: $209,635 (+$11,235, +5.66% from previous year)
- 2020: $231,320 (+$21,685, +10.34% from previous year)
- 2021: $281,354 (+$50,034, +21.63% from previous year)
- 2022: $335,196 (+$53,842, +19.14% from previous year)
- 2023: $333,881 (−$1,315, −0.39% from previous year)
- 2024: $333,115 (−$766, −0.23% from previous year)
- 2025: $339,281 (+$6,166, +1.85% from previous year)
Home prices in Meridianville have soared from $128,582 in 2010 to over $339,000 in 2025—a gain of more than 160%. The biggest jumps came between 2020 and 2022, when prices spiked dramatically. Despite a slight flattening in 2023 and 2024, values resumed growth in 2025 and remain well above pre-pandemic levels.
Meridianville – Suburban Surge North of Huntsville

Meridianville sits just north of Huntsville and has become one of the area’s fastest-growing bedroom communities. Its rise is closely tied to the explosive expansion of the Huntsville metro, which has added jobs in aerospace, defense, and tech over the last decade. As workers looked for affordable housing options outside the city, Meridianville emerged as a top choice. New subdivisions, better schools, and increasing amenities have all contributed to rising demand. Buyers are often drawn to the larger homes and newer construction available here compared to older neighborhoods closer to downtown Huntsville.
The area still offers a semi-rural feel in parts, which makes it attractive for families and professionals alike. Major thoroughfares connect Meridianville to downtown within 20–25 minutes, making it a practical commute zone. With limited land left near central Huntsville, towns like Meridianville are now the frontier of metro-area expansion.
29. Stapleton – 156% Home Price Increase Since 2010

- 2010: $132,917
- 2011: $123,979 (−$8,938, −6.72% from previous year)
- 2012: $127,030 (+$3,051, +2.46% from previous year)
- 2013: $137,919 (+$10,889, +8.57% from previous year)
- 2014: $142,787 (+$4,868, +3.53% from previous year)
- 2015: $155,266 (+$12,480, +8.74% from previous year)
- 2016: $167,625 (+$12,359, +7.96% from previous year)
- 2017: $173,574 (+$5,949, +3.55% from previous year)
- 2018: $192,689 (+$19,115, +11.01% from previous year)
- 2019: $198,010 (+$5,320, +2.76% from previous year)
- 2020: $218,377 (+$20,367, +10.29% from previous year)
- 2021: $266,743 (+$48,367, +22.15% from previous year)
- 2022: $302,102 (+$35,359, +13.26% from previous year)
- 2023: $317,774 (+$15,672, +5.19% from previous year)
- 2024: $331,795 (+$14,021, +4.41% from previous year)
- 2025: $339,837 (+$8,042, +2.42% from previous year)
Stapleton has seen a remarkable 156% gain in home values since 2010, with the sharpest appreciation taking place between 2020 and 2022. Prices went from $132,917 to nearly $340,000 in 2025, with only minor corrections during the recent cooling period. The upward momentum is supported by strong demand and modest inventory.
Stapleton – Quiet Rural Town with Soaring Prices

Located in Baldwin County, Stapleton is a small rural town that’s flown under the radar for years—until recently. While the town lacks the bustle of coastal markets, it’s strategically placed between Bay Minette and Spanish Fort, making it an ideal location for commuters who prefer open space. Stapleton offers generous lot sizes, peaceful surroundings, and a growing number of newer homes that appeal to families and retirees alike.
Its location near U.S. Route 31 and Alabama State Route 59 means that shopping, schools, and employment centers are all within a short drive. The price surge from 2020 to 2022 was likely driven by buyers seeking affordability just outside of higher-priced areas along the coast. As other parts of Baldwin County became saturated, Stapleton emerged as a value alternative. Real estate here remains tight, and demand hasn’t eased significantly, which has kept prices high in 2025.
28. Wilsonville – 97% Home Price Increase Since 2010

- 2010: $172,159
- 2011: $170,107 (−$2,053, −1.19% from previous year)
- 2012: $169,750 (−$357, −0.21% from previous year)
- 2013: $176,265 (+$6,515, +3.84% from previous year)
- 2014: $188,715 (+$12,450, +7.06% from previous year)
- 2015: $195,042 (+$6,327, +3.35% from previous year)
- 2016: $199,768 (+$4,726, +2.42% from previous year)
- 2017: $209,385 (+$9,617, +4.81% from previous year)
- 2018: $219,686 (+$10,302, +4.92% from previous year)
- 2019: $238,778 (+$19,092, +8.69% from previous year)
- 2020: $248,776 (+$9,998, +4.19% from previous year)
- 2021: $282,924 (+$34,148, +13.73% from previous year)
- 2022: $322,144 (+$39,220, +13.86% from previous year)
- 2023: $319,733 (−$2,410, −0.75% from previous year)
- 2024: $337,189 (+$17,455, +5.46% from previous year)
- 2025: $339,963 (+$2,774, +0.82% from previous year)
Wilsonville’s home prices rose from $172,159 in 2010 to nearly $340,000 in 2025—an increase of 97%. The strongest gains occurred in 2021 and 2022, with growth largely holding steady through 2025 despite a small dip in 2023. The long-term trend reflects a solid upward trajectory in this quiet Shelby County town.
Wilsonville – Rural Calm with Price Resilience
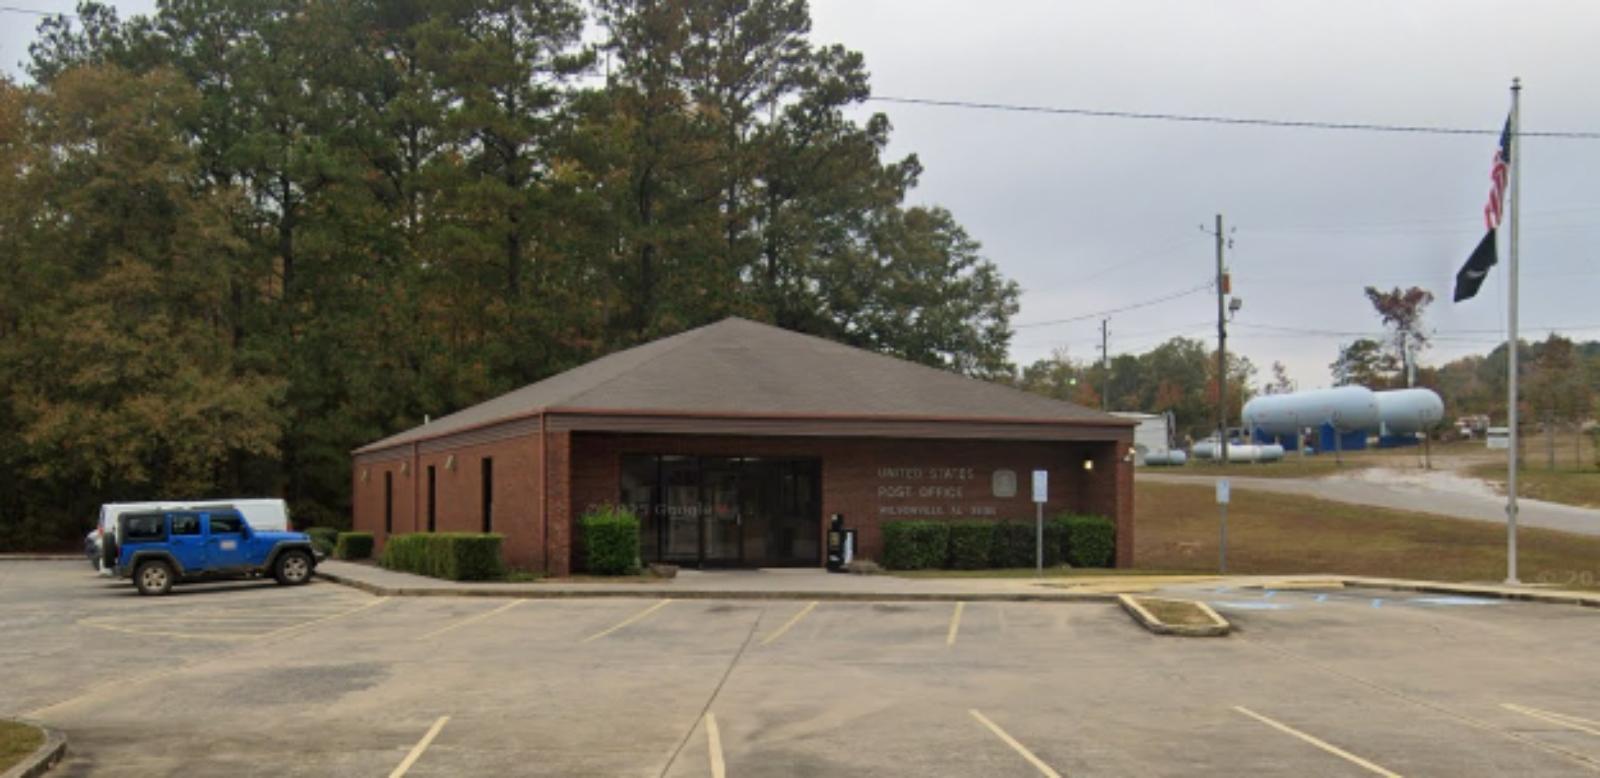
Wilsonville lies along the Coosa River in Shelby County and is known for its peaceful, natural surroundings and wide-open spaces. The town has maintained a strong appeal for buyers looking to escape urban noise while remaining within reach of Birmingham’s southeastern suburbs. With its rich agricultural roots, many homes in Wilsonville offer generous plots, mature trees, and scenic views—attracting a mix of retirees, hobby farmers, and suburban escapees. Prices accelerated significantly during the 2021 housing rush and continued into 2022, a reflection of rising regional demand for country living.
While the town hasn’t seen massive infrastructure changes, it’s benefited from the ripple effect of suburban expansion in nearby Alabaster and Chelsea. Most of the housing stock here is single-family, with limited multifamily development, contributing to consistently low inventory. That’s helped stabilize prices even during broader market fluctuations.
27. Eclectic – 90% Home Price Increase Since 2010

- 2010: $186,561
- 2011: $185,569 (−$991, −0.53% from previous year)
- 2012: $177,295 (−$8,274, −4.46% from previous year)
- 2013: $179,651 (+$2,356, +1.33% from previous year)
- 2014: $191,311 (+$11,660, +6.49% from previous year)
- 2015: $206,476 (+$15,165, +7.93% from previous year)
- 2016: $206,910 (+$434, +0.21% from previous year)
- 2017: $216,465 (+$9,555, +4.62% from previous year)
- 2018: $223,147 (+$6,682, +3.09% from previous year)
- 2019: $236,018 (+$12,870, +5.77% from previous year)
- 2020: $250,269 (+$14,252, +6.04% from previous year)
- 2021: $287,772 (+$37,503, +14.98% from previous year)
- 2022: $320,977 (+$33,205, +11.54% from previous year)
- 2023: $323,877 (+$2,900, +0.90% from previous year)
- 2024: $344,000 (+$20,123, +6.21% from previous year)
- 2025: $355,114 (+$11,113, +3.23% from previous year)
Eclectic’s home prices have increased from $186,561 in 2010 to $355,114 in 2025, marking a 90% overall rise. The growth has been especially strong since 2020, with double-digit percentage jumps in both 2021 and 2022. Continued buyer interest and modest local inventory have helped prices remain on a firm upward path.
Eclectic – River Region Town with Broad Appeal

Eclectic is a small town in Elmore County nestled in Alabama’s River Region. Its unusual name draws curiosity, but it’s the location and affordability that keep buyers interested. Eclectic is just a short drive from Lake Martin, one of Alabama’s largest and most scenic reservoirs, making it popular among vacationers and retirees. The town itself offers quiet neighborhoods, a strong school system, and a slower pace of life that’s hard to find in larger nearby cities.
With Montgomery only 40 minutes away, Eclectic serves as a peaceful bedroom community while still offering access to urban employment and healthcare centers. The housing stock has grown modestly, mostly through small subdivisions and scattered rural development. While the area lacks large-scale commercial centers, residents benefit from a mix of local shops and easy access to Wetumpka and Tallassee. The pandemic-era rush for homes with space and tranquility accelerated Eclectic’s growth in ways that are still playing out in 2025.
26. Helena – 81% Home Price Increase Since 2010

- 2010: $196,601
- 2011: $186,689 (−$9,913, −5.04% from previous year)
- 2012: $183,961 (−$2,728, −1.46% from previous year)
- 2013: $190,574 (+$6,613, +3.59% from previous year)
- 2014: $198,976 (+$8,402, +4.41% from previous year)
- 2015: $204,592 (+$5,616, +2.82% from previous year)
- 2016: $214,101 (+$9,510, +4.65% from previous year)
- 2017: $221,165 (+$7,063, +3.30% from previous year)
- 2018: $230,690 (+$9,525, +4.31% from previous year)
- 2019: $247,398 (+$16,708, +7.24% from previous year)
- 2020: $262,315 (+$14,917, +6.03% from previous year)
- 2021: $296,742 (+$34,427, +13.12% from previous year)
- 2022: $350,384 (+$53,642, +18.08% from previous year)
- 2023: $352,881 (+$2,497, +0.71% from previous year)
- 2024: $356,781 (+$3,899, +1.11% from previous year)
- 2025: $356,768 (−$13, −0.00% from previous year)
Helena’s home values have risen more than 80% since 2010, increasing steadily throughout the decade with a pronounced spike in the early 2020s. Prices peaked in 2022, and while growth has cooled, home values remain stable at over $356,000 in 2025, making Helena a solidly upper-tier suburb.
Helena – Top-Ranked Schools and Steady Demand

Helena is located in Shelby County, southwest of Birmingham, and has long been considered one of the most desirable suburbs in the Birmingham metro area.
Known for its excellent public schools, low crime, and family-friendly environment, Helena consistently ranks among the best places to live in Alabama. Its housing market has benefitted from a strong blend of stability and upward mobility. Many of its neighborhoods offer newer homes, good lot sizes, and access to green spaces like Joe Tucker Park and Cahaba Lily Park. The city has been deliberate about planning, avoiding overbuilding while expanding infrastructure and services in line with growth. Residents enjoy a true suburb-within-nature feel, which remains a key draw in an increasingly crowded metro landscape. As families relocate for schools and quality of life, Helena is often at the top of the list.
25. Madison – 172% Home Price Increase Since 2010

- 2010: $139,969
- 2011: $147,663 (+$7,694, +5.50% from previous year)
- 2012: $162,474 (+$14,811, +10.03% from previous year)
- 2013: $218,476 (+$56,002, +34.47% from previous year)
- 2014: $218,169 (−$307, −0.14% from previous year)
- 2015: $218,785 (+$616, +0.28% from previous year)
- 2016: $219,690 (+$905, +0.41% from previous year)
- 2017: $226,331 (+$6,641, +3.02% from previous year)
- 2018: $233,718 (+$7,387, +3.26% from previous year)
- 2019: $245,750 (+$12,033, +5.15% from previous year)
- 2020: $268,321 (+$22,570, +9.18% from previous year)
- 2021: $323,693 (+$55,372, +20.64% from previous year)
- 2022: $381,882 (+$58,189, +17.98% from previous year)
- 2023: $380,158 (−$1,724, −0.45% from previous year)
- 2024: $380,735 (+$577, +0.15% from previous year)
- 2025: $380,288 (−$447, −0.12% from previous year)
Home prices in Madison have surged from $139,969 in 2010 to over $380,000 in 2025—a gain of more than 170%. A particularly dramatic spike occurred in 2013, when prices jumped by over 34% in a single year. While growth has slowed recently, values have held firm, reflecting the town’s strong fundamentals.
Madison – High-Tech Growth and Top Schools

Madison is one of the most dynamic housing markets in northern Alabama, located directly adjacent to Huntsville. It has become a magnet for tech workers, engineers, and families thanks to its strong school systems, modern infrastructure, and close ties to the region’s aerospace and defense industries. Redstone Arsenal, NASA facilities, and a growing roster of private-sector employers have all contributed to population growth in the area.
Housing demand remains strong despite slowing price growth, and many buyers continue to be priced out of Huntsville itself, pushing into Madison as a next-best alternative. The city offers new master-planned communities, greenways, and local shopping centers that have enhanced livability. Despite being a fast-growing suburb, Madison has managed to preserve a community-centered feel with parks, events, and civic engagement. Strong zoning and public investment have helped guide its growth, making it more sustainable than many other boom towns.
24. Chelsea – 70% Home Price Increase Since 2010

🔥 Would you like to save this?
- 2010: $225,847
- 2011: $213,992 (−$11,855, −5.25% from previous year)
- 2012: $215,660 (+$1,668, +0.78% from previous year)
- 2013: $222,209 (+$6,549, +3.04% from previous year)
- 2014: $231,305 (+$9,097, +4.09% from previous year)
- 2015: $237,252 (+$5,947, +2.57% from previous year)
- 2016: $248,184 (+$10,932, +4.61% from previous year)
- 2017: $253,942 (+$5,758, +2.32% from previous year)
- 2018: $261,845 (+$7,903, +3.11% from previous year)
- 2019: $274,030 (+$12,185, +4.65% from previous year)
- 2020: $286,368 (+$12,337, +4.50% from previous year)
- 2021: $325,291 (+$38,923, +13.59% from previous year)
- 2022: $385,569 (+$60,278, +18.53% from previous year)
- 2023: $383,392 (−$2,177, −0.56% from previous year)
- 2024: $382,811 (−$581, −0.15% from previous year)
- 2025: $383,951 (+$1,140, +0.30% from previous year)
Chelsea’s home values have grown from $225,847 in 2010 to nearly $384,000 in 2025. The biggest increases occurred during 2021 and 2022, with back-to-back double-digit percentage gains. Since then, the market has cooled slightly, but prices remain near record highs.
Chelsea – Fast-Growing Suburb in Shelby County

Located along U.S. Highway 280 in Shelby County, Chelsea has become one of Birmingham’s most desirable outer-ring suburbs. Its appeal stems from a mix of newer housing developments, strong schools, and access to scenic outdoor amenities. Over the past decade, the city has experienced a population boom, which has fueled real estate demand and pushed prices steadily upward.
Chelsea’s city planners have worked to balance growth with livability, ensuring that infrastructure, parks, and public services scale alongside the housing stock. New subdivisions and family-friendly communities dominate the local real estate landscape, many offering homes in the $350K to $450K range. For homebuyers looking for newer construction and a quieter setting than what’s found closer to Birmingham’s core, Chelsea has become the go-to choice. School ratings, low crime, and job access are among the top reasons families are moving in droves.
23. Waverly – 108% Home Price Increase Since 2010

- 2010: $184,907
- 2011: $176,317 (−$8,590, −4.65% from previous year)
- 2012: $172,857 (−$3,460, −1.96% from previous year)
- 2013: $185,518 (+$12,661, +7.32% from previous year)
- 2014: $200,762 (+$15,244, +8.22% from previous year)
- 2015: $207,384 (+$6,622, +3.30% from previous year)
- 2016: $219,674 (+$12,289, +5.93% from previous year)
- 2017: $228,894 (+$9,221, +4.20% from previous year)
- 2018: $240,536 (+$11,641, +5.09% from previous year)
- 2019: $255,075 (+$14,539, +6.04% from previous year)
- 2020: $288,291 (+$33,216, +13.02% from previous year)
- 2021: $329,801 (+$41,510, +14.40% from previous year)
- 2022: $365,509 (+$35,708, +10.83% from previous year)
- 2023: $366,394 (+$884, +0.24% from previous year)
- 2024: $387,754 (+$21,360, +5.83% from previous year)
- 2025: $385,238 (−$2,516, −0.65% from previous year)
Waverly’s home prices have climbed from just under $185,000 in 2010 to more than $385,000 in 2025—more than doubling in 15 years. The biggest increases came between 2020 and 2022, during which prices jumped over $77,000. Prices dipped slightly in 2025 but remain high relative to most small towns in Alabama.
Waverly – High-End Small Town Living in East Alabama
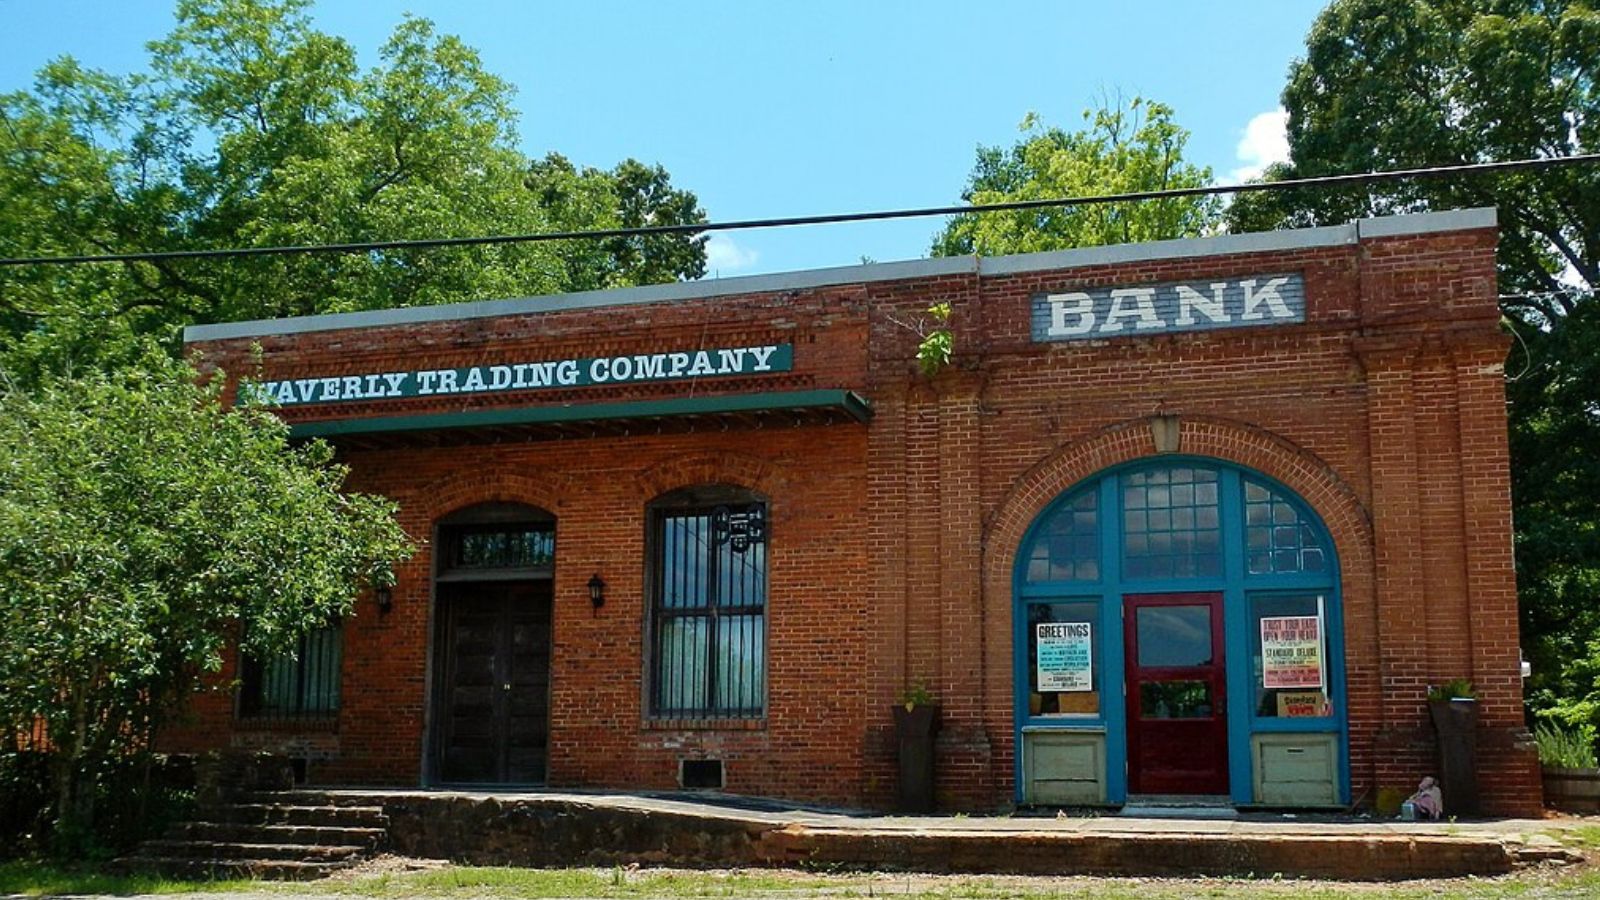
Waverly is a tiny but sought-after town located between Auburn and Lake Martin. Its charm lies in its size—just a few hundred residents—and its carefully preserved historic character. Waverly hosts one of Alabama’s most popular independent arts and music festivals each year, drawing a mix of creatives and professionals to the area.
Real estate here is limited and highly localized; there are few subdivisions, and many homes are custom-built or historical. This scarcity of inventory is a big reason why prices have risen so sharply. Buyers are often looking for weekend homes or retirement properties near Auburn, and Waverly offers quiet seclusion with convenient access to the university town. The area also appeals to those who want to be close to Lake Martin without paying waterfront premiums. For buyers looking to escape suburban sprawl, Waverly is often at the top of the list.
22. Elberta – 144.2% Home Price Increase Since 2010

- 2010: $158,529
- 2011: $150,442 (−$8,087, −5.10% from previous year)
- 2012: $141,132 (−$9,310, −6.19% from previous year)
- 2013: $152,779 (+$11,647, +8.25% from previous year)
- 2014: $158,368 (+$5,589, +3.66% from previous year)
- 2015: $169,261 (+$10,893, +6.88% from previous year)
- 2016: $179,520 (+$10,259, +6.06% from previous year)
- 2017: $195,603 (+$16,082, +8.96% from previous year)
- 2018: $218,153 (+$22,550, +11.53% from previous year)
- 2019: $224,922 (+$6,770, +3.10% from previous year)
- 2020: $254,564 (+$29,642, +13.18% from previous year)
- 2021: $320,803 (+$66,239, +26.02% from previous year)
- 2022: $356,924 (+$36,120, +11.26% from previous year)
- 2023: $371,168 (+$14,244, +3.99% from previous year)
- 2024: $380,210 (+$9,043, +2.44% from previous year)
- 2025: $387,030 (+$6,820, +1.79% from previous year)
Home values in Elberta have more than doubled since 2010, rising from $158,529 to $387,030 by 2025—a 144.2% increase. After a slow start marked by price drops through 2012, growth accelerated year after year, particularly post-2017. A massive jump in 2021 helped establish Elberta as one of the fastest climbers on Alabama’s high-end property ladder.
Elberta – Small-Town Charm with Surging Demand

Elberta, located in Baldwin County near the Gulf Coast, has quietly transformed from a rural town into a desirable housing market. Its proximity to beaches, coupled with low property taxes and open land, has made it a magnet for homebuyers priced out of larger Gulf communities like Foley and Gulf Shores. As coastal real estate heats up, towns like Elberta become strategic alternatives for buyers seeking affordability and access.
Much of the growth here has come from new construction and incoming retirees seeking a quieter lifestyle with modern amenities. The post-pandemic years saw a sharp rise in demand for land and space, and Elberta delivered both. While it retains its agricultural roots, the town’s real estate momentum suggests it will continue trending upward—especially as infrastructure and development continue pushing eastward along Alabama’s coast.
21. Houston – 59.7% Home Price Increase Since 2010

- 2010: $244,349
- 2011: $237,297 (−$7,052, −2.89% from previous year)
- 2012: $238,769 (+$1,472, +0.62% from previous year)
- 2013: $233,929 (−$4,841, −2.03% from previous year)
- 2014: $223,873 (−$10,056, −4.30% from previous year)
- 2015: $210,818 (−$13,055, −5.83% from previous year)
- 2016: $212,494 (+$1,676, +0.80% from previous year)
- 2017: $229,629 (+$17,135, +8.06% from previous year)
- 2018: $241,043 (+$11,415, +4.97% from previous year)
- 2019: $249,321 (+$8,277, +3.43% from previous year)
- 2020: $261,675 (+$12,354, +4.95% from previous year)
- 2021: $324,481 (+$62,806, +24.00% from previous year)
- 2022: $370,957 (+$46,476, +14.32% from previous year)
- 2023: $375,884 (+$4,927, +1.33% from previous year)
- 2024: $381,515 (+$5,631, +1.50% from previous year)
- 2025: $390,215 (+$8,700, +2.28% from previous year)
Houston has posted a 59.7% increase in home values since 2010, ending at $390,215 in 2025. Prices declined for several years after 2010 but bounced back sharply in 2021 and 2022. Those two years alone account for the bulk of the town’s real estate growth, showing a late but strong entry into Alabama’s high-value markets.
Houston – A Quiet Market That Caught Fire Late

Tucked in Winston County, Houston is one of Alabama’s smallest incorporated towns—but it has seen notable property appreciation in recent years. Its appeal stems from its rural character, access to nearby Lewis Smith Lake, and low population density. These qualities made it a pandemic-era favorite for out-of-state buyers seeking land, space, and lake views without the congestion of larger markets.
The boom of 2021 and 2022 pushed prices up quickly, fueled by demand for recreational second homes and cabins. Houston’s low base price and scenic positioning made it ripe for price acceleration. While values have stabilized since, the town remains firmly on the radar for both investors and nature-seeking homeowners who want proximity to Alabama’s vast outdoor resources.
20. Trussville – 71.8% Home Price Increase Since 2010

- 2010: $228,674
- 2011: $221,711 (−$6,963, −3.04% from previous year)
- 2012: $216,723 (−$4,988, −2.25% from previous year)
- 2013: $227,159 (+$10,437, +4.82% from previous year)
- 2014: $236,974 (+$9,814, +4.32% from previous year)
- 2015: $242,814 (+$5,841, +2.46% from previous year)
- 2016: $251,600 (+$8,786, +3.62% from previous year)
- 2017: $258,076 (+$6,475, +2.57% from previous year)
- 2018: $267,164 (+$9,088, +3.52% from previous year)
- 2019: $278,924 (+$11,761, +4.40% from previous year)
- 2020: $292,527 (+$13,603, +4.88% from previous year)
- 2021: $330,723 (+$38,196, +13.06% from previous year)
- 2022: $380,783 (+$50,060, +15.14% from previous year)
- 2023: $385,642 (+$4,859, +1.28% from previous year)
- 2024: $389,166 (+$3,524, +0.91% from previous year)
- 2025: $392,946 (+$3,780, +0.97% from previous year)
Trussville’s home values grew 71.8% from $228,674 in 2010 to $392,946 in 2025. After steady, moderate growth throughout the 2010s, prices surged during the 2021–2022 real estate boom. The town’s stability and consistent upward momentum make it a solid player in Alabama’s top real estate markets.
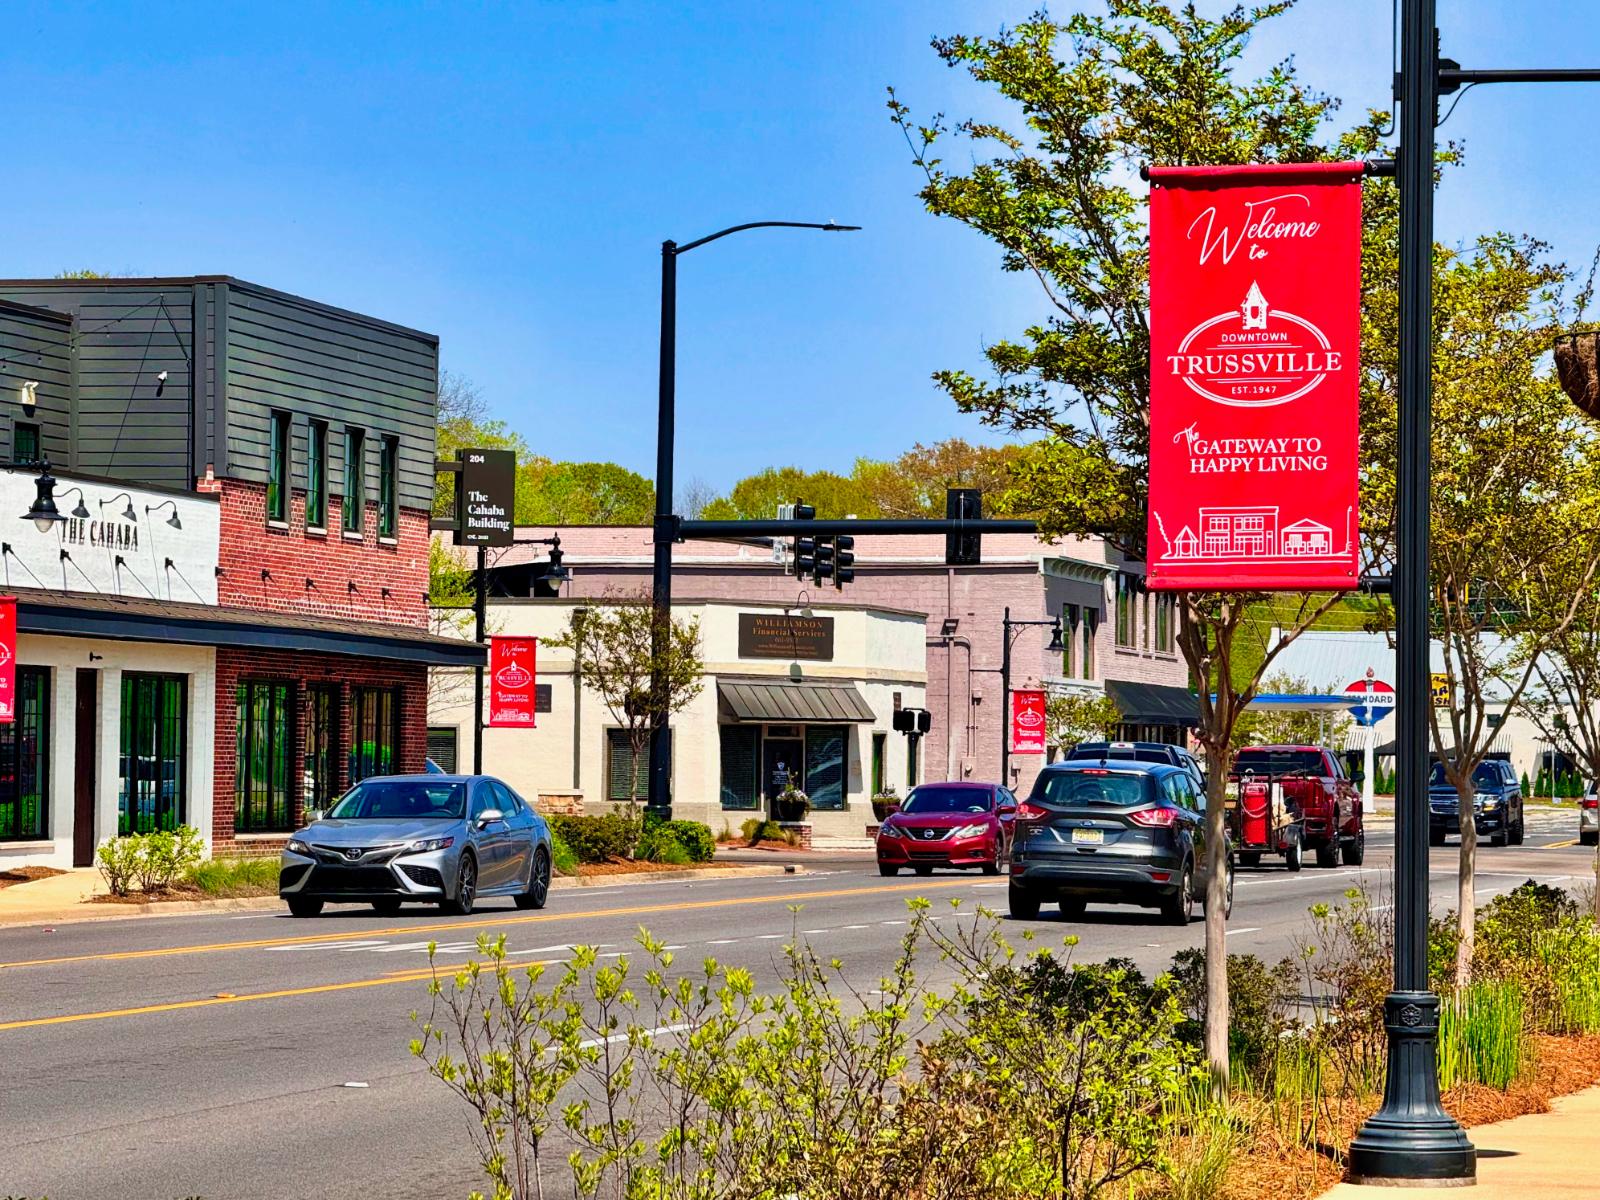
Trussville – Steady Growth Meets Pandemic-Era Spike
🔥 Would you like to save this?
Just northeast of Birmingham, Trussville has long been considered one of the metro area’s fastest-growing suburbs. Known for its top-rated schools and modern developments, the city saw consistent appreciation even before the housing surge. It became particularly attractive to families during the pandemic thanks to its mix of new construction and established neighborhoods.
The boom in 2021–2022 brought larger jumps in pricing, but unlike some towns, Trussville hasn’t backtracked. That resilience speaks to ongoing demand from Birmingham commuters and buyers looking for suburban comfort without sacrificing convenience. With multiple shopping centers, parks, and community infrastructure, Trussville’s rise looks sustainable.
19. Spanish Fort – 76.9% Home Price Increase Since 2010

- 2010: $224,394
- 2011: $216,219 (−$8,176, −3.64% from previous year)
- 2012: $213,668 (−$2,551, −1.18% from previous year)
- 2013: $227,371 (+$13,703, +6.41% from previous year)
- 2014: $238,606 (+$11,235, +4.94% from previous year)
- 2015: $245,814 (+$7,208, +3.02% from previous year)
- 2016: $252,304 (+$6,490, +2.64% from previous year)
- 2017: $249,251 (−$3,053, −1.21% from previous year)
- 2018: $258,563 (+$9,312, +3.74% from previous year)
- 2019: $267,840 (+$9,276, +3.59% from previous year)
- 2020: $283,688 (+$15,848, +5.92% from previous year)
- 2021: $322,282 (+$38,594, +13.60% from previous year)
- 2022: $379,684 (+$57,402, +17.81% from previous year)
- 2023: $387,068 (+$7,384, +1.94% from previous year)
- 2024: $391,458 (+$4,390, +1.13% from previous year)
- 2025: $397,023 (+$5,566, +1.42% from previous year)
Spanish Fort home values have risen nearly 77% over the past 15 years. The town experienced steady appreciation until 2020, then saw a major spike in 2021 and 2022. Though more modest in recent years, values continue to climb, marking Spanish Fort as a solid long-term growth market.
Spanish Fort – A Bayfront Suburb with Lasting Appeal
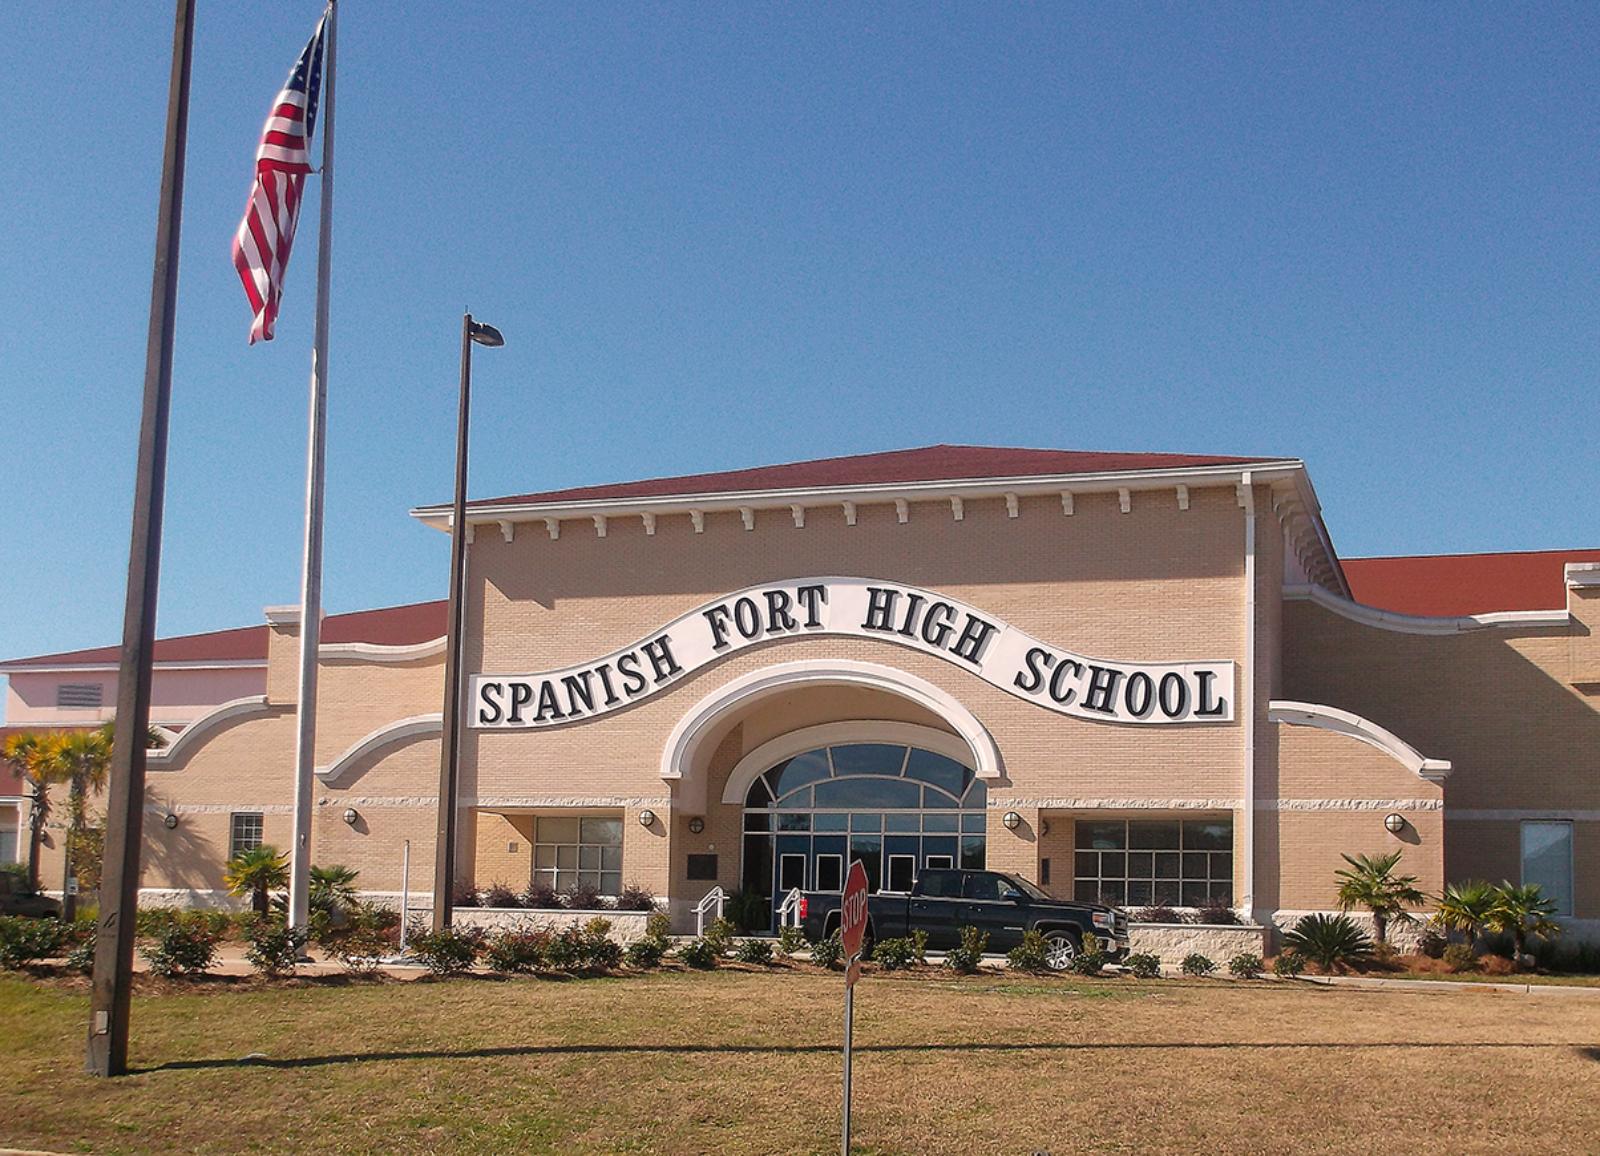
Located on the eastern shore of Mobile Bay, Spanish Fort enjoys a scenic setting with access to both nature and urban amenities. Its location just across the bay from Mobile makes it a desirable option for commuters who want waterfront views and suburban comfort. That dual appeal has kept real estate values rising, especially as more people move southward for coastal living.
Schools, retail development, and proximity to Interstate 10 further strengthen its residential appeal. The jump in values around 2021 was part of a broader Gulf Coast trend, but Spanish Fort has managed to hold those gains while continuing to grow. It’s become one of the most consistent performers in Baldwin County’s competitive housing market.
18. Pike Road – 31.7% Home Price Increase Since 2010

- 2010: $301,483
- 2011: $277,828 (−$23,655, −7.85% from previous year)
- 2012: $261,463 (−$16,365, −5.89% from previous year)
- 2013: $268,866 (+$7,404, +2.83% from previous year)
- 2014: $273,405 (+$4,539, +1.69% from previous year)
- 2015: $276,312 (+$2,907, +1.06% from previous year)
- 2016: $286,744 (+$10,432, +3.78% from previous year)
- 2017: $295,262 (+$8,517, +2.97% from previous year)
- 2018: $297,511 (+$2,249, +0.76% from previous year)
- 2019: $305,377 (+$7,866, +2.64% from previous year)
- 2020: $310,519 (+$5,142, +1.68% from previous year)
- 2021: $336,706 (+$26,187, +8.43% from previous year)
- 2022: $382,027 (+$45,321, +13.46% from previous year)
- 2023: $391,179 (+$9,152, +2.40% from previous year)
- 2024: $392,243 (+$1,064, +0.27% from previous year)
- 2025: $397,177 (+$4,934, +1.26% from previous year)
Home values in Pike Road rose from $301,483 in 2010 to $397,177 in 2025—an overall increase of 31.7%. Most of this appreciation came after 2020, particularly in 2021 and 2022 when buyers flocked to outer suburbs. Earlier years were marked by modest growth, but recent trends have pushed Pike Road into Alabama’s top tier.
Pike Road – A Fast-Growing Suburb Outside Montgomery

Located just outside Montgomery, Pike Road has become a magnet for families and professionals seeking more space and newer homes. As one of the fastest-growing towns in central Alabama, it offers planned communities, good schools, and easy access to I-85. The surge in values during 2021–2022 reflects increased suburban demand in the post-COVID era, especially among buyers looking for a balance between affordability and convenience.
Though it started the decade with slow price movement, Pike Road has recently found its stride. New construction projects have driven inventory and attention, and the town’s emphasis on smart growth and quality-of-life infrastructure is helping maintain demand. If trends continue, Pike Road could solidify its position among Alabama’s most desirable places to live over the next decade.
17. Auburn – 94.1% Home Price Increase Since 2010

- 2010: $208,875
- 2011: $199,750 (−$9,125, −4.37% from previous year)
- 2012: $201,087 (+$1,336, +0.67% from previous year)
- 2013: $207,521 (+$6,434, +3.20% from previous year)
- 2014: $212,683 (+$5,162, +2.49% from previous year)
- 2015: $216,251 (+$3,568, +1.68% from previous year)
- 2016: $229,116 (+$12,864, +5.95% from previous year)
- 2017: $246,993 (+$17,878, +7.80% from previous year)
- 2018: $262,337 (+$15,343, +6.21% from previous year)
- 2019: $279,939 (+$17,602, +6.71% from previous year)
- 2020: $288,238 (+$8,299, +2.96% from previous year)
- 2021: $317,276 (+$29,038, +10.07% from previous year)
- 2022: $357,572 (+$40,296, +12.70% from previous year)
- 2023: $375,149 (+$17,577, +4.92% from previous year)
- 2024: $394,076 (+$18,927, +5.05% from previous year)
- 2025: $405,418 (+$11,342, +2.88% from previous year)
Auburn’s home values have nearly doubled since 2010, surging from $208,875 to $405,418 by 2025. While it showed consistent growth throughout the decade, the most significant gains came between 2020 and 2022—reflecting national trends and renewed interest in university towns.
Auburn – Booming Real Estate in a College Town

Home to Auburn University, this college town blends academic prestige with small-town charm. The university has acted as an economic anchor, attracting faculty, students, and investors alike. New developments, especially in the outer edges of town, have expanded Auburn’s housing stock, while still keeping prices on the rise due to strong demand.
Auburn offers more than academics—it has a thriving downtown, green spaces, and excellent public schools. That makes it attractive not only to students, but also to retirees and professionals. The housing market has benefited from this broad appeal, especially as remote workers and investors look beyond big cities for stable, high-quality communities.
16. Owens Cross Roads – 177.9% Home Price Increase Since 2010

- 2010: $155,705
- 2011: $183,960 (+$28,255, +18.15% from previous year)
- 2012: $184,990 (+$1,030, +0.56% from previous year)
- 2013: $260,205 (+$75,214, +40.66% from previous year)
- 2014: $261,960 (+$1,756, +0.67% from previous year)
- 2015: $257,974 (−$3,986, −1.52% from previous year)
- 2016: $257,212 (−$763, −0.30% from previous year)
- 2017: $264,178 (+$6,966, +2.71% from previous year)
- 2018: $271,115 (+$6,937, +2.63% from previous year)
- 2019: $280,215 (+$9,101, +3.36% from previous year)
- 2020: $300,797 (+$20,582, +7.34% from previous year)
- 2021: $361,591 (+$60,793, +20.21% from previous year)
- 2022: $432,481 (+$70,890, +19.61% from previous year)
- 2023: $431,897 (−$584, −0.13% from previous year)
- 2024: $425,585 (−$6,312, −1.46% from previous year)
- 2025: $432,817 (+$7,232, +1.70% from previous year)
Owens Cross Roads saw one of the largest percentage gains in the state, with a 177.9% increase in home values from 2010 to 2025. Prices surged particularly hard in 2013 and again in 2021–2022, positioning this once-overlooked town as a real estate standout in northern Alabama.
Owens Cross Roads – Explosive Growth Near Huntsville
Located just southeast of Huntsville, Owens Cross Roads has transformed from a quiet rural town into a fast-developing suburb. Its location in the rapidly expanding Madison County metro has made it a prime candidate for new subdivisions and upscale housing developments. Major price spikes—particularly the one in 2013—reflect waves of incoming buyers responding to Huntsville’s tech-driven economic boom.
Despite some dips after 2022, prices have remained elevated, showing long-term resilience. With access to nature, schools, and jobs in one of Alabama’s strongest employment markets, the town is likely to see continued interest. For buyers looking to stay near Huntsville while enjoying more space and newer homes, Owens Cross Roads continues to hit the mark.
15. Hoover – 67.2% Home Price Increase Since 2010

- 2010: $259,638
- 2011: $248,395 (−$11,243, −4.33% from previous year)
- 2012: $243,664 (−$4,732, −1.90% from previous year)
- 2013: $252,542 (+$8,878, +3.64% from previous year)
- 2014: $263,314 (+$10,773, +4.27% from previous year)
- 2015: $269,193 (+$5,879, +2.23% from previous year)
- 2016: $279,829 (+$10,636, +3.95% from previous year)
- 2017: $287,263 (+$7,434, +2.66% from previous year)
- 2018: $296,886 (+$9,623, +3.35% from previous year)
- 2019: $311,141 (+$14,255, +4.80% from previous year)
- 2020: $323,999 (+$12,858, +4.13% from previous year)
- 2021: $362,412 (+$38,413, +11.86% from previous year)
- 2022: $415,015 (+$52,603, +14.51% from previous year)
- 2023: $421,308 (+$6,293, +1.52% from previous year)
- 2024: $432,881 (+$11,573, +2.75% from previous year)
- 2025: $434,236 (+$1,355, +0.31% from previous year)
From 2010 to 2025, Hoover’s home values increased 67.2%, reaching $434,236. This growth was gradual and stable through most of the decade, followed by a strong double-digit boost between 2020 and 2022. More recent years suggest market stabilization at high values.
Hoover – Birmingham’s Anchor Suburb
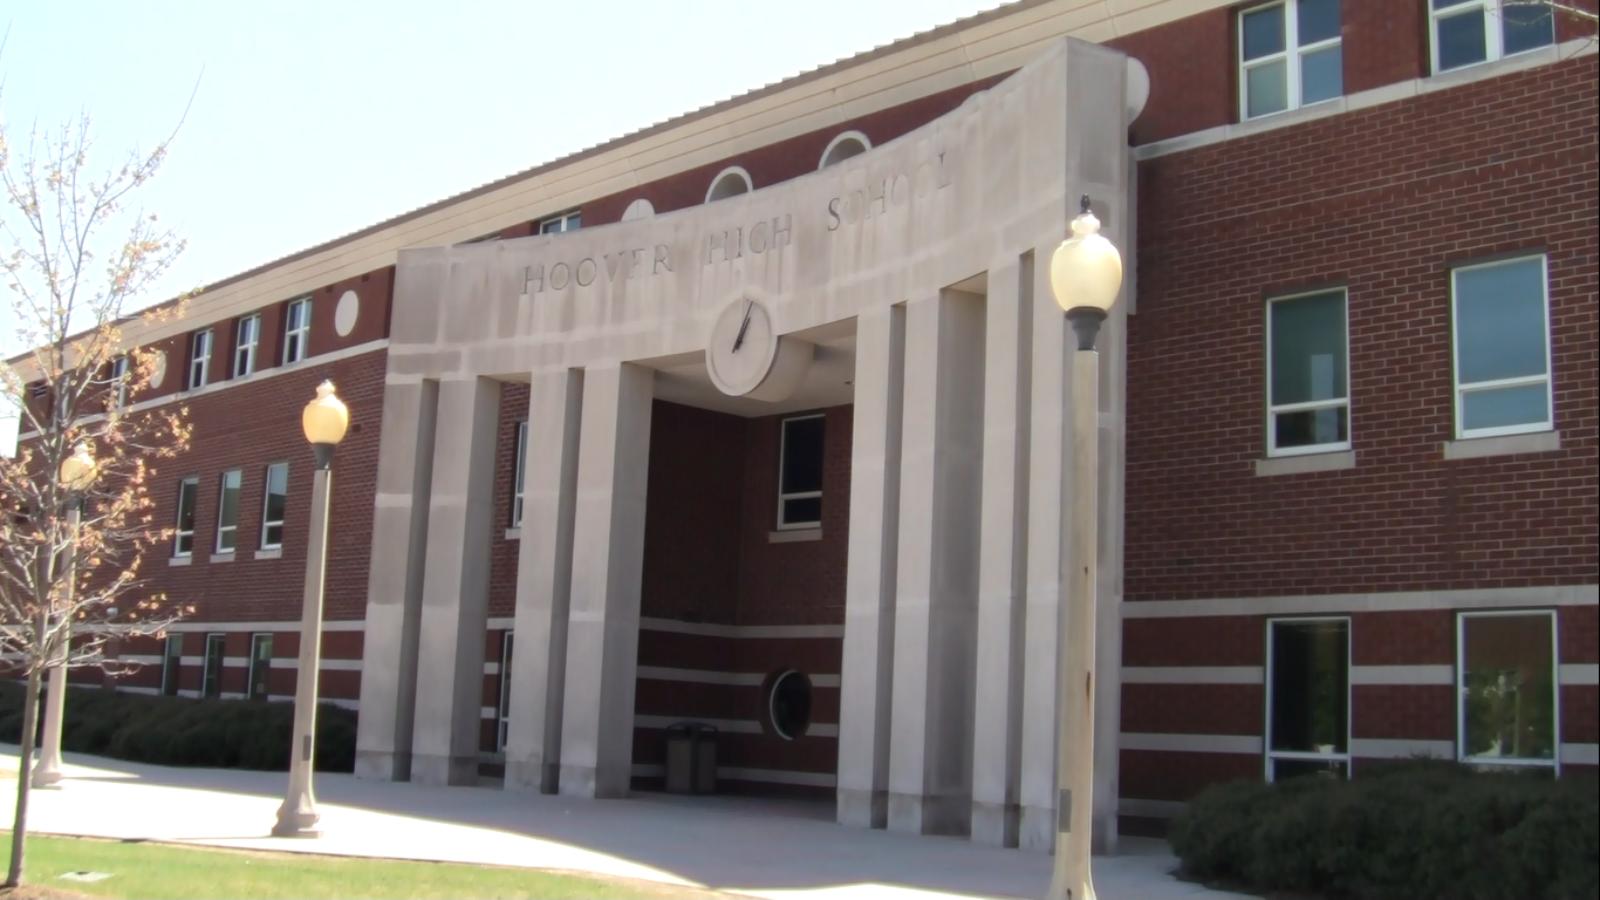
As one of Alabama’s largest cities, Hoover offers a full range of urban conveniences with a suburban feel. It’s home to major employers, top schools, and large shopping destinations like the Riverchase Galleria. This balance of work, education, and entertainment keeps Hoover’s real estate market competitive year after year.
The city’s infrastructure, parks, and proximity to Birmingham make it a long-term favorite among families and professionals. Hoover’s housing values reflect both its economic strength and its broad appeal, and its modest but steady recent growth hints at continued demand without overheating.
14. Arley – 73.8% Home Price Increase Since 2010

- 2010: $259,825
- 2011: $252,832 (−$6,993, −2.69% from previous year)
- 2012: $252,238 (−$594, −0.23% from previous year)
- 2013: $249,527 (−$2,711, −1.07% from previous year)
- 2014: $244,120 (−$5,408, −2.17% from previous year)
- 2015: $235,987 (−$8,133, −3.33% from previous year)
- 2016: $243,702 (+$7,715, +3.27% from previous year)
- 2017: $265,436 (+$21,735, +8.92% from previous year)
- 2018: $273,071 (+$7,635, +2.88% from previous year)
- 2019: $279,394 (+$6,323, +2.32% from previous year)
- 2020: $294,112 (+$14,718, +5.27% from previous year)
- 2021: $360,476 (+$66,365, +22.56% from previous year)
- 2022: $415,748 (+$55,272, +15.33% from previous year)
- 2023: $420,684 (+$4,935, +1.19% from previous year)
- 2024: $431,855 (+$11,171, +2.66% from previous year)
- 2025: $451,616 (+$19,761, +4.58% from previous year)
Home prices in Arley have climbed 73.8% from $259,825 in 2010 to $451,616 in 2025. Although the town experienced several years of decline early in the decade, it saw explosive growth beginning in 2017 and especially during 2021 and 2022. Recent years have continued to push prices upward at a healthy pace.
Arley – Lakefront Living and Rapid Turnaround

Arley is nestled along the shores of Smith Lake in Winston County, making it one of Alabama’s most scenic small towns. The community’s connection to outdoor recreation, boating, and waterfront views has increasingly attracted both full-time residents and vacation home buyers. While home prices were stagnant or declining in the early 2010s, Arley’s trajectory shifted significantly after 2016, with rising demand for lake property driving consistent appreciation. Much of this turnaround is tied to changing lifestyle preferences, particularly as more people have sought out peaceful, rural escapes within reach of major cities like Birmingham and Huntsville.
During the 2021 housing boom, Arley experienced some of the sharpest price gains in the state. This was driven in part by the limited supply of lakefront homes and the influx of out-of-state buyers seeking second homes or investment properties. Despite its small population, Arley has proven that location and natural amenities can outweigh size in determining real estate value. The steady upward movement since the pandemic suggests sustained interest from both retirees and remote workers. With continued demand for water access and scenic retreats, Arley’s position among Alabama’s most expensive towns looks increasingly secure.
13. Gulf Shores – 113.1% Home Price Increase Since 2010

- 2010: $217,630
- 2011: $200,380 (−$17,250, −7.93% from previous year)
- 2012: $203,457 (+$3,077, +1.54% from previous year)
- 2013: $221,586 (+$18,129, +8.91% from previous year)
- 2014: $231,653 (+$10,067, +4.54% from previous year)
- 2015: $243,571 (+$11,917, +5.14% from previous year)
- 2016: $261,085 (+$17,514, +7.19% from previous year)
- 2017: $271,807 (+$10,722, +4.11% from previous year)
- 2018: $290,416 (+$18,609, +6.85% from previous year)
- 2019: $310,658 (+$20,242, +6.97% from previous year)
- 2020: $331,442 (+$20,784, +6.69% from previous year)
- 2021: $393,458 (+$62,016, +18.71% from previous year)
- 2022: $479,778 (+$86,320, +21.94% from previous year)
- 2023: $485,329 (+$5,551, +1.16% from previous year)
- 2024: $477,646 (−$7,683, −1.58% from previous year)
- 2025: $463,861 (−$13,785, −2.89% from previous year)
Home values in Gulf Shores more than doubled between 2010 and 2025, increasing by 113.1%. Much of this growth occurred between 2015 and 2022, with massive jumps in the early 2020s. Although prices have declined slightly in the past two years, the town remains one of Alabama’s most valuable coastal markets.
Gulf Shores – Alabama’s Beachfront Powerhouse
Gulf Shores is a major destination for tourists and investors alike, sitting at the heart of Alabama’s Gulf Coast. Known for its white sand beaches, warm waters, and lively boardwalk, the town attracts millions of visitors annually. This consistent foot traffic has created a robust short-term rental market, with condos and vacation homes driving demand. As tourism infrastructure expanded over the last decade, so too did the appeal for investors looking to capitalize on rising rental income and long-term appreciation. From high-rise oceanfront units to beach cottages, real estate in Gulf Shores carries a coastal premium that has pushed it into the state’s top-tier price bracket.
The pandemic only accelerated interest in the area as remote workers and vacationers sought out beach towns with open space and flexibility. This shift led to extraordinary price jumps in 2021 and 2022—making Gulf Shores one of the fastest appreciating towns during that period. While prices have recently dipped slightly, the overall trend remains strong, thanks to sustained tourism, limited buildable land, and steady year-round demand. Continued investment in walkable retail, dining, and entertainment options ensures Gulf Shores will remain a competitive and resilient market well into the future.
12. Dauphin Island – 53.5% Home Price Increase Since 2010

- 2010: $312,938
- 2011: $250,892 (−$62,046, −19.83% from previous year)
- 2012: $218,704 (−$32,188, −12.83% from previous year)
- 2013: $203,271 (−$15,433, −7.06% from previous year)
- 2014: $215,123 (+$11,851, +5.83% from previous year)
- 2015: $221,615 (+$6,493, +3.02% from previous year)
- 2016: $229,472 (+$7,857, +3.55% from previous year)
- 2017: $249,641 (+$20,169, +8.79% from previous year)
- 2018: $276,512 (+$26,871, +10.76% from previous year)
- 2019: $298,081 (+$21,568, +7.80% from previous year)
- 2020: $325,455 (+$27,374, +9.18% from previous year)
- 2021: $383,832 (+$58,377, +17.94% from previous year)
- 2022: $477,735 (+$93,903, +24.46% from previous year)
- 2023: $490,656 (+$12,921, +2.70% from previous year)
- 2024: $490,536 (−$120, −0.02% from previous year)
- 2025: $480,477 (−$10,058, −2.05% from previous year)
From 2010 to 2025, Dauphin Island home values increased 53.5%, peaking in 2022 before slightly declining. After a major correction early in the decade, the town rebounded dramatically, with huge gains from 2017 to 2022. Despite modest losses recently, property values remain among the highest in the state.
Dauphin Island – A Remote Beach Market With Big Swings
Dauphin Island offers something rare in Alabama—true island living. Accessible by bridge or ferry, this barrier island features some of the state’s most remote and serene beachfront properties. Unlike more commercialized areas like Gulf Shores, Dauphin Island remains relatively low-density, with fewer high-rises and more residential homes lining the beach and bay. That exclusivity comes at a price. After bottoming out in the early 2010s, demand started picking up as remote work enabled more people to live where they play. Prices soared, particularly in 2021 and 2022, driven by buyers looking for waterfront property with privacy and charm.
Although home values have softened slightly since their 2022 peak, Dauphin Island’s market remains resilient due to limited inventory and strict development guidelines. The island’s natural beauty, including bird sanctuaries, sea turtle nesting areas, and white sand beaches, gives it strong appeal for environmentally minded buyers. While weather and insurance concerns can temper investment, many see Dauphin Island as a long-term coastal gem that delivers both lifestyle and investment value. Continued interest in low-density waterfront escapes should support its home prices in the years to come.
11. Fairhope – 108.5% Home Price Increase Since 2010

- 2010: $233,627
- 2011: $216,915 (−$16,712, −7.15% from previous year)
- 2012: $211,095 (−$5,821, −2.68% from previous year)
- 2013: $226,863 (+$15,768, +7.47% from previous year)
- 2014: $238,288 (+$11,426, +5.04% from previous year)
- 2015: $252,037 (+$13,749, +5.77% from previous year)
- 2016: $266,614 (+$14,577, +5.78% from previous year)
- 2017: $279,518 (+$12,904, +4.84% from previous year)
- 2018: $295,786 (+$16,267, +5.82% from previous year)
- 2019: $309,585 (+$13,799, +4.67% from previous year)
- 2020: $333,127 (+$23,542, +7.60% from previous year)
- 2021: $390,409 (+$57,282, +17.20% from previous year)
- 2022: $452,422 (+$62,014, +15.88% from previous year)
- 2023: $472,312 (+$19,890, +4.40% from previous year)
- 2024: $480,358 (+$8,046, +1.70% from previous year)
- 2025: $487,152 (+$6,794, +1.41% from previous year)
Home values in Fairhope more than doubled between 2010 and 2025, increasing by 108.5%. The town experienced steady gains throughout the decade, followed by a sharp spike from 2020 to 2022. While appreciation has slowed recently, Fairhope remains one of Alabama’s strongest-performing housing markets.
Fairhope – Coastal Sophistication and Steady Demand
Fairhope is often considered one of the most picturesque towns in Alabama, perched along Mobile Bay with charming streets, waterfront parks, and a vibrant downtown core. Its artistic roots and historic architecture give it a unique identity that attracts both retirees and young families alike. The town has become synonymous with quality of life—offering excellent public schools, a thriving restaurant and arts scene, and access to boating and bayfront recreation. These lifestyle factors have created a durable and consistent demand for homes, especially among buyers relocating from larger metro areas in Alabama, Mississippi, and Florida.
Over the past few years, Fairhope’s housing market benefited immensely from pandemic-era migration. People looking for small-town charm with modern amenities zeroed in on places like Fairhope, where walkability, outdoor space, and community feel remain central. The post-2020 surge was particularly dramatic, and while price growth has eased, values have held strong. Strict zoning rules and limited space for sprawl also help protect long-term price stability. As one of Baldwin County’s most desirable towns, Fairhope is likely to remain a top-tier real estate destination well into the future, combining Southern charm with Gulf Coast elegance.
10. Lake Purdy – 76.2% Home Price Increase Since 2010

- 2010: $279,024
- 2011: $266,085 (−$12,939, −4.64% from previous year)
- 2012: $271,388 (+$5,303, +1.99% from previous year)
- 2013: $291,764 (+$20,376, +7.51% from previous year)
- 2014: $301,754 (+$9,990, +3.42% from previous year)
- 2015: $309,332 (+$7,578, +2.51% from previous year)
- 2016: $317,933 (+$8,600, +2.78% from previous year)
- 2017: $323,869 (+$5,936, +1.87% from previous year)
- 2018: $334,677 (+$10,808, +3.34% from previous year)
- 2019: $348,753 (+$14,075, +4.21% from previous year)
- 2020: $362,960 (+$14,208, +4.07% from previous year)
- 2021: $409,238 (+$46,278, +12.75% from previous year)
- 2022: $472,927 (+$63,689, +15.56% from previous year)
- 2023: $473,960 (+$1,033, +0.22% from previous year)
- 2024: $485,975 (+$12,015, +2.54% from previous year)
- 2025: $491,409 (+$5,434, +1.12% from previous year)
Lake Purdy’s home values rose from $279,024 in 2010 to $491,409 in 2025—a 76.2% increase. While early growth was slow and steady, the 2021–2022 boom lifted the town to a new pricing tier. Since then, values have held strong, reflecting high demand and limited supply.
Lake Purdy – A Hidden Residential Pocket With Lasting Appeal

Located on the southeastern edge of the Birmingham metro, Lake Purdy is an unincorporated but highly desirable residential area known for its natural beauty and proximity to major employment centers. The nearby reservoir and surrounding woodlands make it a magnet for buyers seeking quiet neighborhoods with easy access to Highway 280 and downtown Birmingham. Despite its lack of official town status, the community has gained a reputation for stability, offering spacious lots, custom homes, and a suburban-rural blend that appeals to both young families and retirees. The area’s limited commercial development helps preserve its peaceful character, which in turn sustains long-term demand for housing.
Lake Purdy’s sharp price increases in 2021 and 2022 align with broader suburban trends, where buyers sought refuge from urban density without compromising on connectivity. As work-from-home lifestyles took hold, the area’s balance of nature and accessibility became a huge draw. Since then, prices have stabilized but remained high, suggesting strong buyer confidence in the area’s value. The region’s steady development and proximity to top-rated schools and retail corridors bolster its appeal. With more people looking to escape into nature without fully leaving the metro, Lake Purdy offers a rare combination of privacy, convenience, and long-term real estate upside.
9. Crane Hill – 111.8% Home Price Increase Since 2010

- 2010: $233,476
- 2011: $226,686 (−$6,790, −2.91% from previous year)
- 2012: $233,335 (+$6,649, +2.93% from previous year)
- 2013: $235,729 (+$2,394, +1.03% from previous year)
- 2014: $249,967 (+$14,238, +6.04% from previous year)
- 2015: $259,000 (+$9,033, +3.61% from previous year)
- 2016: $273,393 (+$14,394, +5.56% from previous year)
- 2017: $289,212 (+$15,819, +5.79% from previous year)
- 2018: $305,938 (+$16,725, +5.78% from previous year)
- 2019: $298,629 (−$7,309, −2.39% from previous year)
- 2020: $314,588 (+$15,959, +5.34% from previous year)
- 2021: $386,016 (+$71,428, +22.71% from previous year)
- 2022: $463,322 (+$77,306, +20.03% from previous year)
- 2023: $439,438 (−$23,884, −5.16% from previous year)
- 2024: $465,007 (+$25,570, +5.82% from previous year)
- 2025: $494,506 (+$29,498, +6.34% from previous year)
Crane Hill’s home prices jumped from $233,476 in 2010 to $494,506 in 2025, a remarkable 111.8% increase. Most of this growth occurred after 2015, with particularly large gains in 2021 and 2022. Although the market corrected briefly in 2023, it bounced back quickly with strong growth into 2025.
Crane Hill – Smith Lake’s Luxury Lakeside Contender

Crane Hill, situated along the shores of Lewis Smith Lake, has evolved into one of Alabama’s premier lakefront real estate destinations. The town offers seclusion, water access, and high-end properties that attract both weekenders and full-time residents. Known for deep, clean waters and dramatic shoreline views, Smith Lake has increasingly drawn second-home buyers from Birmingham, Atlanta, and Nashville. As a result, Crane Hill has witnessed a boom in custom construction and luxury developments, particularly post-2015. The area’s appeal is amplified by limited commercial intrusion and its emphasis on preserving natural surroundings, giving it lasting investment value.
The massive surge in values during 2021 and 2022 reflects a broader trend of pandemic-driven migration to recreational markets. Crane Hill was uniquely positioned to benefit thanks to its upscale home offerings and low-density layout. Even though 2023 brought a modest dip, the rebound in 2024 and 2025 shows that interest in lake living remains high. With boating, fishing, and quiet luxury as key selling points, the town continues to attract high-income buyers seeking retreat and recreation. As demand for waterfront homes continues to rise, Crane Hill stands out as one of the strongest-performing non-coastal housing markets in Alabama.
8. Dadeville – 121.9% Home Price Increase Since 2010

- 2010: $234,183
- 2011: $228,444 (−$5,740, −2.45% from previous year)
- 2012: $234,487 (+$6,044, +2.65% from previous year)
- 2013: $241,885 (+$7,398, +3.15% from previous year)
- 2014: $245,232 (+$3,347, +1.38% from previous year)
- 2015: $253,340 (+$8,107, +3.31% from previous year)
- 2016: $268,926 (+$15,586, +6.15% from previous year)
- 2017: $289,552 (+$20,626, +7.67% from previous year)
- 2018: $306,490 (+$16,938, +5.85% from previous year)
- 2019: $323,090 (+$16,600, +5.42% from previous year)
- 2020: $342,863 (+$19,773, +6.12% from previous year)
- 2021: $420,229 (+$77,366, +22.56% from previous year)
- 2022: $517,162 (+$96,933, +23.07% from previous year)
- 2023: $497,984 (−$19,178, −3.71% from previous year)
- 2024: $510,181 (+$12,197, +2.45% from previous year)
- 2025: $519,825 (+$9,644, +1.89% from previous year)
Dadeville home prices have soared by 121.9% since 2010, rising from $234,183 to $519,825 in 2025. Growth was steady throughout the 2010s, with explosive gains during 2021 and 2022. While 2023 saw a slight dip, values have recovered and remain near all-time highs.
Dadeville – Lake Martin’s Rising Star

Dadeville is one of several towns that benefit from proximity to Lake Martin, one of the largest manmade lakes in the country. The town has quietly become a haven for second-home buyers and retirees looking for lakeside peace with access to upscale marinas, resorts, and golf courses. Real estate development around Lake Martin has intensified in the last decade, especially as affluent buyers from Montgomery, Birmingham, and Atlanta have looked to escape city life for scenic waterfront living. Dadeville’s early price growth was slow but stable, setting the stage for massive gains in the early 2020s as demand spiked during the pandemic-fueled buying frenzy.
Unlike some lake towns that cater solely to vacationers, Dadeville maintains a year-round community and an emerging commercial corridor that adds long-term livability. Developers have taken notice, fueling construction of new subdivisions and lake-access neighborhoods. The town’s 2023 market dip reflected broader economic uncertainty, but its quick rebound in 2024 and 2025 shows just how tight supply remains. As Lake Martin continues to rise in national prominence—particularly for luxury second homes—Dadeville is positioned to remain one of the highest-value communities in central Alabama. Its blend of recreation, lifestyle, and relative affordability continues to attract long-term residents and investors alike.
7. Homewood – 104.3% Home Price Increase Since 2010

- 2010: $269,241
- 2011: $254,817 (−$14,425, −5.36% from previous year)
- 2012: $252,330 (−$2,487, −0.98% from previous year)
- 2013: $267,090 (+$14,760, +5.85% from previous year)
- 2014: $283,799 (+$16,709, +6.26% from previous year)
- 2015: $302,748 (+$18,949, +6.68% from previous year)
- 2016: $331,631 (+$28,883, +9.54% from previous year)
- 2017: $356,352 (+$24,721, +7.45% from previous year)
- 2018: $374,709 (+$18,357, +5.15% from previous year)
- 2019: $395,811 (+$21,102, +5.63% from previous year)
- 2020: $425,058 (+$29,246, +7.39% from previous year)
- 2021: $477,392 (+$52,334, +12.31% from previous year)
- 2022: $521,239 (+$43,847, +9.18% from previous year)
- 2023: $535,848 (+$14,610, +2.80% from previous year)
- 2024: $533,438 (−$2,410, −0.45% from previous year)
- 2025: $550,124 (+$16,685, +3.13% from previous year)
Homewood’s home values more than doubled from 2010 to 2025, climbing 104.3%. Steady growth through the 2010s turned into a boom by 2020, with peak gains in 2021 and 2022. Though prices plateaued in 2024, they rebounded again in 2025, keeping the town firmly in Alabama’s top tier.
Homewood – Urban Convenience With Historic Charm
Located just south of downtown Birmingham, Homewood blends the feel of a traditional neighborhood with the energy of a growing urban hub. Its walkable downtown, highly rated schools, and tight-knit neighborhoods make it one of the most desirable places to live in central Alabama. Over the last decade, the town has seen a surge of interest from families, young professionals, and investors alike. Bungalows and craftsman-style homes have appreciated quickly, and new infill developments have added modern townhomes and condos to the mix. While Homewood isn’t the largest suburb, its mix of architecture, culture, and proximity to Birmingham make it one of the most competitive markets in the state.
The sharp appreciation in the early 2020s was driven by limited inventory and increasing demand for close-in, walkable communities. Many buyers seeking a blend of convenience and character found exactly that in Homewood’s tree-lined streets and commercial districts. While prices momentarily dipped in 2024, the town quickly bounced back—thanks in part to continued investment in infrastructure and community amenities. The popularity of Edgewood and Soho districts, combined with a strong rental market, has made Homewood both a great place to live and a solid investment. As long as the demand for high-quality, centrally located housing stays strong, Homewood is likely to remain near the top of Alabama’s price rankings.
6. Vestavia Hills – 71.8% Home Price Increase Since 2010

- 2010: $321,000
- 2011: $307,309 (−$13,691, −4.26% from previous year)
- 2012: $294,330 (−$12,980, −4.22% from previous year)
- 2013: $310,883 (+$16,553, +5.62% from previous year)
- 2014: $320,095 (+$9,212, +2.96% from previous year)
- 2015: $333,706 (+$13,611, +4.25% from previous year)
- 2016: $350,848 (+$17,142, +5.14% from previous year)
- 2017: $367,492 (+$16,644, +4.74% from previous year)
- 2018: $379,200 (+$11,708, +3.19% from previous year)
- 2019: $399,973 (+$20,773, +5.48% from previous year)
- 2020: $412,352 (+$12,379, +3.10% from previous year)
- 2021: $458,678 (+$46,326, +11.23% from previous year)
- 2022: $513,665 (+$54,987, +11.99% from previous year)
- 2023: $527,584 (+$13,919, +2.71% from previous year)
- 2024: $541,655 (+$14,071, +2.67% from previous year)
- 2025: $551,703 (+$10,048, +1.86% from previous year)
Vestavia Hills home values rose from $321,000 in 2010 to $551,703 in 2025, marking a 71.8% increase. Prices remained steady for most of the decade before taking off in 2021 and 2022. Growth has cooled in recent years but remains firmly positive.
Vestavia Hills – Upscale Living in the Birmingham Hills
Vestavia Hills is widely considered one of the most affluent and well-established suburbs of Birmingham. Perched along the ridgeline just south of the city, the town is known for its panoramic views, large custom homes, and strong public schools. Its real estate market has long been stable, with high demand from executives, doctors, and professionals who commute to downtown or nearby UAB. While growth was moderate in the early 2010s, the housing boom of the early 2020s brought renewed energy to the market. New subdivisions and luxury infill projects helped fuel appreciation, while existing homes gained value due to location and school district quality.
Despite its already high price point, Vestavia Hills still saw double-digit growth during the housing surge, suggesting deep market confidence. The town’s amenities, including country clubs, shopping centers, and proximity to both Highway 280 and I-65, make it an ideal location for high-income buyers. Even with slower growth in the past couple of years, Vestavia has shown resilience, with consistent year-over-year increases. As demand for top-tier suburbs continues to grow, Vestavia Hills remains a benchmark for premium living in central Alabama—and a town where values are likely to keep climbing in the long term.
5. Indian Springs Village – 105.6% Home Price Increase Since 2010

- 2010: $282,766
- 2011: $270,561 (−$12,205, −4.32% from previous year)
- 2012: $270,021 (−$540, −0.20% from previous year)
- 2013: $286,788 (+$16,768, +6.21% from previous year)
- 2014: $307,474 (+$20,686, +7.21% from previous year)
- 2015: $325,754 (+$18,279, +5.95% from previous year)
- 2016: $341,442 (+$15,688, +4.82% from previous year)
- 2017: $358,174 (+$16,732, +4.90% from previous year)
- 2018: $375,081 (+$16,907, +4.72% from previous year)
- 2019: $393,279 (+$18,199, +4.85% from previous year)
- 2020: $420,600 (+$27,321, +6.95% from previous year)
- 2021: $473,116 (+$52,516, +12.49% from previous year)
- 2022: $540,065 (+$66,948, +14.15% from previous year)
- 2023: $527,645 (−$12,420, −2.30% from previous year)
- 2024: $565,653 (+$38,008, +7.20% from previous year)
- 2025: $581,261 (+$15,608, +2.76% from previous year)
Indian Springs Village more than doubled its home values from $282,766 in 2010 to $581,261 in 2025. Prices rose steadily until 2020, then accelerated sharply. After a brief decline in 2023, the market rebounded strongly and finished at an all-time high.
Indian Springs Village – Rural Prestige in Shelby County

Indian Springs Village offers a rare blend of rural seclusion and suburban convenience, making it one of Shelby County’s most exclusive enclaves. With large lots, wooded privacy, and strict zoning regulations, the town has long appealed to high-net-worth buyers looking to escape city congestion without sacrificing access to Birmingham. Its residential zoning discourages commercial development, preserving a quiet, estate-like atmosphere. That combination has made the area a haven for custom homes, horse farms, and sprawling wooded properties, particularly along Cahaba Valley Road. Throughout the 2010s, demand remained consistent, but the post-2020 housing boom elevated Indian Springs into Alabama’s elite tier of home values.
While some suburban markets have cooled, Indian Springs saw a sharp rebound in 2024 and 2025—driven by renewed interest in privacy, acreage, and semi-rural luxury. The town’s location just minutes from Highway 280, Oak Mountain State Park, and top-rated private schools further enhances its long-term desirability. With limited land available for future development, inventory remains tight, which has helped prices sustain upward pressure. Buyers seeking tranquility with quick access to city amenities find Indian Springs an ideal option. As remote work and lifestyle shifts continue to shape buying behavior, Indian Springs is poised to remain one of the most sought-after addresses in central Alabama.
4. Jacksons Gap – 156.5% Home Price Increase Since 2010

- 2010: $231,621
- 2011: $229,130 (−$2,491, −1.08% from previous year)
- 2012: $233,958 (+$4,829, +2.11% from previous year)
- 2013: $236,463 (+$2,505, +1.07% from previous year)
- 2014: $252,461 (+$15,998, +6.77% from previous year)
- 2015: $275,485 (+$23,024, +9.12% from previous year)
- 2016: $283,065 (+$7,580, +2.75% from previous year)
- 2017: $299,680 (+$16,615, +5.87% from previous year)
- 2018: $324,372 (+$24,692, +8.24% from previous year)
- 2019: $347,010 (+$22,639, +6.98% from previous year)
- 2020: $373,856 (+$26,845, +7.74% from previous year)
- 2021: $455,637 (+$81,781, +21.88% from previous year)
- 2022: $558,155 (+$102,518, +22.50% from previous year)
- 2023: $562,906 (+$4,750, +0.85% from previous year)
- 2024: $609,753 (+$46,847, +8.32% from previous year)
- 2025: $594,096 (−$15,657, −2.57% from previous year)
Jacksons Gap saw home values rise from $231,621 in 2010 to $594,096 in 2025—an increase of 156.5%. While most of the growth occurred after 2015, the town had two major surges in 2021 and 2022. Though prices dipped slightly in 2025, values remain significantly elevated.
Jacksons Gap – The Lake Martin Surge Continues

Situated on the northern edge of Lake Martin, Jacksons Gap has evolved from a quiet lakeside retreat into one of the state’s top growth markets. Its affordability, scenic beauty, and proximity to deep-water coves have drawn steady attention from both retirees and out-of-state investors. Much of the area’s housing stock consists of second homes and vacation rentals, but recent years have seen more full-time residents attracted to the natural setting and rising infrastructure. The town’s boom in 2021 and 2022 coincided with skyrocketing demand for lakefront real estate, particularly among remote workers and families exiting urban environments in search of space and leisure.
Even after a slight retreat in 2025, Jacksons Gap remains one of the most sought-after addresses on Lake Martin. New developments and marina expansions have helped fuel demand, while nearby towns like Dadeville and Alexander City provide access to grocery stores, schools, and services. With lakefront property becoming harder to find across the Southeast, Jacksons Gap stands out for offering premium amenities without the sky-high prices seen in other resort towns. Its strong appreciation reflects both the appeal of lake life and the strategic position it holds in Alabama’s growing leisure property market.
3. Equality – 128.9% Home Price Increase Since 2010

- 2010: $281,217
- 2011: $287,262 (+$6,044, +2.15% from previous year)
- 2012: $292,250 (+$4,989, +1.74% from previous year)
- 2013: $296,560 (+$4,309, +1.47% from previous year)
- 2014: $310,360 (+$13,800, +4.65% from previous year)
- 2015: $324,828 (+$14,468, +4.66% from previous year)
- 2016: $329,030 (+$4,202, +1.29% from previous year)
- 2017: $337,445 (+$8,415, +2.56% from previous year)
- 2018: $352,992 (+$15,547, +4.61% from previous year)
- 2019: $361,255 (+$8,263, +2.34% from previous year)
- 2020: $372,487 (+$11,231, +3.11% from previous year)
- 2021: $444,162 (+$71,676, +19.24% from previous year)
- 2022: $510,556 (+$66,394, +14.95% from previous year)
- 2023: $526,435 (+$15,879, +3.11% from previous year)
- 2024: $604,534 (+$78,099, +14.84% from previous year)
- 2025: $643,792 (+$39,259, +6.49% from previous year)
Home values in Equality rose from $281,217 in 2010 to $643,792 in 2025—an astonishing 128.9% increase. Though the town saw modest gains for many years, price growth exploded after 2020, particularly in 2021, 2022, and 2024.
Equality – Big Lake Homes and Bigger Gains

Equality sits in Elmore County near the western banks of Lake Martin, offering a mix of rustic charm and premium waterfront real estate. For years it flew under the radar compared to flashier destinations around the lake, but that quiet reputation has shifted dramatically in recent years. Equality’s expansive lots, mature trees, and increasing lake access have made it a go-to choice for second-home buyers and retirees seeking value and privacy. The surge in remote work has also brought full-time residents looking for tranquility with the added bonus of boating, fishing, and lake recreation just steps from home.
Recent price increases have been driven by both organic demand and limited inventory, with buyers competing for fewer and fewer listings. The area’s blend of natural beauty, larger properties, and limited commercial intrusion has made it especially attractive to those prioritizing lifestyle over location. And while it may lack the dense development of some resort towns, Equality’s appeal lies in its spacious feel and relaxed environment. As Lake Martin continues to grow in popularity, towns like Equality—where buyers still see upside potential—are gaining momentum. Expect this once-overlooked area to remain a serious player in Alabama’s high-end housing scene.
2. Orange Beach – 104.8% Home Price Increase Since 2010

- 2010: $338,047
- 2011: $307,023 (−$31,024, −9.18% from previous year)
- 2012: $318,154 (+$11,132, +3.63% from previous year)
- 2013: $344,115 (+$25,961, +8.16% from previous year)
- 2014: $358,315 (+$14,200, +4.13% from previous year)
- 2015: $377,062 (+$18,747, +5.23% from previous year)
- 2016: $401,031 (+$23,969, +6.36% from previous year)
- 2017: $403,019 (+$1,988, +0.50% from previous year)
- 2018: $421,989 (+$18,971, +4.71% from previous year)
- 2019: $445,971 (+$23,982, +5.68% from previous year)
- 2020: $481,522 (+$35,551, +7.97% from previous year)
- 2021: $577,950 (+$96,428, +20.03% from previous year)
- 2022: $716,845 (+$138,895, +24.03% from previous year)
- 2023: $718,219 (+$1,375, +0.19% from previous year)
- 2024: $710,619 (−$7,600, −1.06% from previous year)
- 2025: $692,241 (−$18,378, −2.59% from previous year)
Orange Beach home values climbed from $338,047 in 2010 to $692,241 in 2025—an impressive 104.8% increase. Most of the gains occurred between 2015 and 2022, particularly in 2021 and 2022. Prices have cooled slightly since, but remain among the highest in Alabama.
Orange Beach – Alabama’s Crown Jewel of Coastal Real Estate

Orange Beach has long been one of Alabama’s most coveted destinations, and its home price growth over the past 15 years reflects that popularity. With direct Gulf of Mexico access, white sand beaches, marinas, and a thriving tourism economy, this coastal city has attracted a mix of second-home owners, investors, and retirees. The surge in vacation rental demand helped drive prices up sharply in the early 2020s, particularly during the peak of the pandemic housing boom. The development of high-rise condos, waterfront homes, and resort-style communities has transformed the city into one of the state’s most upscale housing markets. In short, Orange Beach has gone from a hidden getaway to a luxury real estate anchor for the entire Gulf Coast.
Even though the past two years have seen a mild pullback in prices, the overall strength of the market remains. The city’s tight zoning, coastal building restrictions, and steady short-term rental income potential continue to draw real estate investors and buyers from across the Southeast. In addition to beachfront appeal, Orange Beach offers top-tier restaurants, coastal trails, fishing charters, and a laid-back yet polished vibe that is hard to match elsewhere in the state. The drop from 2023 to 2025 reflects normal market correction after a historically fast climb, not a drop in interest. With its infrastructure, oceanfront location, and lifestyle amenities, Orange Beach will likely remain one of Alabama’s most expensive—and most desirable—markets for years to come.
1. Mountain Brook – 75.6% Home Price Increase Since 2010

- 2010: $562,549
- 2011: $538,854 (−$23,696, −4.21% from previous year)
- 2012: $518,550 (−$20,304, −3.77% from previous year)
- 2013: $547,481 (+$28,931, +5.58% from previous year)
- 2014: $574,282 (+$26,801, +4.90% from previous year)
- 2015: $601,837 (+$27,556, +4.80% from previous year)
- 2016: $615,993 (+$14,155, +2.35% from previous year)
- 2017: $631,029 (+$15,036, +2.44% from previous year)
- 2018: $638,620 (+$7,592, +1.20% from previous year)
- 2019: $672,020 (+$33,400, +5.23% from previous year)
- 2020: $687,343 (+$15,322, +2.28% from previous year)
- 2021: $795,082 (+$107,739, +15.67% from previous year)
- 2022: $906,765 (+$111,683, +14.05% from previous year)
- 2023: $933,973 (+$27,208, +3.00% from previous year)
- 2024: $954,483 (+$20,510, +2.20% from previous year)
- 2025: $988,046 (+$33,563, +3.52% from previous year)
Mountain Brook remains Alabama’s most expensive housing market in 2025, with home prices climbing from $562,549 in 2010 to $988,046—a 75.6% increase. The sharpest increases came between 2020 and 2022, though values have continued upward every year since.
Mountain Brook – Alabama’s Most Prestigious Address
Few places in Alabama carry the real estate prestige of Mountain Brook. A historic suburb of Birmingham, Mountain Brook is known for its tree-lined streets, architect-designed estates, elite private schools, and boutique village centers. The town has maintained its reputation as the pinnacle of suburban living in the state, with prices reflecting both demand and exclusivity. Homebuyers here are drawn not just to the properties themselves, but to the community’s ambiance and curated feel. Carefully managed zoning and a commitment to green space have preserved the charm of the area, making it a perennial favorite among affluent families, executives, and long-time residents of the Birmingham metro.
The surge in values during the early 2020s was amplified by buyers looking for stable, high-end real estate in uncertain times. Even after the pandemic peak, Mountain Brook continued to appreciate steadily, with little volatility. Unlike resort markets that can swing dramatically, Mountain Brook’s growth has been grounded in decades of reputation, wealth concentration, and strong school districts. Its village centers—like Crestline, English Village, and Mountain Brook Village—are destinations in their own right, offering a walkable lifestyle without leaving the suburbs. As long as high-quality education, safety, and prestige remain high priorities for buyers, Mountain Brook is likely to keep its spot as Alabama’s top-tier housing market.


