🔥 Would you like to save this?
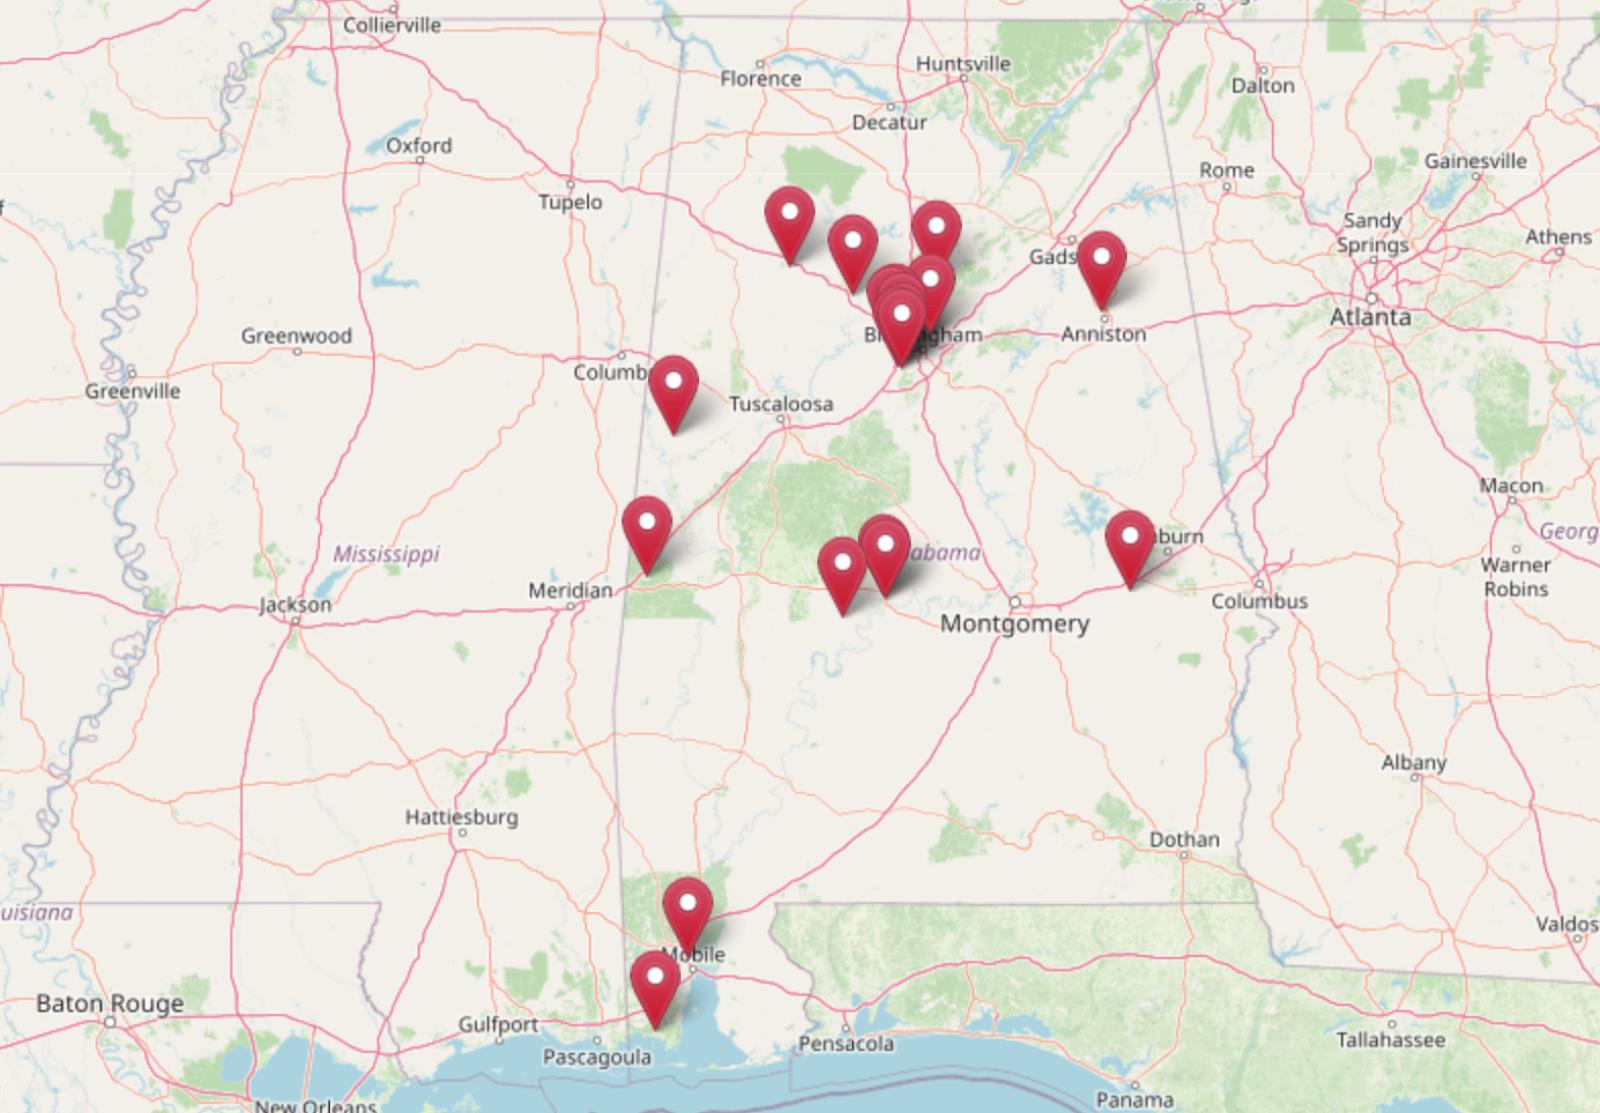
The latest Zillow Home Value Index shows that Alabama remains one of the most affordable states for buying a home in 2025. But zoom in, and you’ll find certain towns where prices are even more striking—places where the average home still sells for under $90,000. From quiet riverfront spots to low-key suburbs near Birmingham and Mobile, these communities offer rare value in today’s market. Backed by 15 years of pricing data and local insights, this list reveals where affordability continues to hold strong despite shifting national trends.
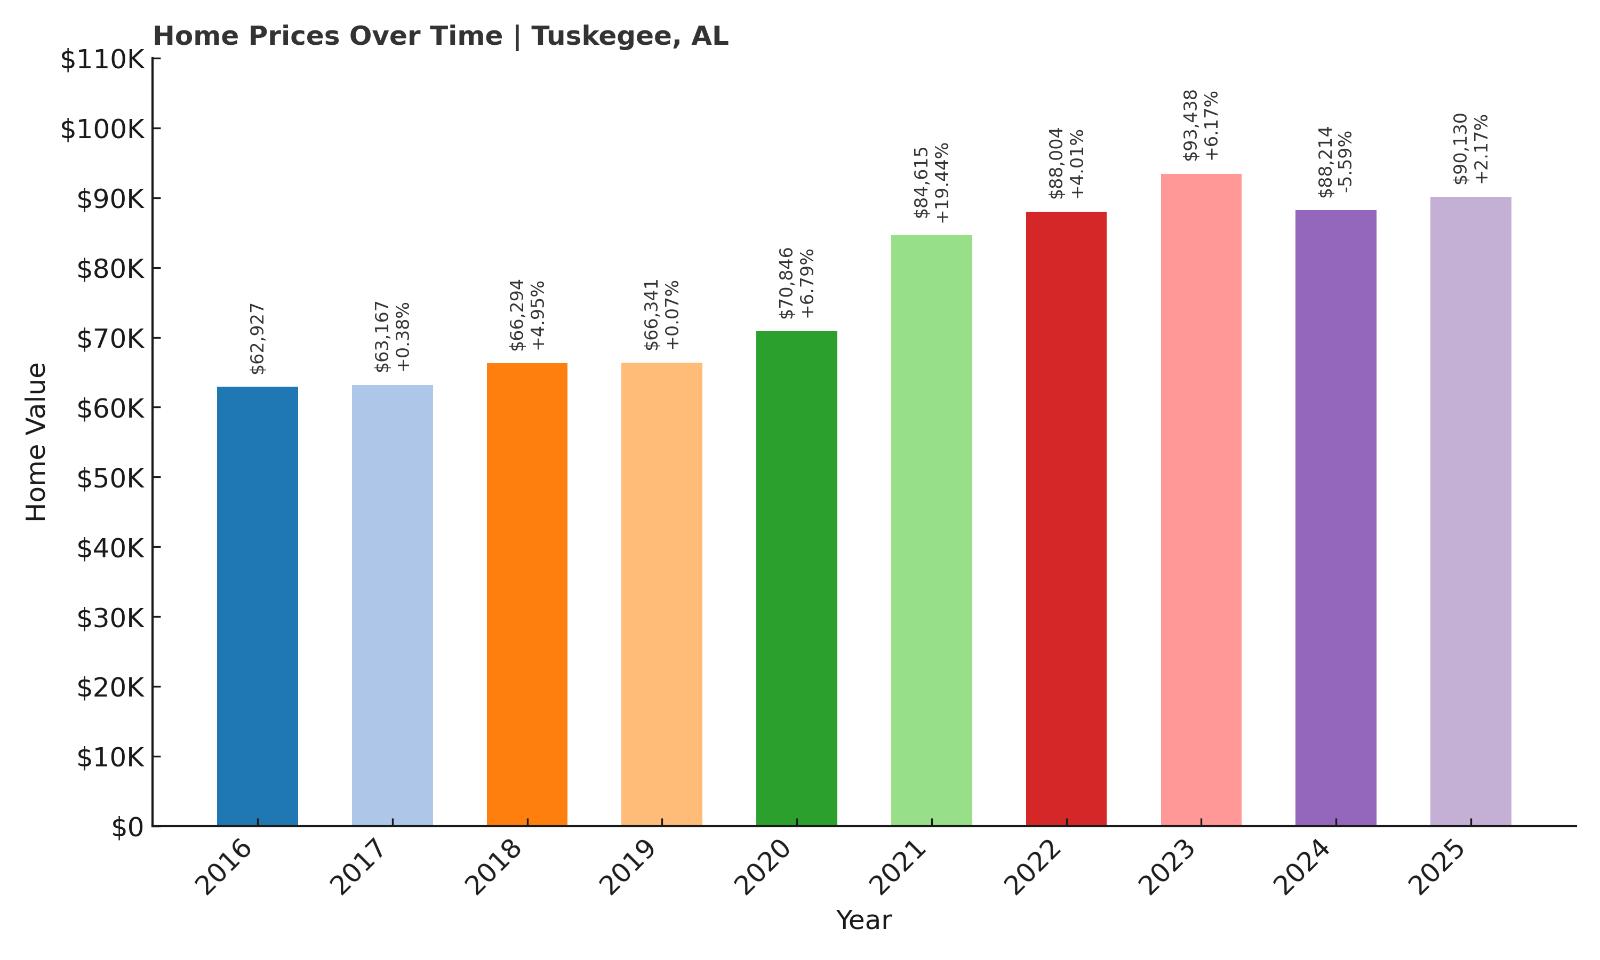
19. Tuskegee – 43% Home Price Increase Since 2016
- 2010: N/A
- 2011: N/A
- 2012: N/A
- 2013: N/A
- 2014: N/A
- 2015: N/A
- 2016: $62,926.74
- 2017: $63,166.72 (+$239.98, +0.38% from previous year)
- 2018: $66,293.95 (+$3,127.23, +4.95% from previous year)
- 2019: $66,341.12 (+$47.16, +0.07% from previous year)
- 2020: $70,846.37 (+$4,505.25, +6.79% from previous year)
- 2021: $84,614.51 (+$13,768.15, +19.43% from previous year)
- 2022: $88,003.99 (+$3,389.48, +4.01% from previous year)
- 2023: $93,437.88 (+$5,433.89, +6.17% from previous year)
- 2024: $88,214.37 (-$5,223.51, -5.59% from previous year)
- 2025: $90,129.54 (+$1,915.17, +2.17% from previous year)
Home prices in Tuskegee have climbed steadily over the past decade, with a total increase of about 43% since 2016. The town saw its most significant jump in 2021, with prices spiking nearly 20% from the year before. While there was a dip in 2024, prices appear to be recovering slightly in 2025. These numbers show a market that remains highly affordable while also reflecting strong upward movement over time. The consistency of growth through the late 2010s and into the 2020s suggests a local market that is gaining traction with buyers without experiencing extreme volatility. For buyers focused on long-term value, Tuskegee presents an encouraging picture of modest but meaningful appreciation.
In order to come up with the very specific design ideas, we create most designs with the assistance of state-of-the-art AI interior design software.
Tuskegee – Historic Charm and Affordability
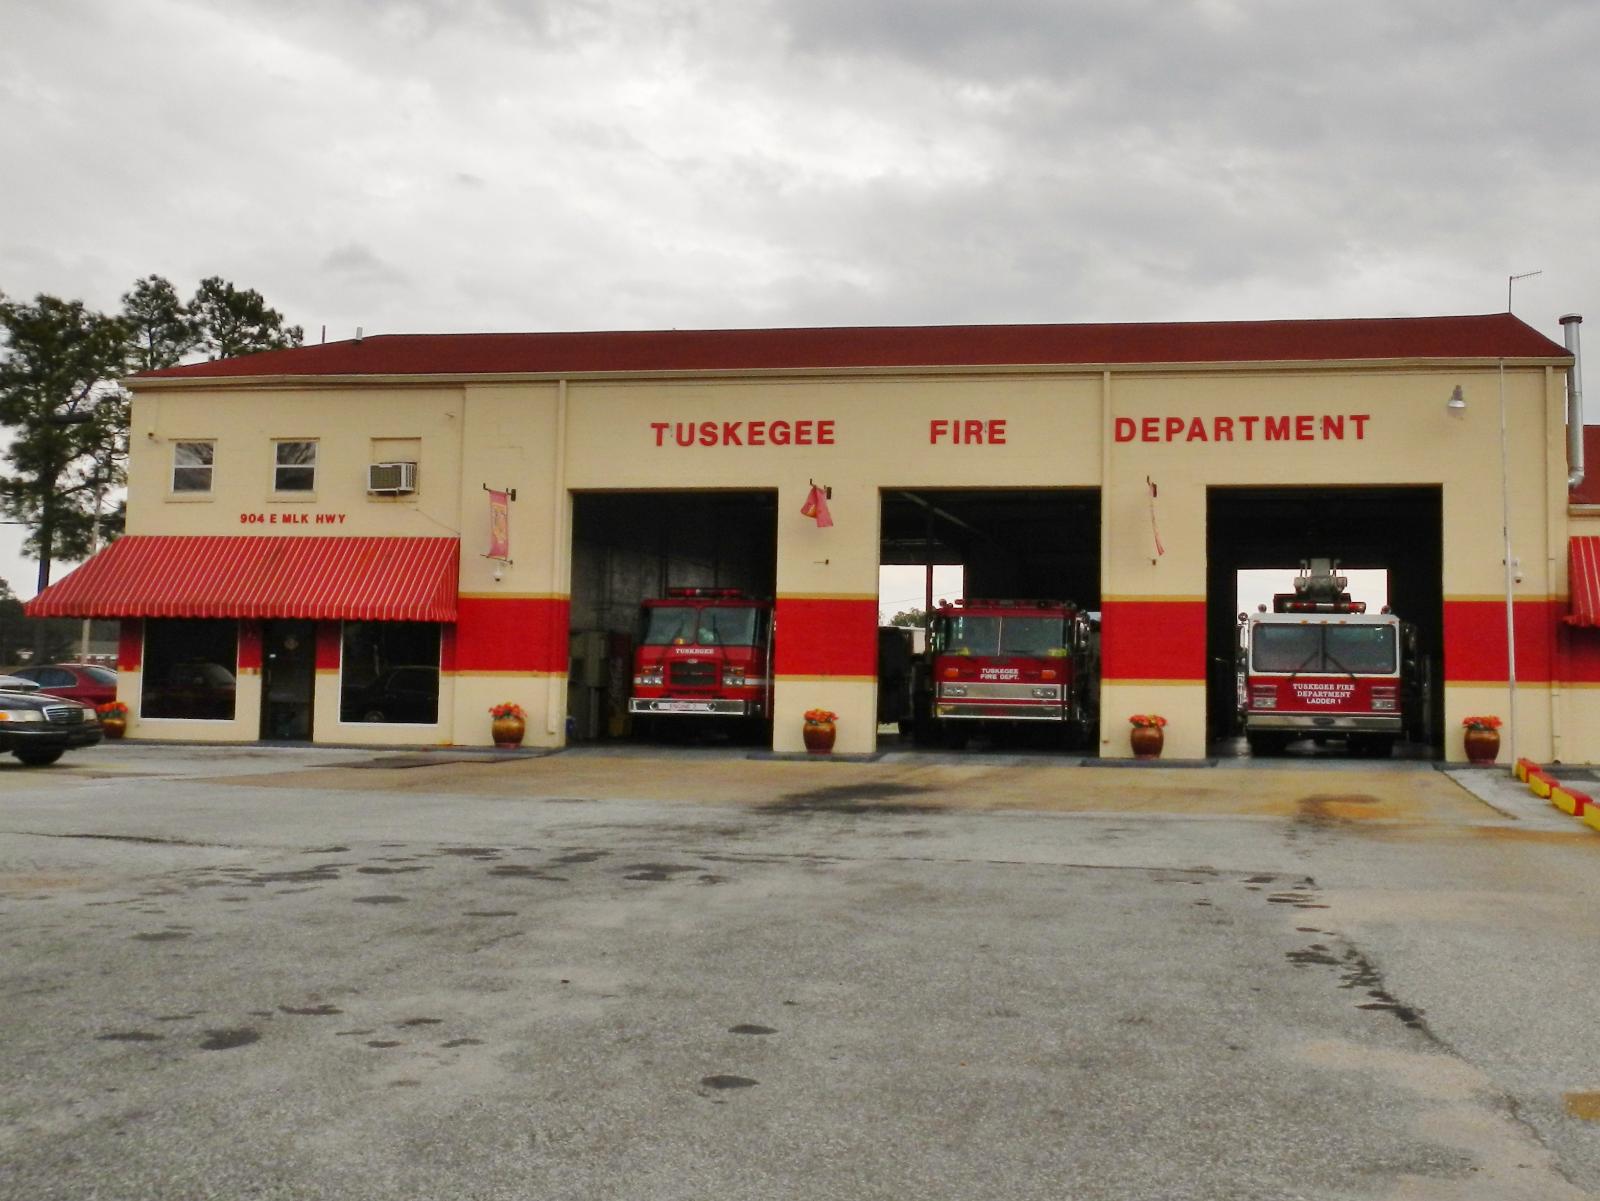
Tuskegee is located in eastern Alabama and is known for its deep roots in American history and education. Home to Tuskegee University, a historically Black university founded in 1881, the town has long played a central role in Black heritage and culture in the U.S. While the town has a smaller population, it enjoys a stable housing market supported by institutional presence and a growing interest in revitalization efforts. The relatively low home prices make it an attractive option for retirees, investors, or first-time homebuyers who want to live in a community rich with history.
The town’s affordability, combined with recent signs of real estate appreciation, suggest a market with long-term potential. Local amenities include a national historic site, medical facilities, and public parks, all within reach of Montgomery. Though smaller in size, Tuskegee’s cultural legacy continues to attract attention, and its housing market appears to be responding to that interest in a sustainable way.
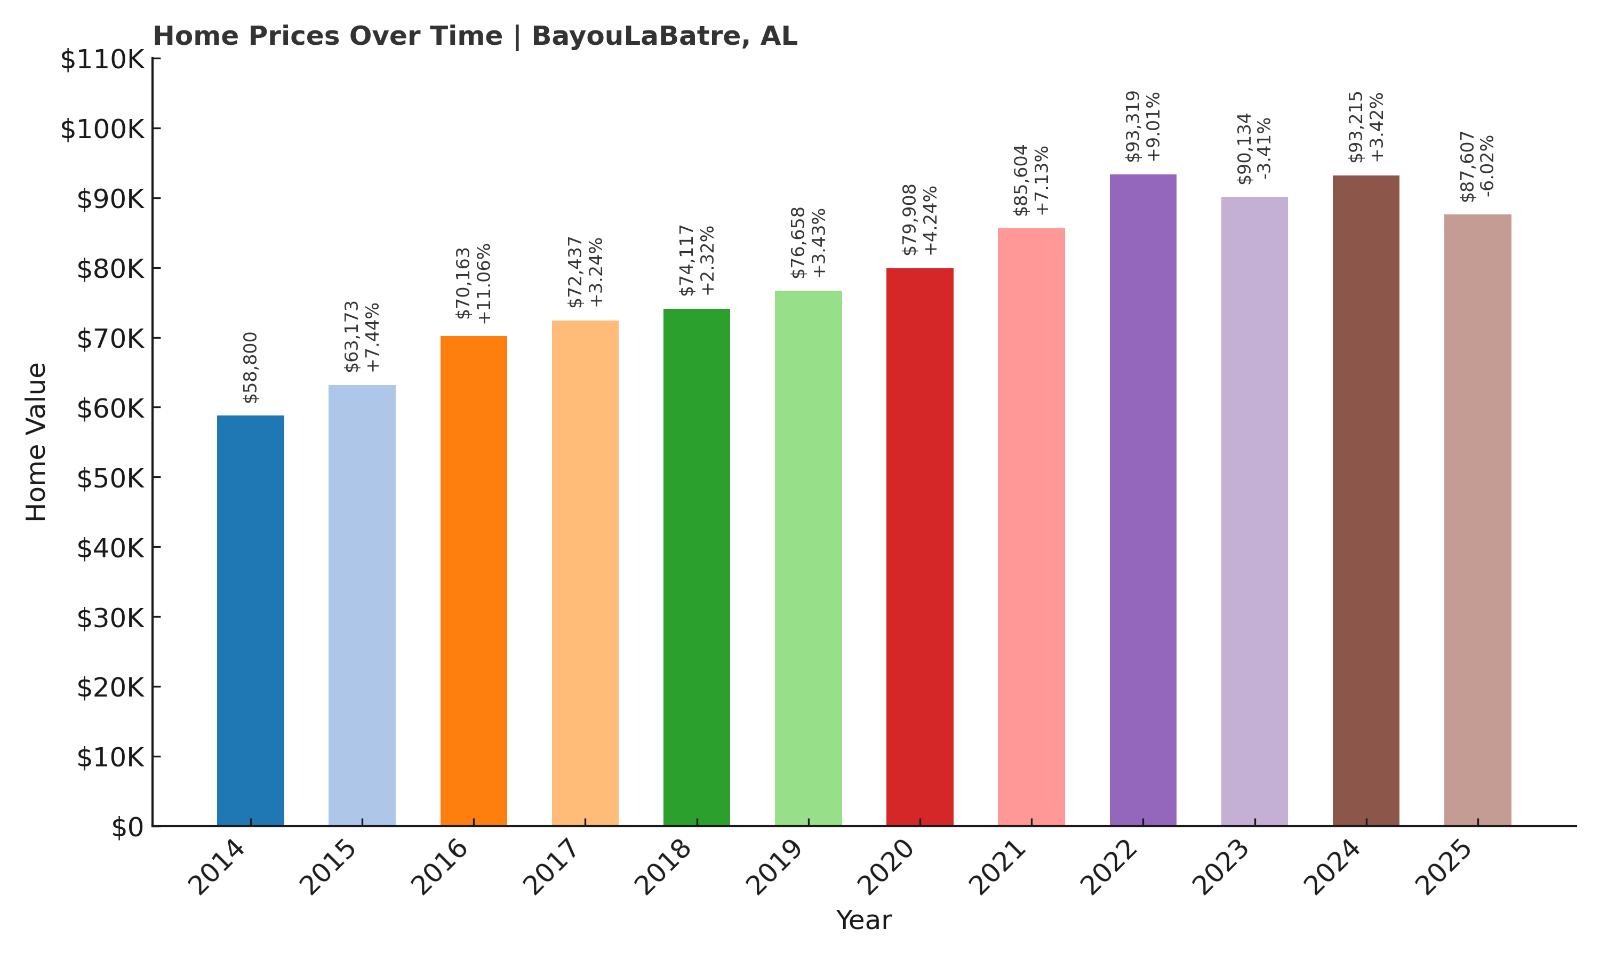
18. Bayou La Batre – 49% Home Price Increase Since 2014
- 2010: N/A
- 2011: N/A
- 2012: N/A
- 2013: N/A
- 2014: $58,799.83
- 2015: $63,172.82 (+$4,373.00, +7.44% from previous year)
- 2016: $70,162.69 (+$6,989.86, +11.06% from previous year)
- 2017: $72,436.65 (+$2,273.96, +3.24% from previous year)
- 2018: $74,117.01 (+$1,680.36, +2.32% from previous year)
- 2019: $76,658.17 (+$2,541.16, +3.43% from previous year)
- 2020: $79,908.15 (+$3,249.98, +4.24% from previous year)
- 2021: $85,603.75 (+$5,695.60, +7.13% from previous year)
- 2022: $93,319.00 (+$7,715.25, +9.01% from previous year)
- 2023: $90,134.06 (-$3,184.94, -3.41% from previous year)
- 2024: $93,215.33 (+$3,081.27, +3.42% from previous year)
- 2025: $87,606.85 (-$5,608.48, -6.02% from previous year)
Bayou La Batre has seen nearly 50% growth in home prices since 2014, though the past two years have included some declines. Between 2015 and 2022, values rose almost every year, driven by steady demand and moderate appreciation. A dip in 2023 followed by a slight rebound and then another drop in 2025 suggests that prices here may have peaked temporarily. Even so, average values remain well below $100,000, making it one of the most accessible coastal towns for prospective buyers in Alabama. The long-term growth trend still stands strong compared to early 2010s levels.
Bayou La Batre – A Coastal Town with Fishing Roots
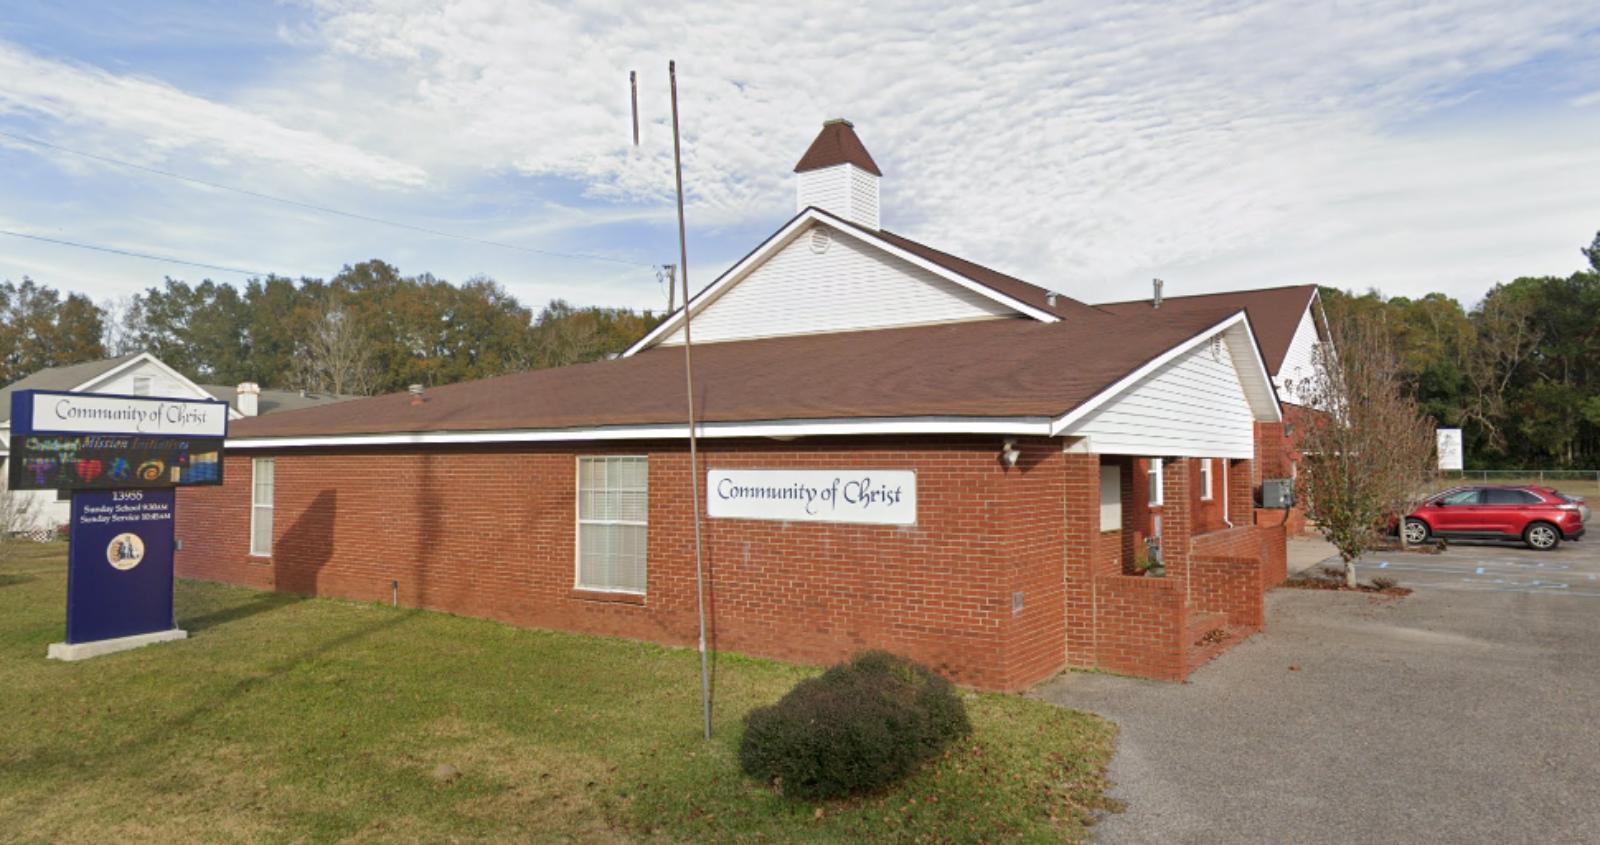
Bayou La Batre is a small Gulf Coast town in Mobile County known for its commercial seafood industry and close ties to the Gulf of Mexico. With shrimp boats in the harbor and a working waterfront atmosphere, the town draws people seeking affordable housing near Alabama’s scenic coastal areas. Despite its coastal location, home prices here have remained among the lowest in the state, making it a great option for buyers looking for value with water access nearby.
While the local economy centers on fishing and maritime trades, the town has received investment in recent years aimed at infrastructure and storm resilience. These improvements may have played a role in the price run-up seen between 2015 and 2022. Although recent declines hint at some correction, Bayou La Batre’s overall affordability and proximity to the Gulf ensure it remains attractive for both locals and newcomers alike.
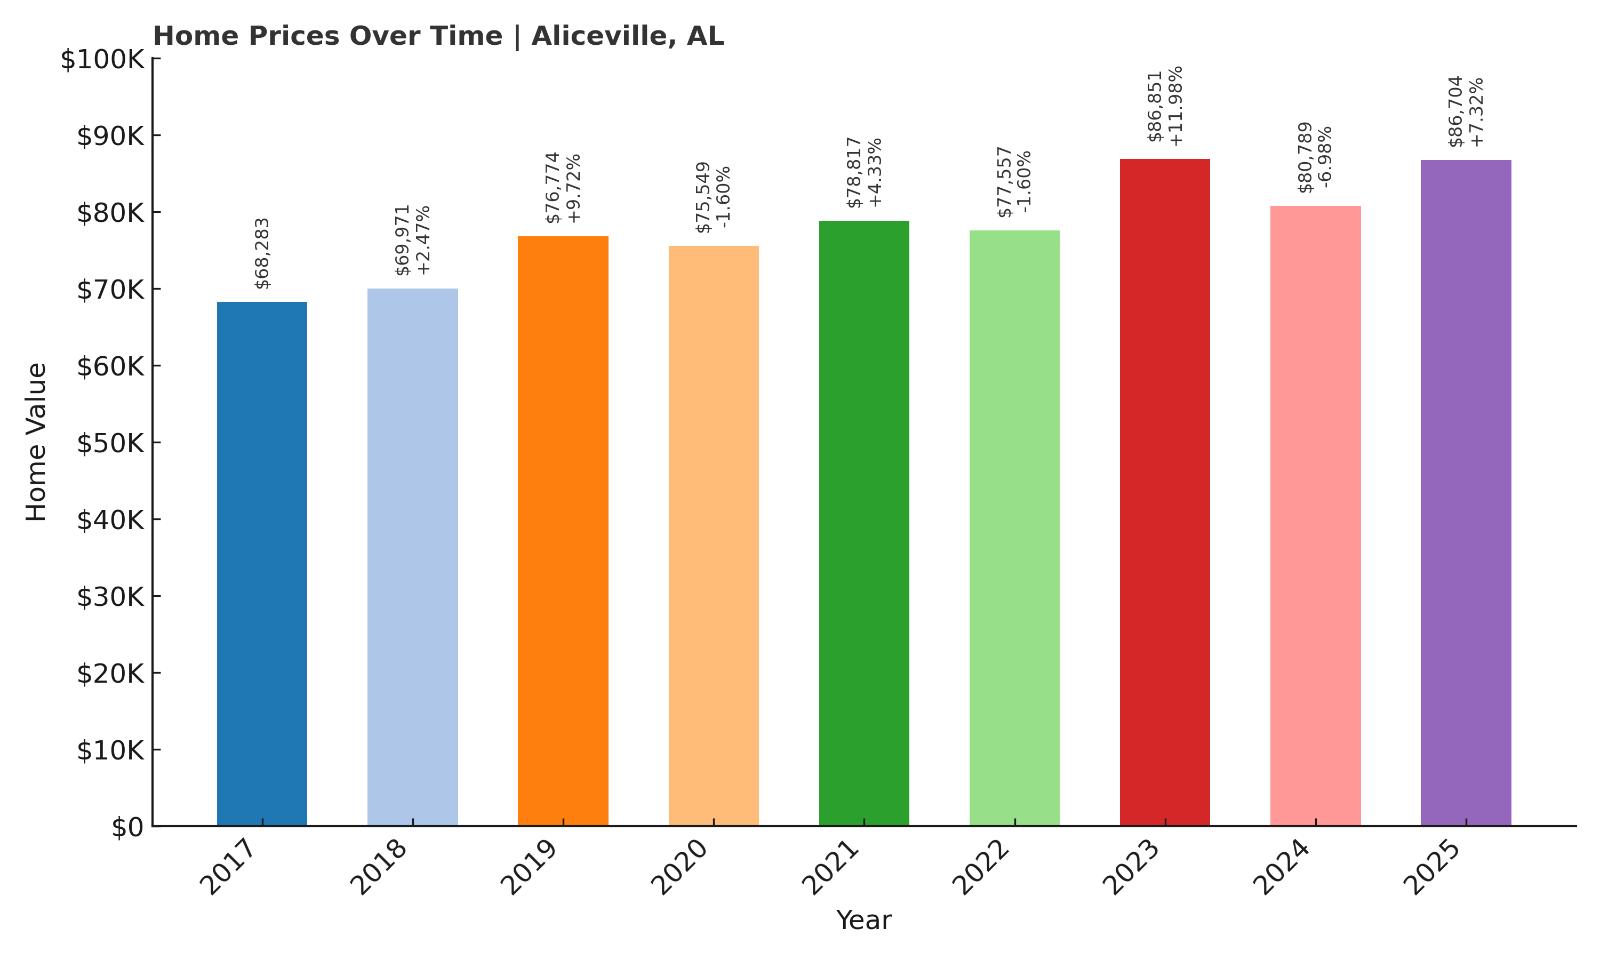
17. Aliceville – 27% Home Price Increase Since 2017
- 2010: N/A
- 2011: N/A
- 2012: N/A
- 2013: N/A
- 2014: N/A
- 2015: N/A
- 2016: N/A
- 2017: $68,283.17
- 2018: $69,970.52 (+$1,687.35, +2.47% from previous year)
- 2019: $76,774.47 (+$6,803.95, +9.72% from previous year)
- 2020: $75,548.94 (-$1,225.53, -1.60% from previous year)
- 2021: $78,816.66 (+$3,267.72, +4.33% from previous year)
- 2022: $77,556.89 (-$1,259.77, -1.60% from previous year)
- 2023: $86,850.88 (+$9,293.99, +11.98% from previous year)
- 2024: $80,788.54 (-$6,062.34, -6.98% from previous year)
- 2025: $86,704.39 (+$5,915.85, +7.32% from previous year)
Home values in Aliceville have grown about 27% since 2017, with significant jumps in 2019 and 2023. Despite a few minor dips, the market shows a generally upward trend. Prices remain below $90,000 as of 2025, making the town an attractive location for buyers seeking long-term affordability. The sharp 11.98% rise in 2023 helped offset earlier declines and indicates renewed interest in the local housing market. Aliceville stands out for relatively stable pricing and notable rebounds after downturns.
Aliceville – A Small Town with Steady Momentum
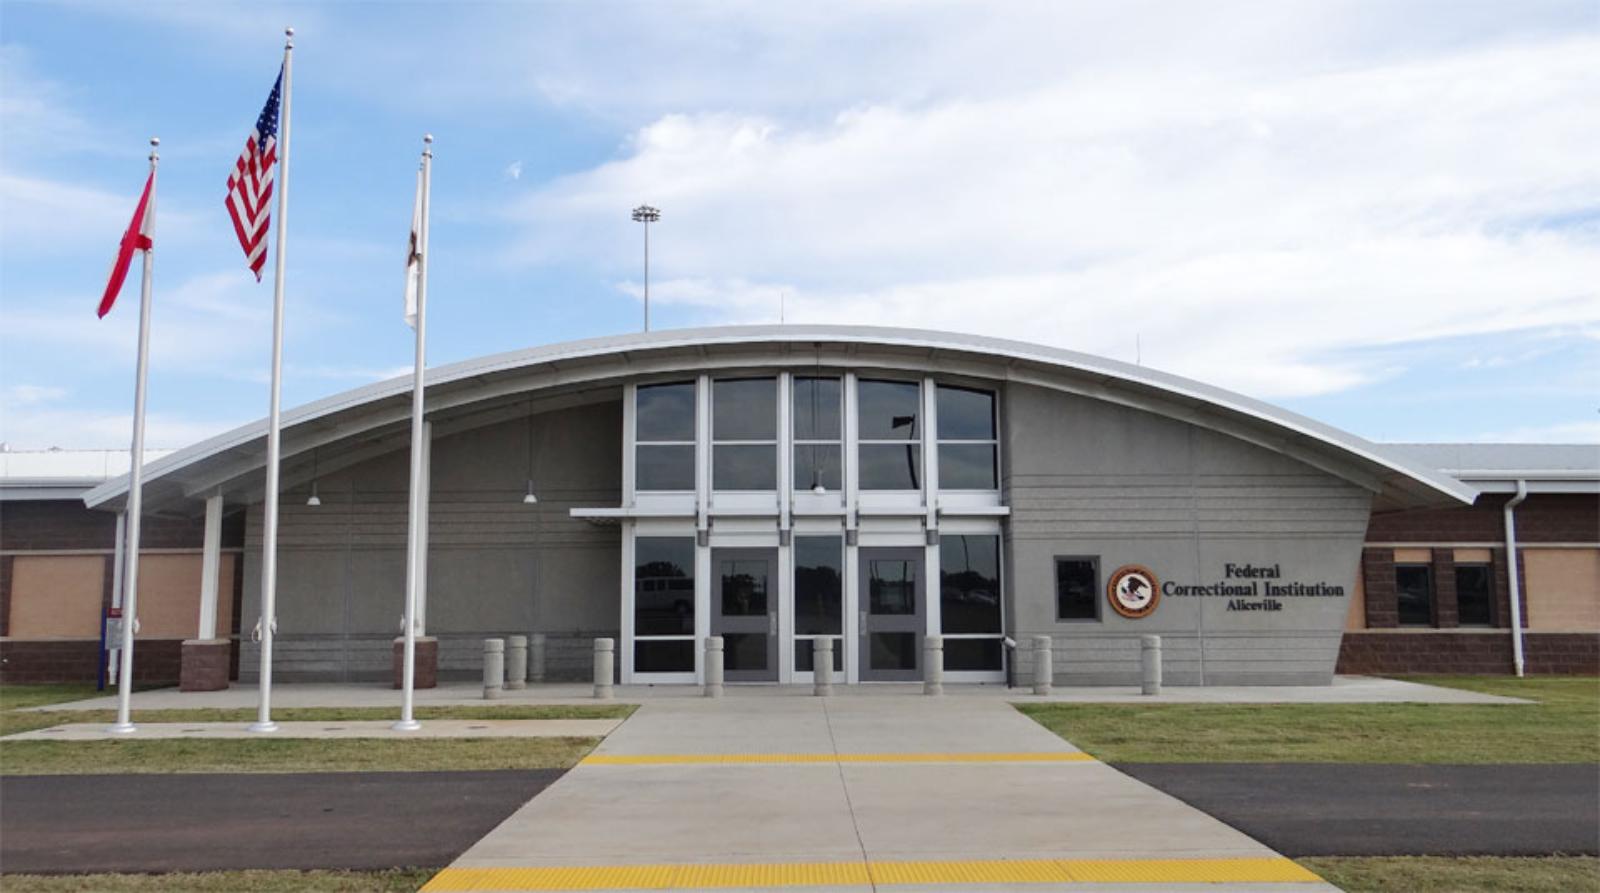
Aliceville sits in Pickens County near the Mississippi border and offers a peaceful, small-town setting in west-central Alabama. Known for its historical importance during World War II as the site of a German POW camp, today the town is home to a close-knit community with local schools and civic pride. While not a major economic hub, Aliceville’s rural charm and low home costs make it appealing for budget-conscious buyers.
The town’s modest market growth has picked up in recent years, possibly driven by rising interest in less crowded, more affordable locations across Alabama. Proximity to Tuscaloosa gives residents access to jobs and amenities while preserving small-town affordability. Given its current price levels and recent price recovery, Aliceville might appeal to both homeowners and investors seeking value in under-the-radar areas.
16. Cordova – 28% Home Price Increase Since 2010
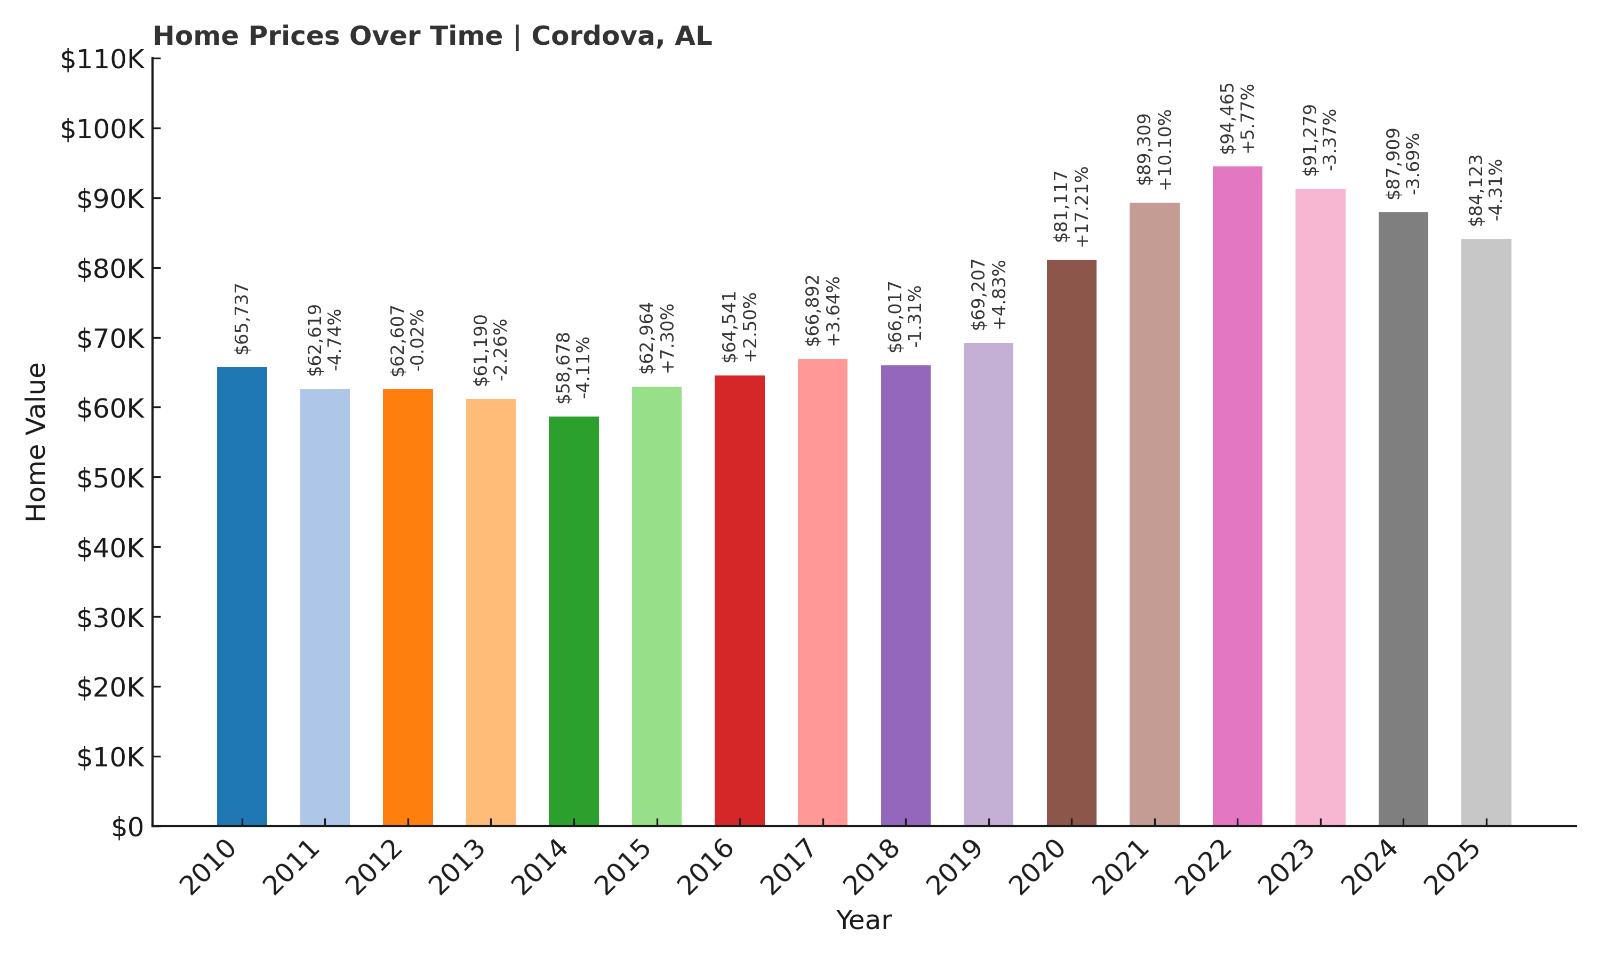
- 2010: $65,736.95
- 2011: $62,618.70 (-$3,118.25, -4.74% from previous year)
- 2012: $62,606.91 (-$11.79, -0.02% from previous year)
- 2013: $61,190.08 (-$1,416.84, -2.26% from previous year)
- 2014: $58,678.01 (-$2,512.07, -4.11% from previous year)
- 2015: $62,963.58 (+$4,285.58, +7.30% from previous year)
- 2016: $64,541.06 (+$1,577.47, +2.51% from previous year)
- 2017: $66,891.61 (+$2,350.55, +3.64% from previous year)
- 2018: $66,016.51 (-$875.10, -1.31% from previous year)
- 2019: $69,207.42 (+$3,190.92, +4.83% from previous year)
- 2020: $81,117.23 (+$11,909.80, +17.21% from previous year)
- 2021: $89,309.15 (+$8,191.93, +10.10% from previous year)
- 2022: $94,465.31 (+$5,156.15, +5.77% from previous year)
- 2023: $91,278.62 (-$3,186.69, -3.37% from previous year)
- 2024: $87,908.58 (-$3,370.04, -3.69% from previous year)
- 2025: $84,122.62 (-$3,785.96, -4.31% from previous year)
Cordova has seen a total increase of about 28% in home prices since 2010. After some ups and downs in the early years, the market surged in 2020 and 2021, rising more than 27% over that two-year span. While prices have declined over the past three years, they remain much higher than a decade ago. This kind of trajectory reflects a market that responded to broader economic trends but is now finding a new equilibrium. With 2025 values sitting just above $84,000, Cordova continues to offer affordable options for homebuyers even after recent corrections.
Cordova – Rising from the Rubble
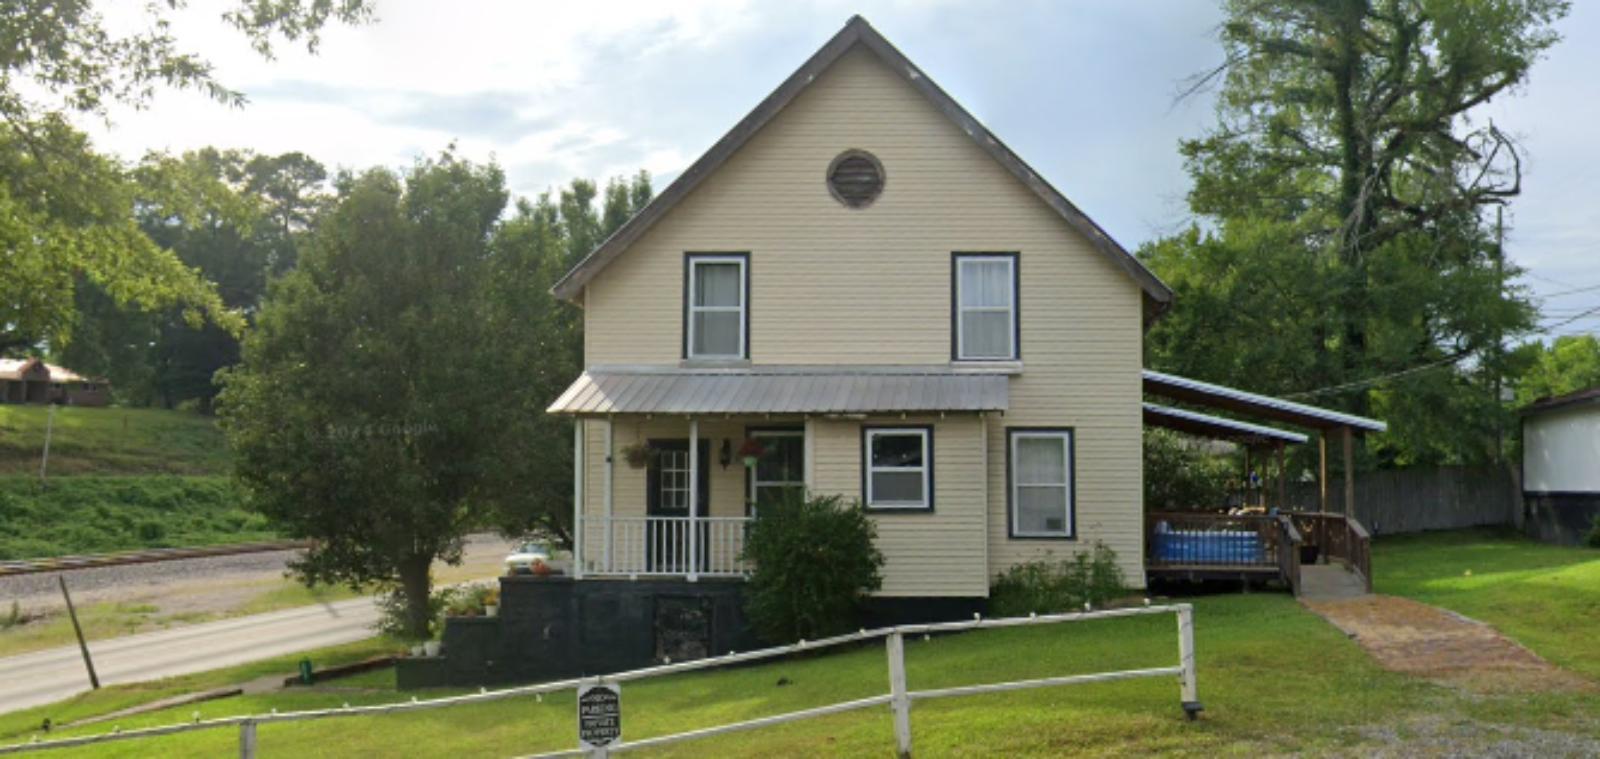
Cordova, located in Walker County, was one of several Alabama towns hit hard by the 2011 tornado outbreak. Since then, the community has made significant strides in rebuilding and revitalizing. The post-disaster recovery efforts likely contributed to the surge in home prices seen between 2019 and 2021, as new construction and investment increased property values.
The town benefits from its proximity to Jasper and Birmingham, offering reasonable commuting options while preserving a quieter, more rural setting. Cordova’s affordable housing stock, access to local amenities, and historic roots make it a viable choice for buyers looking for both value and character. While recent price dips may give some pause, they also suggest potential opportunities in a market that has proven its resilience.
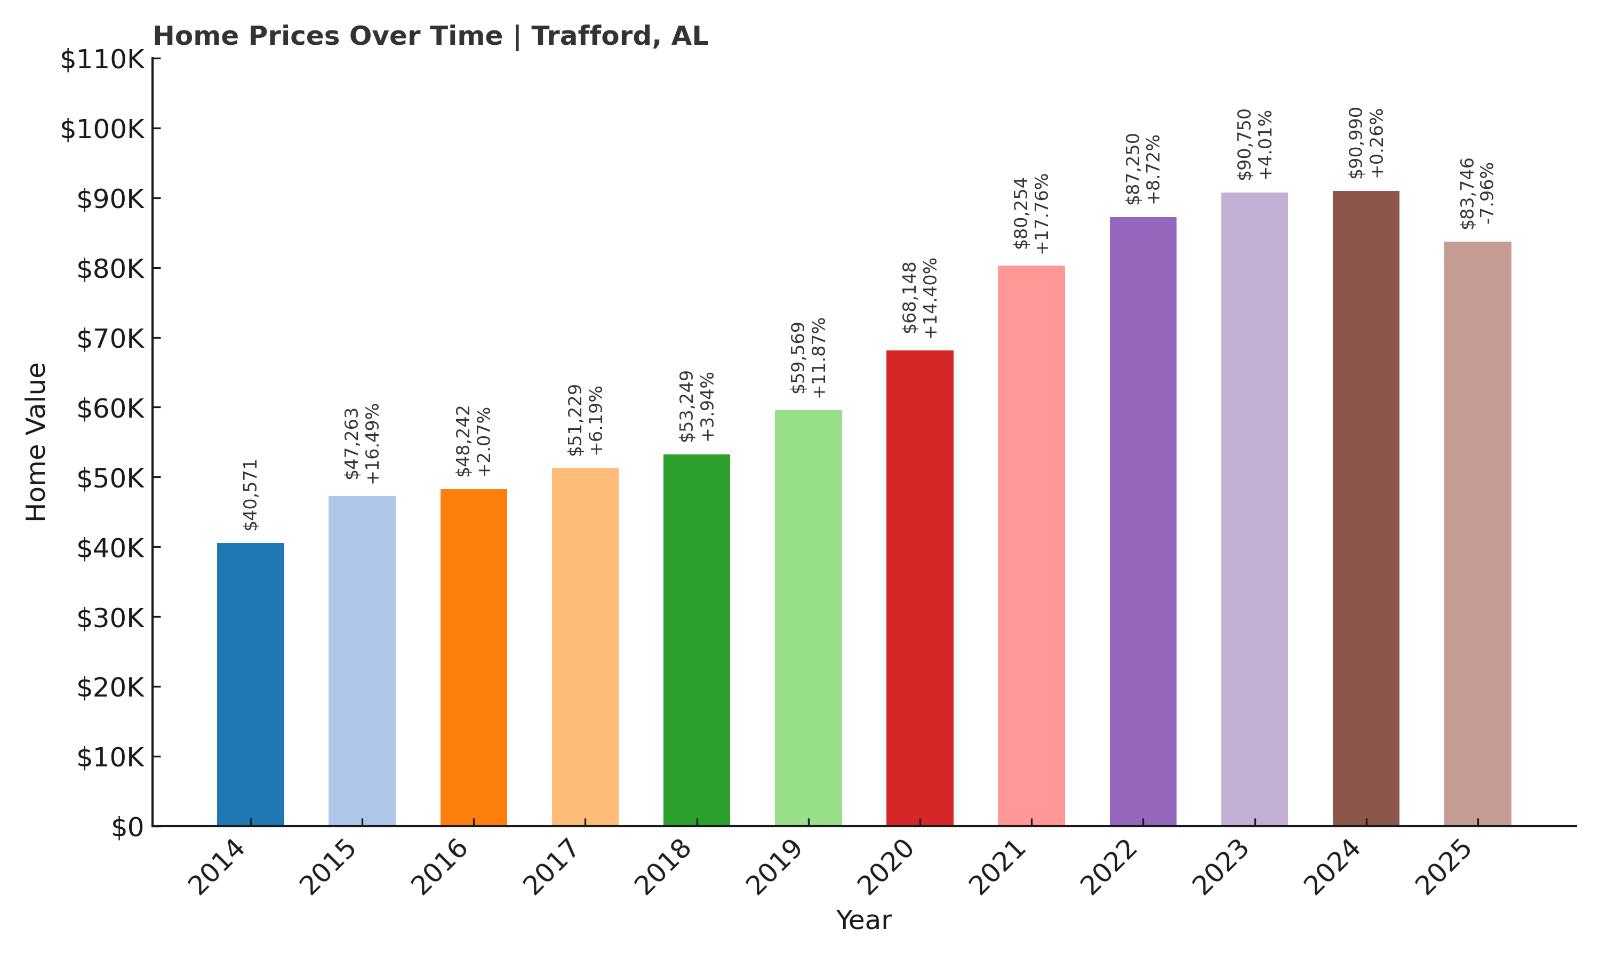
15. Trafford – 107% Home Price Increase Since 2014
- 2010: N/A
- 2011: N/A
- 2012: N/A
- 2013: N/A
- 2014: $40,571.02
- 2015: $47,263.08 (+$6,692.06, +16.49% from previous year)
- 2016: $48,242.14 (+$979.06, +2.07% from previous year)
- 2017: $51,228.67 (+$2,986.53, +6.19% from previous year)
- 2018: $53,249.01 (+$2,020.34, +3.94% from previous year)
- 2019: $59,569.11 (+$6,320.10, +11.87% from previous year)
- 2020: $68,147.61 (+$8,578.50, +14.40% from previous year)
- 2021: $80,253.78 (+$12,106.17, +17.76% from previous year)
- 2022: $87,250.46 (+$6,996.69, +8.72% from previous year)
- 2023: $90,750.23 (+$3,499.77, +4.01% from previous year)
- 2024: $90,989.77 (+$239.54, +0.26% from previous year)
- 2025: $83,746.21 (-$7,243.55, -7.96% from previous year)
Trafford has experienced remarkable home price growth of over 100% since 2014, with the biggest leaps occurring between 2019 and 2021. That three-year period alone saw home values increase by more than $20,000, reflecting major momentum in a previously undervalued market. Even with a noticeable dip in 2025, Trafford’s prices remain more than double where they were a decade ago. The market saw a brief leveling-off in 2024, but overall, it continues to trend well above its early 2010s values. This long-term upward movement shows that even in a town with a modest profile, real estate gains can be substantial over time. Trafford’s housing market is a standout example of how smaller towns near metro areas can attract interest and appreciate quickly. With current home values in the low $80,000s, Trafford continues to offer affordability paired with impressive historic returns. For buyers focused on long-term value, it presents a compelling option.
Trafford – Big Growth in a Small Package
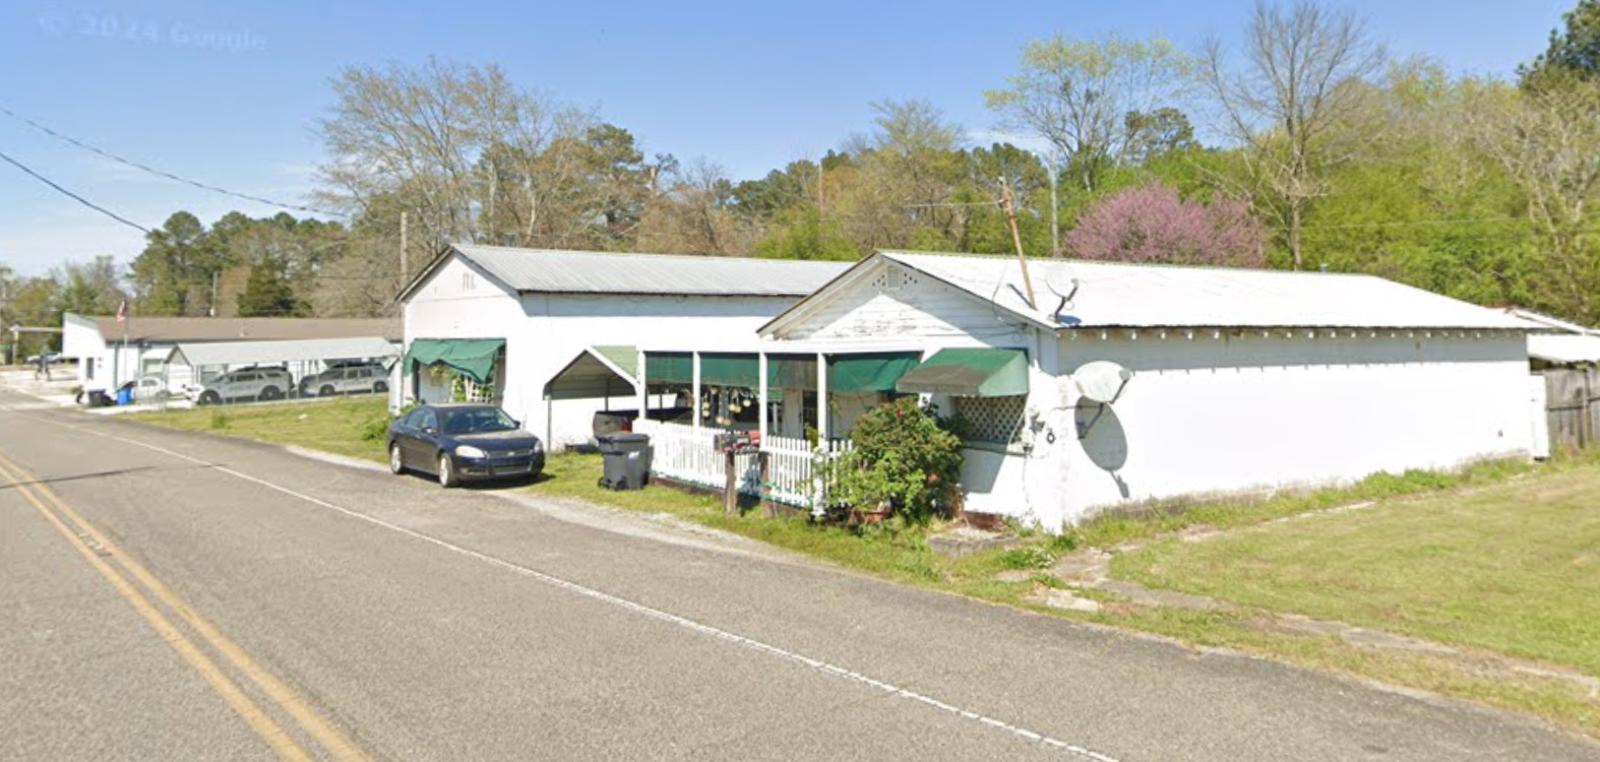
Nestled in northern Jefferson County, Trafford is a compact town that sits within reach of the greater Birmingham metro area. Its location makes it especially appealing to people who want to live outside the city while still enjoying easy access to jobs, schools, and services. Despite its small size, Trafford has seen serious home value appreciation over the past decade, likely driven by demand from commuters seeking more affordable housing within a reasonable distance of Birmingham’s employment centers. The town maintains a quiet, semi-rural atmosphere, with limited traffic and a strong sense of community.
Local amenities are modest but sufficient for daily needs, and nearby towns offer more options without requiring long drives. The mix of affordability and convenience likely contributed to Trafford’s recent real estate boom, particularly during the post-pandemic surge when smaller, quieter communities became more attractive. Even with the recent dip, the 2025 price of around $83,000 still represents substantial equity gains for longer-term owners. For buyers looking for a low-cost entry point into homeownership with a proven growth pattern, Trafford is worth serious consideration.
14. Carbon Hill – 51% Home Price Increase Since 2010
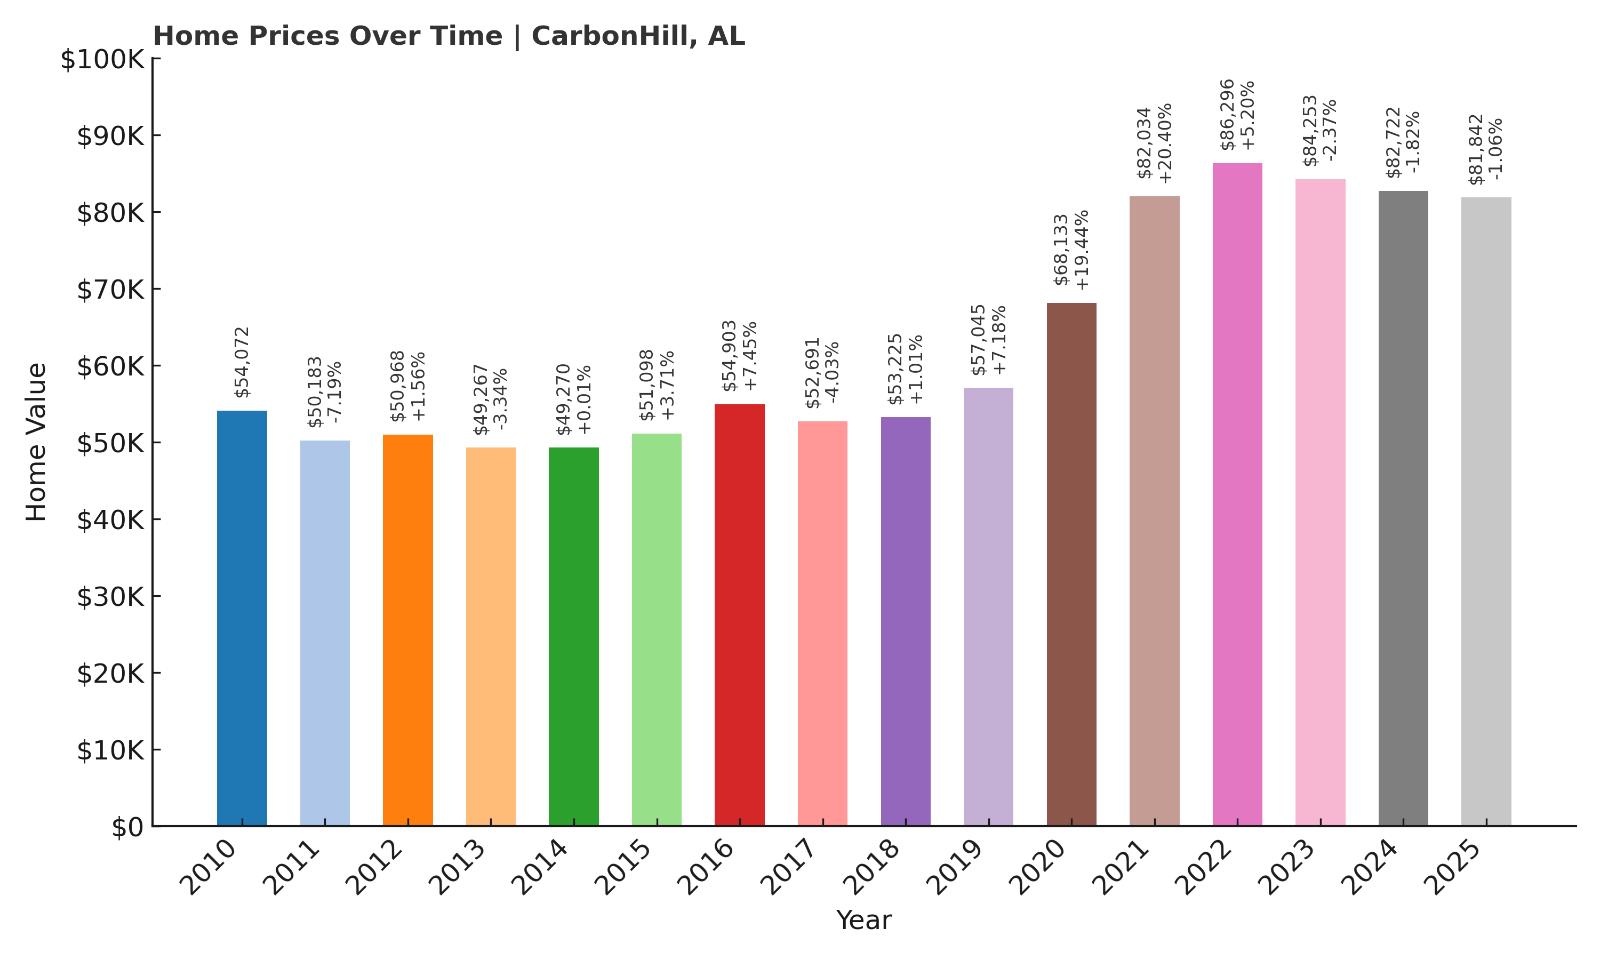
- 2010: $54,071.81
- 2011: $50,182.89 (-$3,888.92, -7.19% from previous year)
- 2012: $50,968.13 (+$785.24, +1.56% from previous year)
- 2013: $49,266.81 (-$1,701.33, -3.34% from previous year)
- 2014: $49,270.40 (+$3.60, +0.01% from previous year)
- 2015: $51,098.35 (+$1,827.95, +3.71% from previous year)
- 2016: $54,902.93 (+$3,804.58, +7.45% from previous year)
- 2017: $52,691.18 (-$2,211.75, -4.03% from previous year)
- 2018: $53,224.64 (+$533.47, +1.01% from previous year)
- 2019: $57,044.53 (+$3,819.89, +7.18% from previous year)
- 2020: $68,132.87 (+$11,088.34, +19.44% from previous year)
- 2021: $82,033.94 (+$13,901.07, +20.40% from previous year)
- 2022: $86,295.67 (+$4,261.73, +5.20% from previous year)
- 2023: $84,252.67 (-$2,043.00, -2.37% from previous year)
- 2024: $82,721.65 (-$1,531.02, -1.82% from previous year)
- 2025: $81,842.46 (-$879.19, -1.06% from previous year)
Carbon Hill’s home values have grown by about 51% since 2010, with dramatic spikes in 2020 and 2021 accounting for much of the overall appreciation. The market nearly doubled in just two years during that period, then experienced some softening in the years that followed. Nonetheless, 2025 values remain significantly higher than a decade ago, showing just how much the town’s housing market has matured. That said, the last three years have seen gradual declines, likely part of a natural correction after the rapid price growth during the pandemic-fueled housing boom. Still, with an average home price around $81,800, Carbon Hill continues to be a highly affordable option in northwestern Alabama. The price history here illustrates a boom-and-settle pattern common in smaller markets during national upswings. For buyers looking for value and long-term appreciation, Carbon Hill remains appealing despite recent pullbacks.
Carbon Hill – Resilience and Renewed Attention
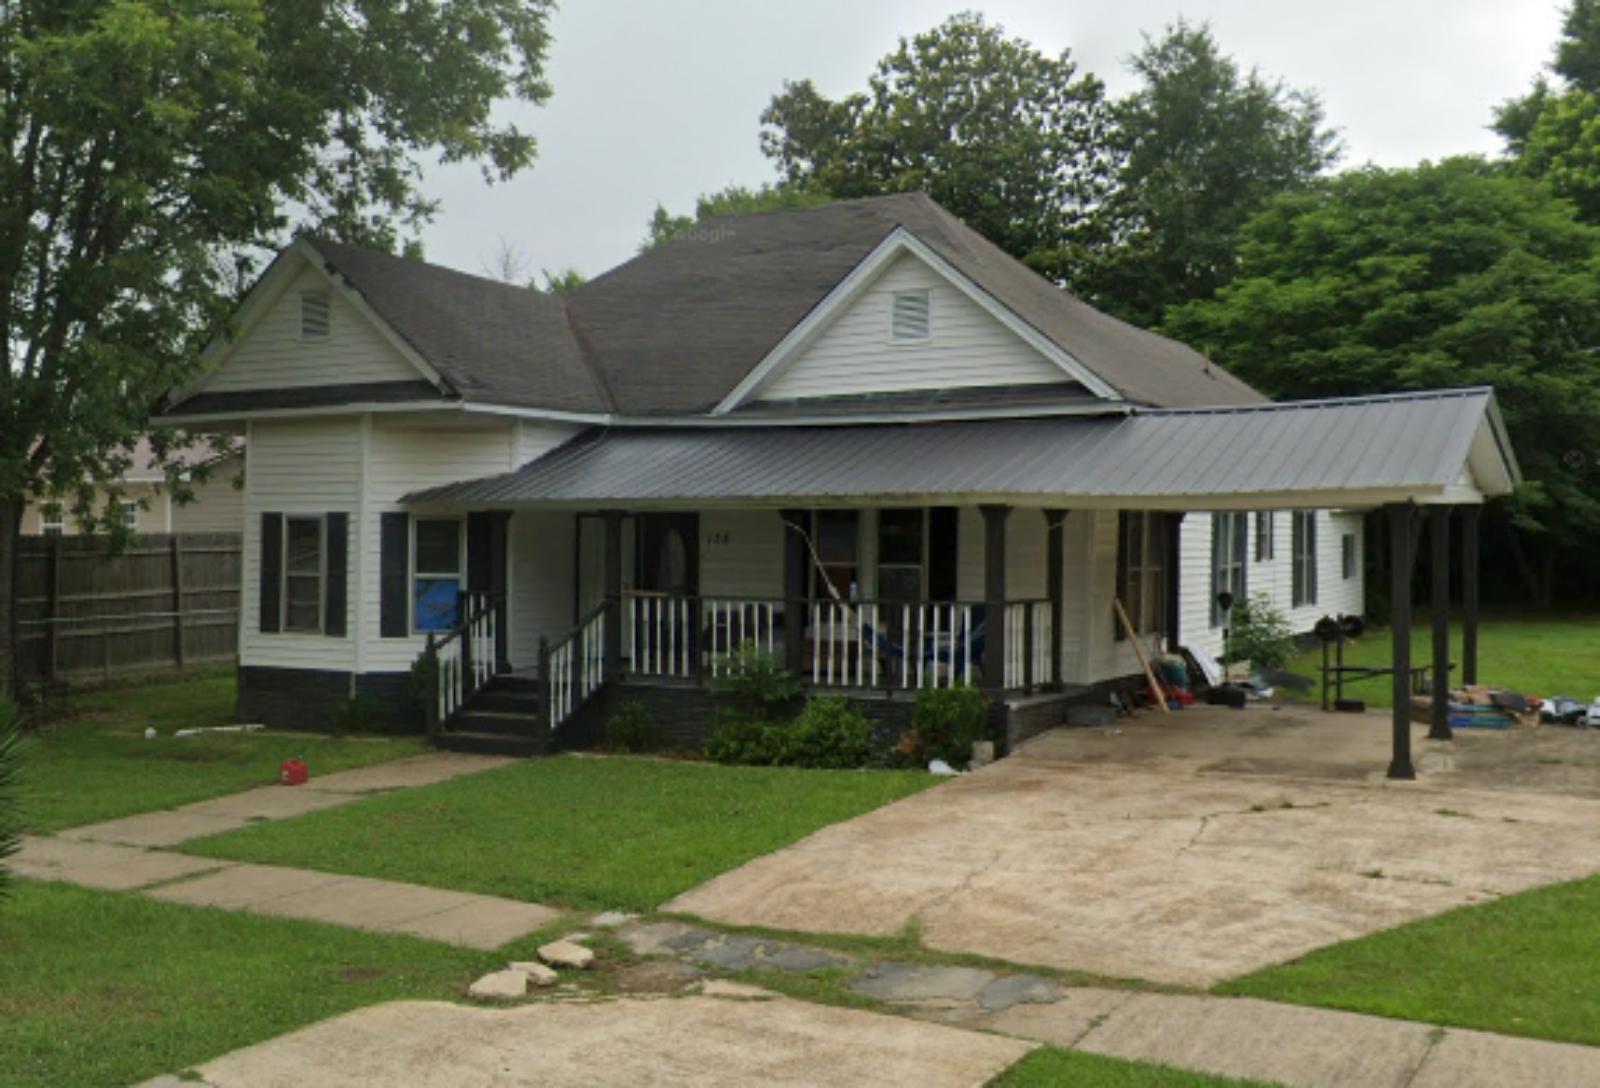
Located in Walker County, Carbon Hill is a former coal town that has faced its share of economic and natural challenges over the years, including tornado damage and shifting job markets. But despite these hurdles, the town has shown strong signs of revitalization in its housing sector, particularly over the last five years. The affordability of homes here has made Carbon Hill attractive to first-time buyers, especially those seeking a quieter lifestyle within reach of Jasper or Birmingham. The rapid appreciation during 2020–2021 may have reflected an influx of demand from both locals and out-of-area buyers chasing lower price points and less congested living conditions.
Today, Carbon Hill still maintains a small-town feel, with essential services, local schools, and an emphasis on community. While it doesn’t have the high-end developments of larger cities, its stability and affordability continue to draw interest. Buyers should be mindful of the recent slight price drops, but for many, those dips could present a buying opportunity. Given its long-term growth trend, Carbon Hill is a town that has weathered storms—both literal and economic—and come out with a stronger housing market than many would have expected a decade ago.
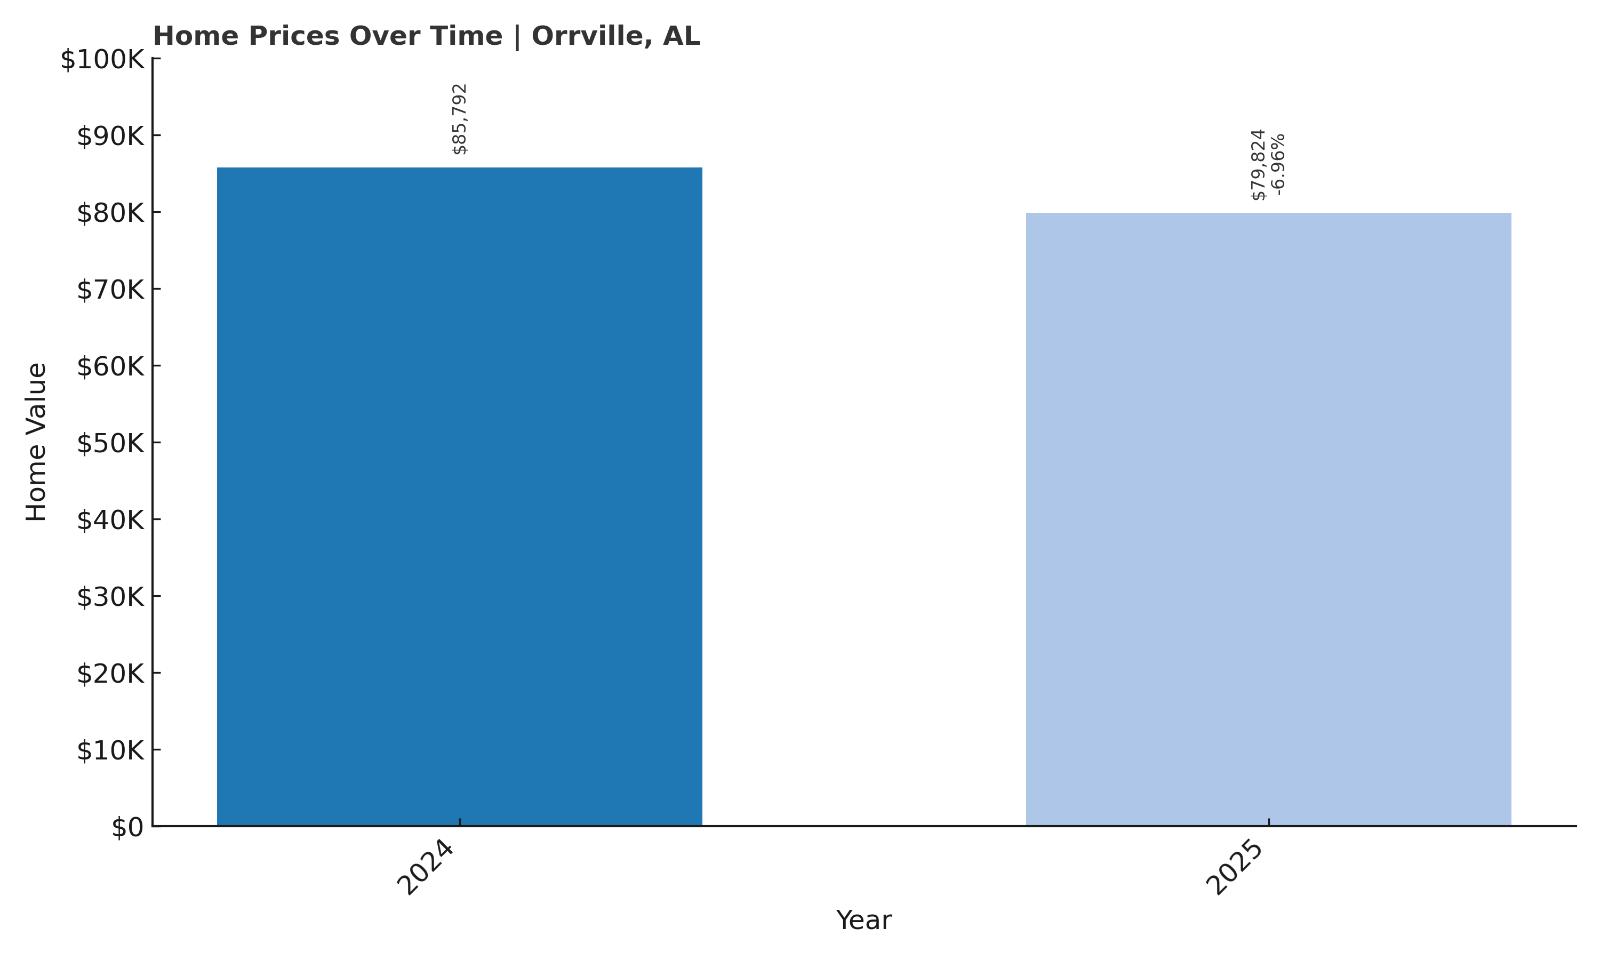
13. Orrville – 7% Home Price Decrease Since 2024
🔥 Would you like to save this?
- 2010: N/A
- 2011: N/A
- 2012: N/A
- 2013: N/A
- 2014: N/A
- 2015: N/A
- 2016: N/A
- 2017: N/A
- 2018: N/A
- 2019: N/A
- 2020: N/A
- 2021: N/A
- 2022: N/A
- 2023: N/A
- 2024: $85,791.53
- 2025: $79,824.28 (-$5,967.25, -6.96% from previous year)
With only two years of available data, Orrville’s market appears to have taken a nearly 7% hit between 2024 and 2025. That kind of drop may be concerning in the short term, but it’s not uncommon in smaller rural towns where a handful of transactions can shift averages quickly. Without a full price history, it’s difficult to assess the long-term trend here, but 2024 values indicate Orrville had recently reached a relatively high point for its market. The decrease in 2025 could be a short-term correction or reflect local economic conditions. Regardless, average home values under $80,000 still make Orrville one of the most affordable towns on this list. If prices stabilize or bounce back, the town may prove a smart buy for those who can accept short-term volatility in exchange for low entry costs.
Orrville – Rural Living with Room to Grow
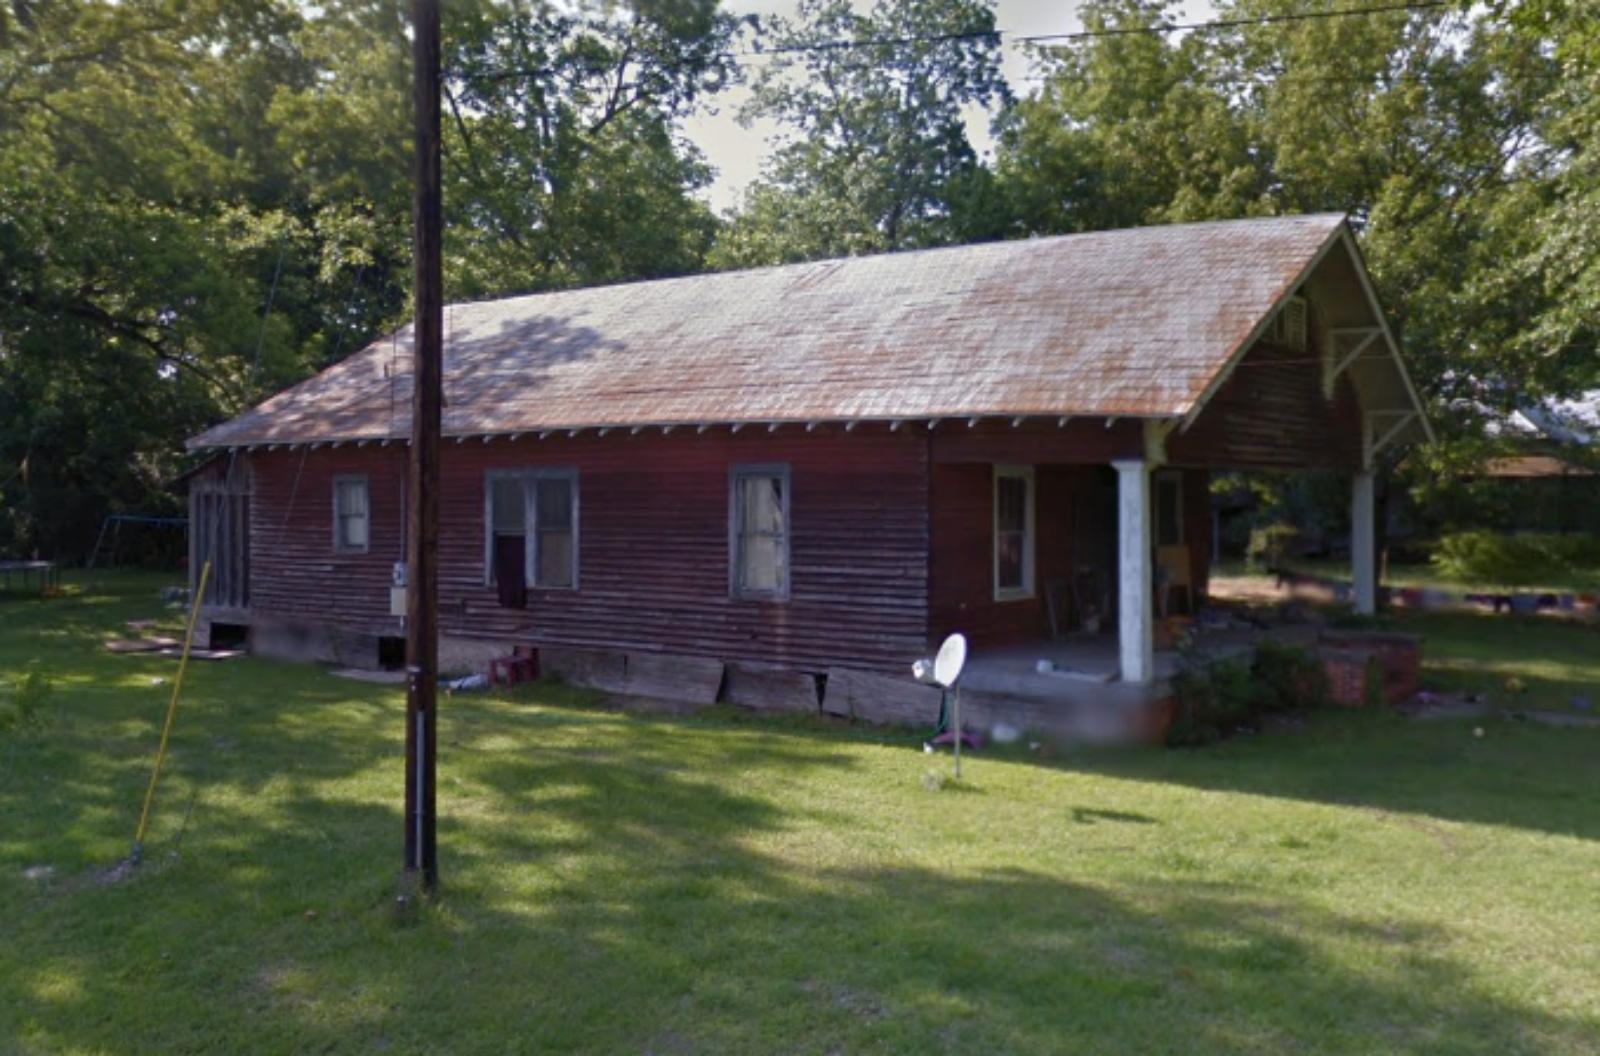
Orrville is a small community in Dallas County, set among Alabama’s rural Black Belt region. The town has a quiet agricultural character and a close-knit population, with limited commercial development but strong local roots. It offers a peaceful alternative for those seeking distance from city congestion, but its location also means fewer amenities and slower economic activity compared to urbanized parts of the state. That said, Orrville’s low housing prices could be a draw for buyers looking to stretch their dollars or acquire property for long-term use or investment.
While recent data shows a price dip, it’s worth noting that in low-volume markets like Orrville, even a few home sales can skew year-over-year averages. The sharp drop may not reflect a true decline in underlying value but rather natural variability in smaller datasets. For those comfortable with a slower pace of life and minimal overhead, Orrville remains a practical and budget-friendly option. If broader trends in rural migration continue, this town may find itself benefiting from renewed interest in quiet, affordable living.
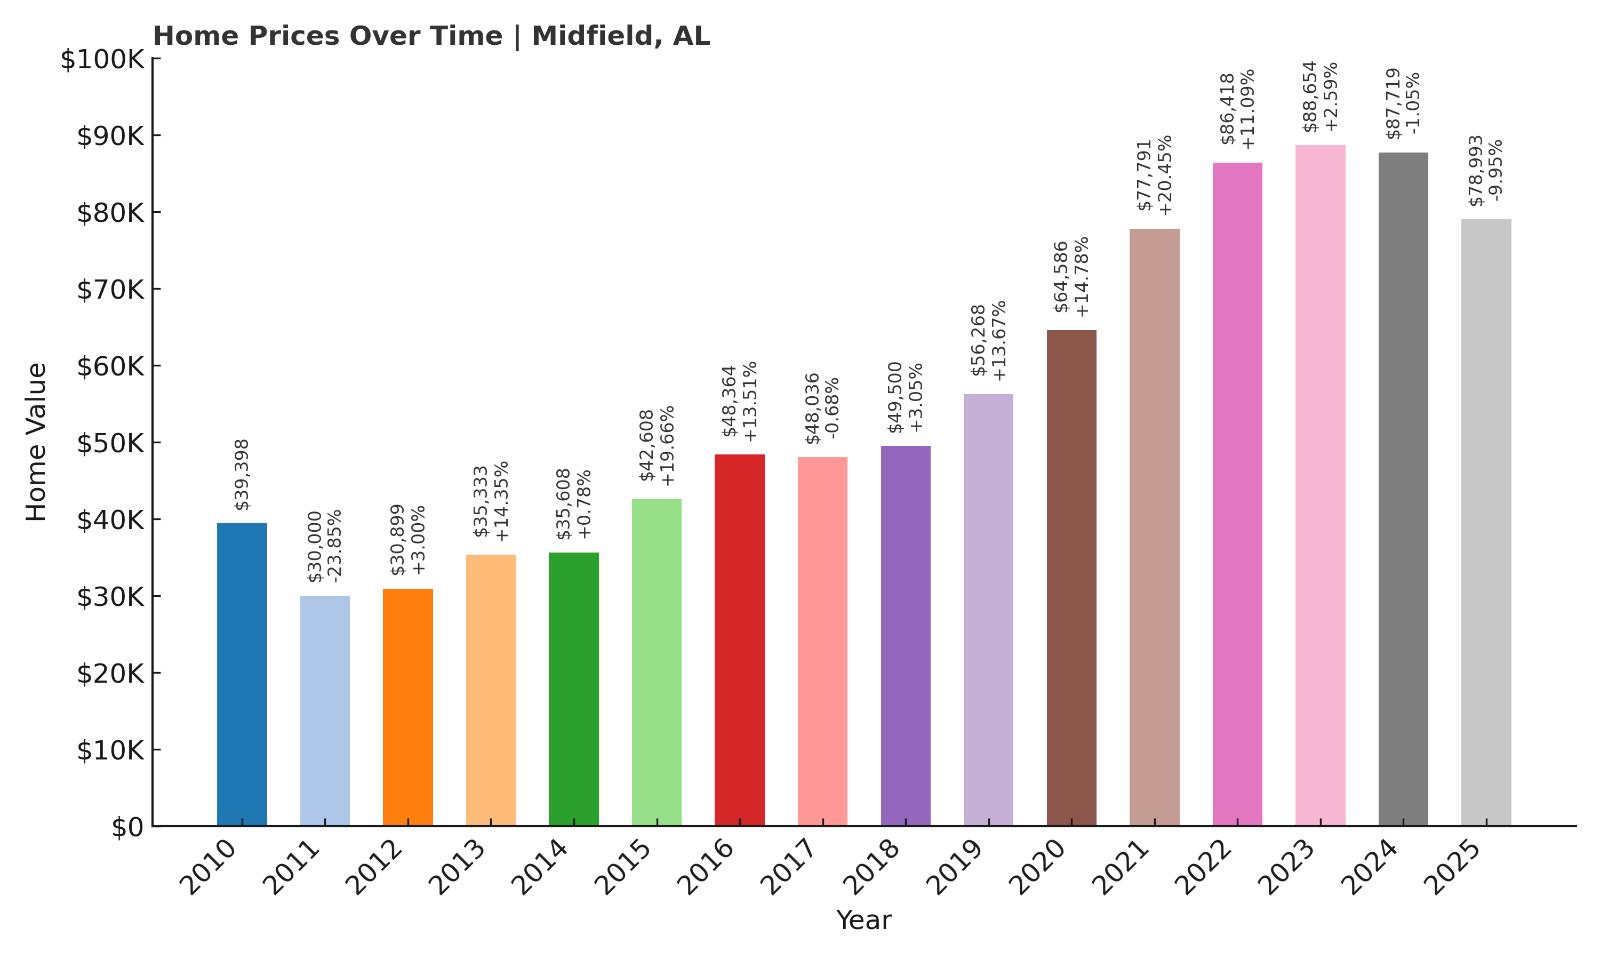
12. Midfield – 101% Home Price Increase Since 2010
- 2010: $39,397.88
- 2011: $29,999.57 (-$9,398.31, -23.85% from previous year)
- 2012: $30,898.99 (+$899.42, +3.00% from previous year)
- 2013: $35,333.27 (+$4,434.28, +14.35% from previous year)
- 2014: $35,608.13 (+$274.87, +0.78% from previous year)
- 2015: $42,607.56 (+$6,999.43, +19.66% from previous year)
- 2016: $48,363.96 (+$5,756.40, +13.51% from previous year)
- 2017: $48,035.86 (-$328.10, -0.68% from previous year)
- 2018: $49,499.77 (+$1,463.91, +3.05% from previous year)
- 2019: $56,267.82 (+$6,768.05, +13.67% from previous year)
- 2020: $64,586.11 (+$8,318.28, +14.78% from previous year)
- 2021: $77,791.23 (+$13,205.13, +20.45% from previous year)
- 2022: $86,418.06 (+$8,626.83, +11.09% from previous year)
- 2023: $88,653.60 (+$2,235.54, +2.59% from previous year)
- 2024: $87,719.42 (-$934.19, -1.05% from previous year)
- 2025: $78,992.81 (-$8,726.60, -9.95% from previous year)
Midfield has seen its home prices more than double since 2010, even with a notable decline in the most recent year. The biggest gains came between 2015 and 2022, when average home values jumped from just over $42,000 to more than $86,000. This growth was especially sharp between 2020 and 2021, when prices surged by over 20%. However, the latest figures show a nearly 10% decline in 2025, possibly indicating a correction following rapid appreciation. Despite the drop, Midfield’s long-term trend remains one of significant upward momentum, especially considering its extremely low base just a decade ago. At under $80,000, the current average price still positions it as a highly affordable location relative to both local and national markets. The overall pattern here reflects a market that grew quickly and is now cooling, but still sits well above historical levels. For value-focused buyers, Midfield could still be a smart long-term bet.
Midfield – Steady Climb in a Birmingham Suburb
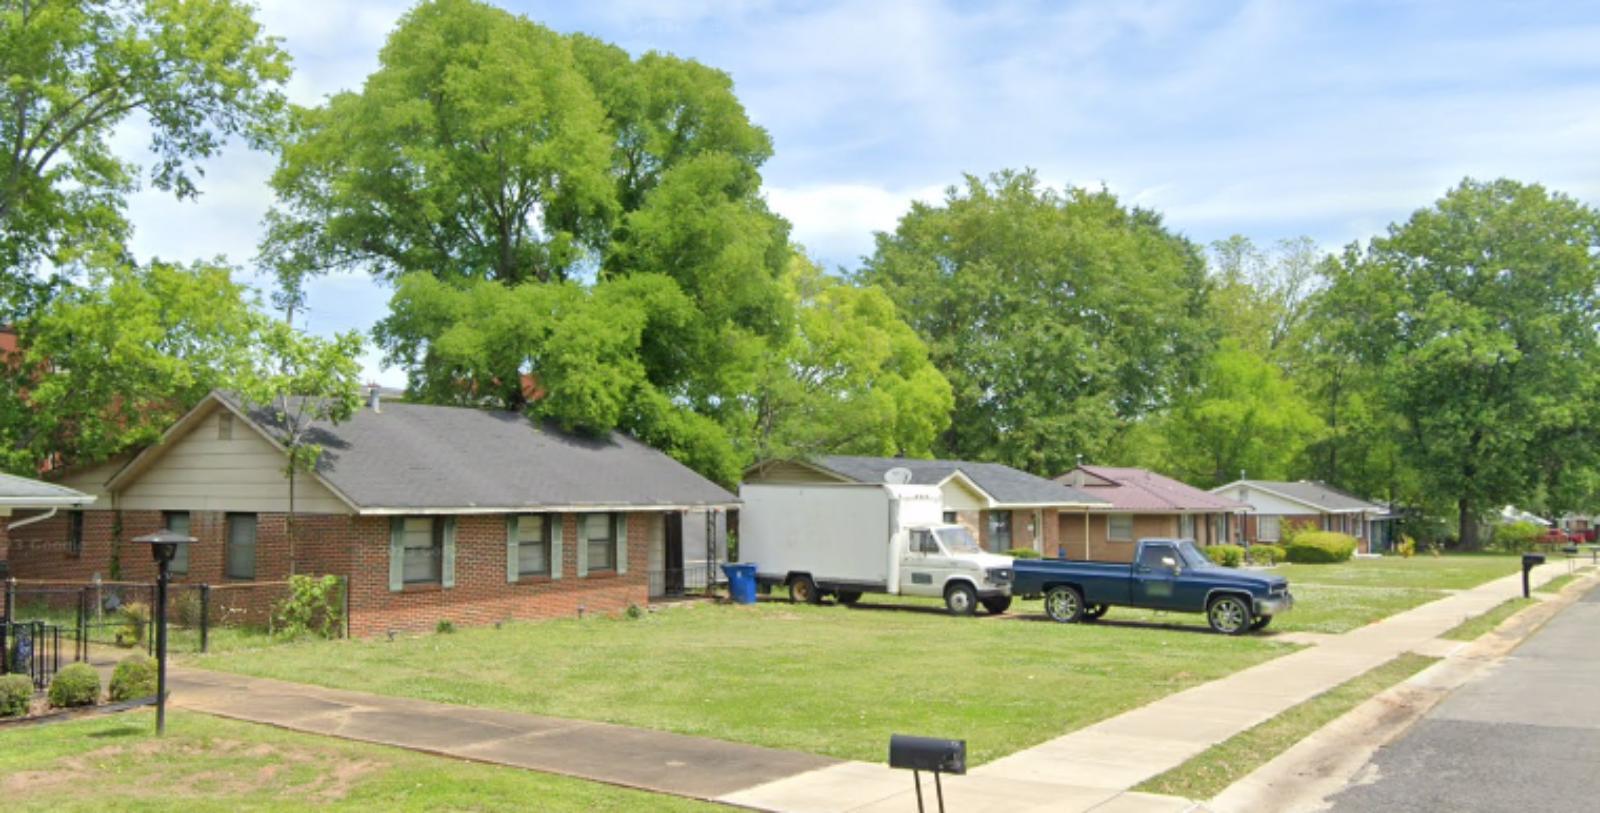
Midfield is a working-class suburb located just southwest of downtown Birmingham, making it a convenient base for commuters and families alike. Despite its proximity to Alabama’s largest city, Midfield has retained much of its own identity, with independent schools, parks, and a tightly woven neighborhood feel. The city has seen moderate investment in infrastructure and community programming over the past decade, which may have helped boost its housing market during the post-recession recovery and pandemic-era real estate boom. Rising prices were likely driven by both investor interest and locals seeking more affordable alternatives to inner-city Birmingham neighborhoods.
Midfield’s affordability and access to I-20/59 make it appealing to buyers who value location but don’t want to pay metro premiums. The 2025 dip may reflect broader housing market adjustments across the region, but it also offers a potential opening for first-time buyers priced out of other suburbs. While it doesn’t boast luxury amenities, Midfield offers a mix of modest homes, walkable blocks, and quick access to employment centers. The combination of long-term price appreciation, a solid commuter location, and recent price softening could make Midfield a smart place to watch in the coming years.
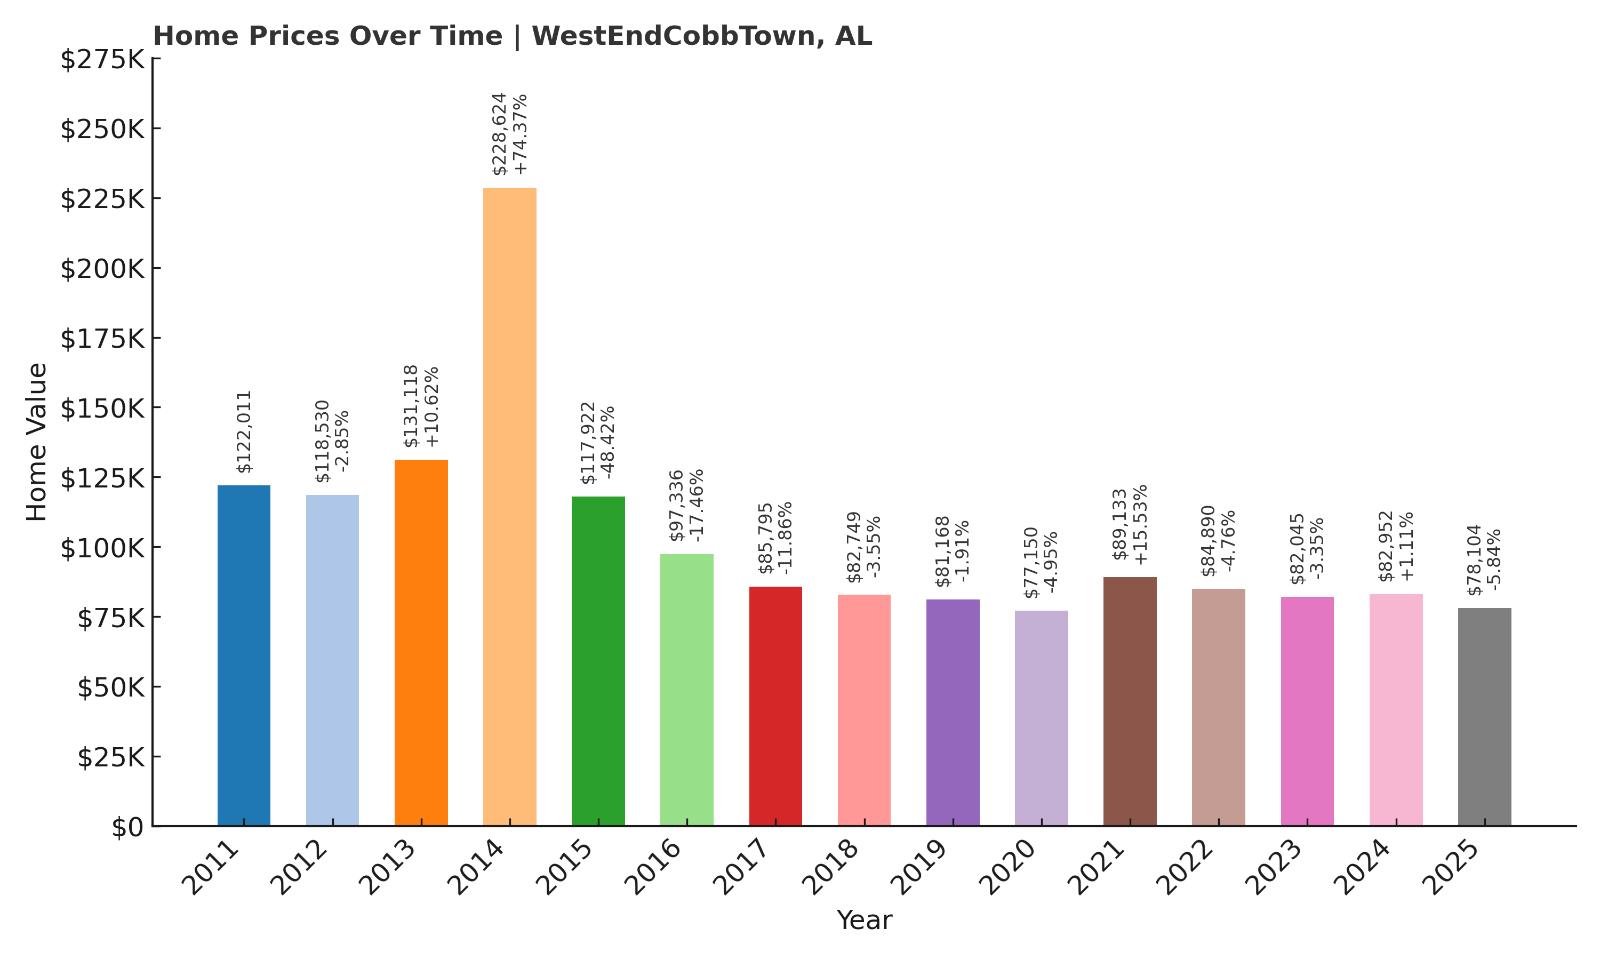
11. West End-Cobb Town – 36% Home Price Decrease Since 2010
- 2010: N/A
- 2011: $122,011.21
- 2012: $118,530.06 (-$3,481.15, -2.85% from previous year)
- 2013: $131,118.35 (+$12,588.30, +10.62% from previous year)
- 2014: $228,624.31 (+$97,505.96, +74.36% from previous year)
- 2015: $117,922.14 (-$110,702.17, -48.42% from previous year)
- 2016: $97,336.28 (-$20,585.86, -17.46% from previous year)
- 2017: $85,795.13 (-$11,541.15, -11.86% from previous year)
- 2018: $82,748.87 (-$3,046.26, -3.55% from previous year)
- 2019: $81,167.50 (-$1,581.37, -1.91% from previous year)
- 2020: $77,150.27 (-$4,017.23, -4.95% from previous year)
- 2021: $89,133.23 (+$11,982.96, +15.53% from previous year)
- 2022: $84,889.72 (-$4,243.50, -4.76% from previous year)
- 2023: $82,045.17 (-$2,844.56, -3.35% from previous year)
- 2024: $82,952.45 (+$907.28, +1.11% from previous year)
- 2025: $78,103.76 (-$4,848.68, -5.85% from previous year)
West End-Cobb Town has had one of the most volatile home price journeys in the state, swinging from a peak of $228,000 in 2014 to $78,000 in 2025. That drop represents a steep 66% fall from its highest point, though the trajectory is less dramatic if you start in 2011 when prices were already declining. The plunge from 2014 to 2015 alone erased over $110,000 in value, likely the result of a one-off market anomaly or data inconsistency. Since 2015, the market has stabilized at lower price points, hovering between $75,000 and $90,000 for most of the past five years. The town saw some recovery in 2021 but has softened again recently. With average prices under $80,000 today, it stands out for affordability, despite its erratic past. Caution may be warranted here, but there’s potential for opportunistic buyers who can weather market swings.
West End-Cobb Town – Market Volatility Meets Location Value
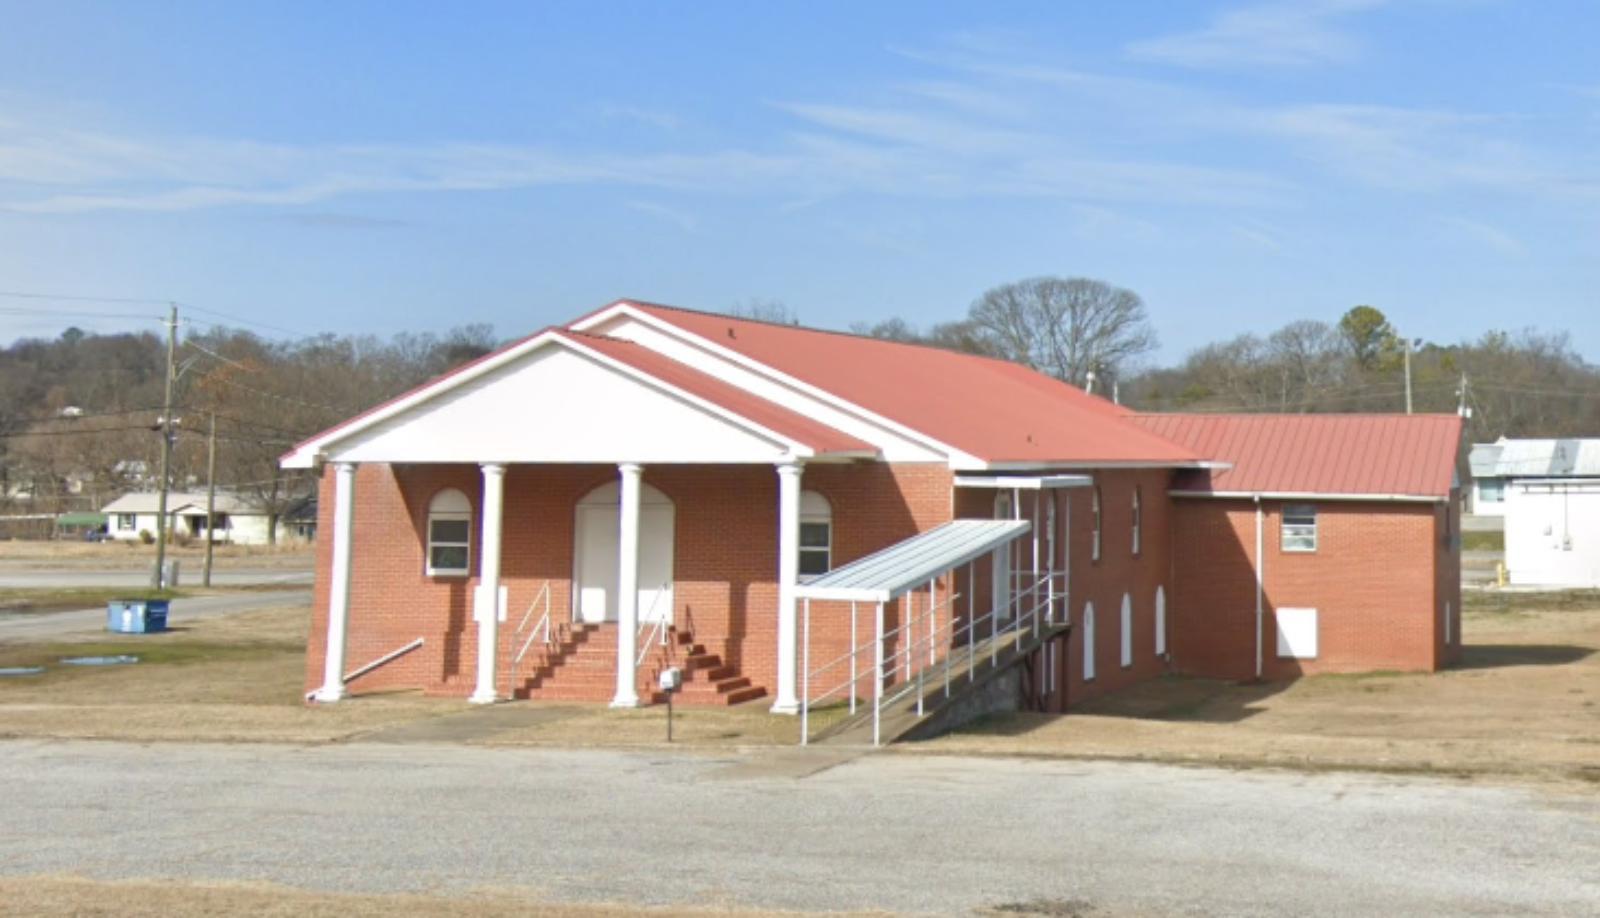
West End-Cobb Town lies in Calhoun County near Anniston and has long been shaped by the rise and fall of the region’s industrial economy. Historically, the area had close ties to manufacturing and defense-related employment, which fueled some of the early housing gains. However, economic shifts over the years have impacted long-term demand, contributing to the town’s price volatility. It remains an area of contrasts: low prices, modest amenities, and a patchwork of neighborhoods that vary in condition and accessibility. Still, its location along U.S. Route 431 offers good connections to Gadsden, Oxford, and Anniston.
The market here may not be ideal for quick-flip investments, but long-term buyers seeking bargain entry points could find value in carefully selected properties. The dramatic pricing swings point to a market in flux, but one that may be overdue for new attention. If local development initiatives or employment growth resume, West End-Cobb Town could become more stable in years to come. For now, it remains one of the most affordable towns in Alabama—with the caveat that its market history is not for the faint of heart.
10. Tarrant – 81% Home Price Increase Since 2010
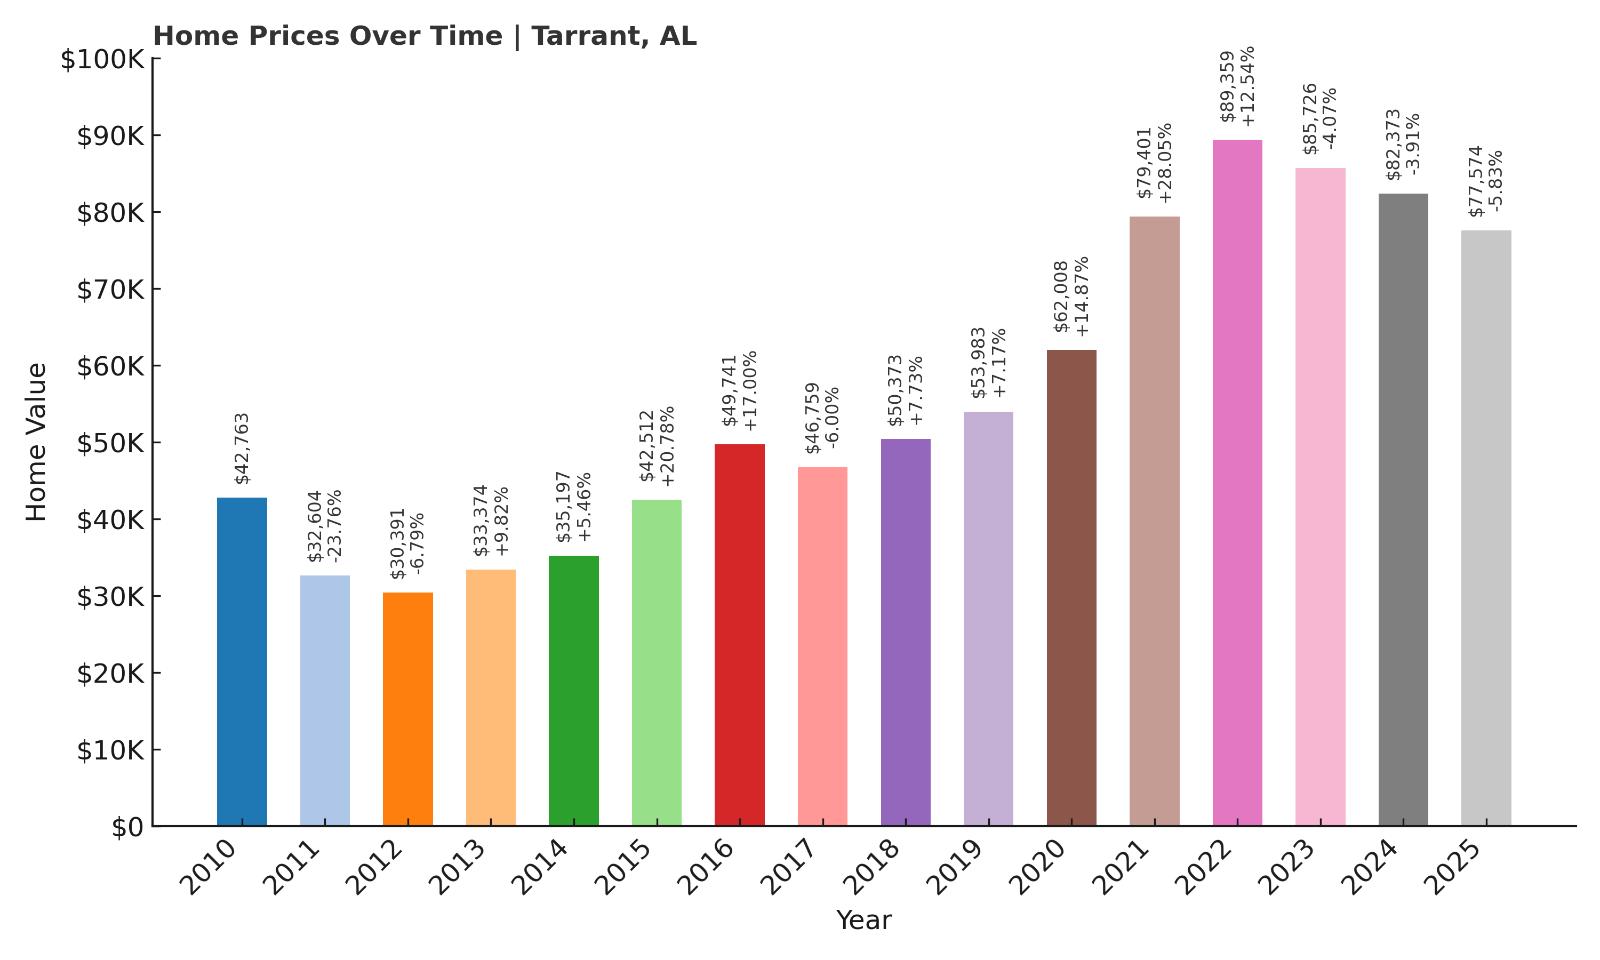
- 2010: $42,762.62
- 2011: $32,604.22 (-$10,158.40, -23.76% from previous year)
- 2012: $30,391.34 (-$2,212.88, -6.79% from previous year)
- 2013: $33,374.12 (+$2,982.78, +9.81% from previous year)
- 2014: $35,197.05 (+$1,822.93, +5.46% from previous year)
- 2015: $42,511.84 (+$7,314.80, +20.78% from previous year)
- 2016: $49,740.53 (+$7,228.69, +17.00% from previous year)
- 2017: $46,759.49 (-$2,981.04, -5.99% from previous year)
- 2018: $50,373.47 (+$3,613.98, +7.73% from previous year)
- 2019: $53,982.79 (+$3,609.32, +7.17% from previous year)
- 2020: $62,007.55 (+$8,024.76, +14.87% from previous year)
- 2021: $79,400.53 (+$17,392.98, +28.05% from previous year)
- 2022: $89,358.92 (+$9,958.38, +12.54% from previous year)
- 2023: $85,725.97 (-$3,632.95, -4.07% from previous year)
- 2024: $82,372.88 (-$3,353.09, -3.91% from previous year)
- 2025: $77,574.28 (-$4,798.59, -5.83% from previous year)
From 2010 to 2025, Tarrant’s home values grew by about 81%, though the past few years have seen a noticeable cooling off. The town’s biggest surge occurred between 2020 and 2022, when home prices jumped by over $27,000 in just two years. Before that, the post-recession years were rocky, with values dropping steeply in 2011 and 2012. Since bottoming out in the early 2010s, the town experienced a consistent climb—albeit with a few small setbacks—peaking in 2022 before entering a gentle decline. The past three years show a gradual loss of value, with a nearly 6% dip between 2024 and 2025, bringing average home prices to around $77,500. Despite these recent slides, current prices still reflect a large gain from a decade and a half ago. Tarrant’s historical pattern resembles a boom-followed-by-balance cycle typical of working-class suburbs that benefited from pandemic-era market shifts. For long-term buyers who missed the 2020 peak, this year could represent a new entry point at a more reasonable price.
Tarrant – A Rebounding City with Price Stability Challenges

Tarrant is a compact industrial city northeast of Birmingham that has seen waves of change over the past century. Once anchored by steel and manufacturing, the town has worked to reimagine itself amid shifting economic tides. While it hasn’t fully gentrified or revitalized, its location remains attractive to those priced out of Birmingham proper. Tarrant’s proximity to I-59, the airport, and key job hubs helps sustain demand for its affordable housing. Its neighborhoods include modest mid-century homes, many of which have seen renovations or updates during the last decade as interest from budget-conscious buyers and investors has grown. Still, like many older suburbs, Tarrant has its challenges: inconsistent infrastructure improvements, limited retail amenities, and a need for continued reinvestment.
What’s striking about Tarrant is the resilience of its real estate market in spite of those headwinds. Prices rose substantially from 2015 through 2022, and even with recent declines, they remain well above historical lows. For families or individuals seeking affordable homeownership within a few minutes’ drive of downtown Birmingham, Tarrant offers a rare opportunity. While the town still faces socioeconomic hurdles, it has become more attractive to buyers looking for affordability without straying too far from urban life. Continued price softening could make it an even better value in the near term, especially for those ready to invest in a community with upside potential and proximity on its side.
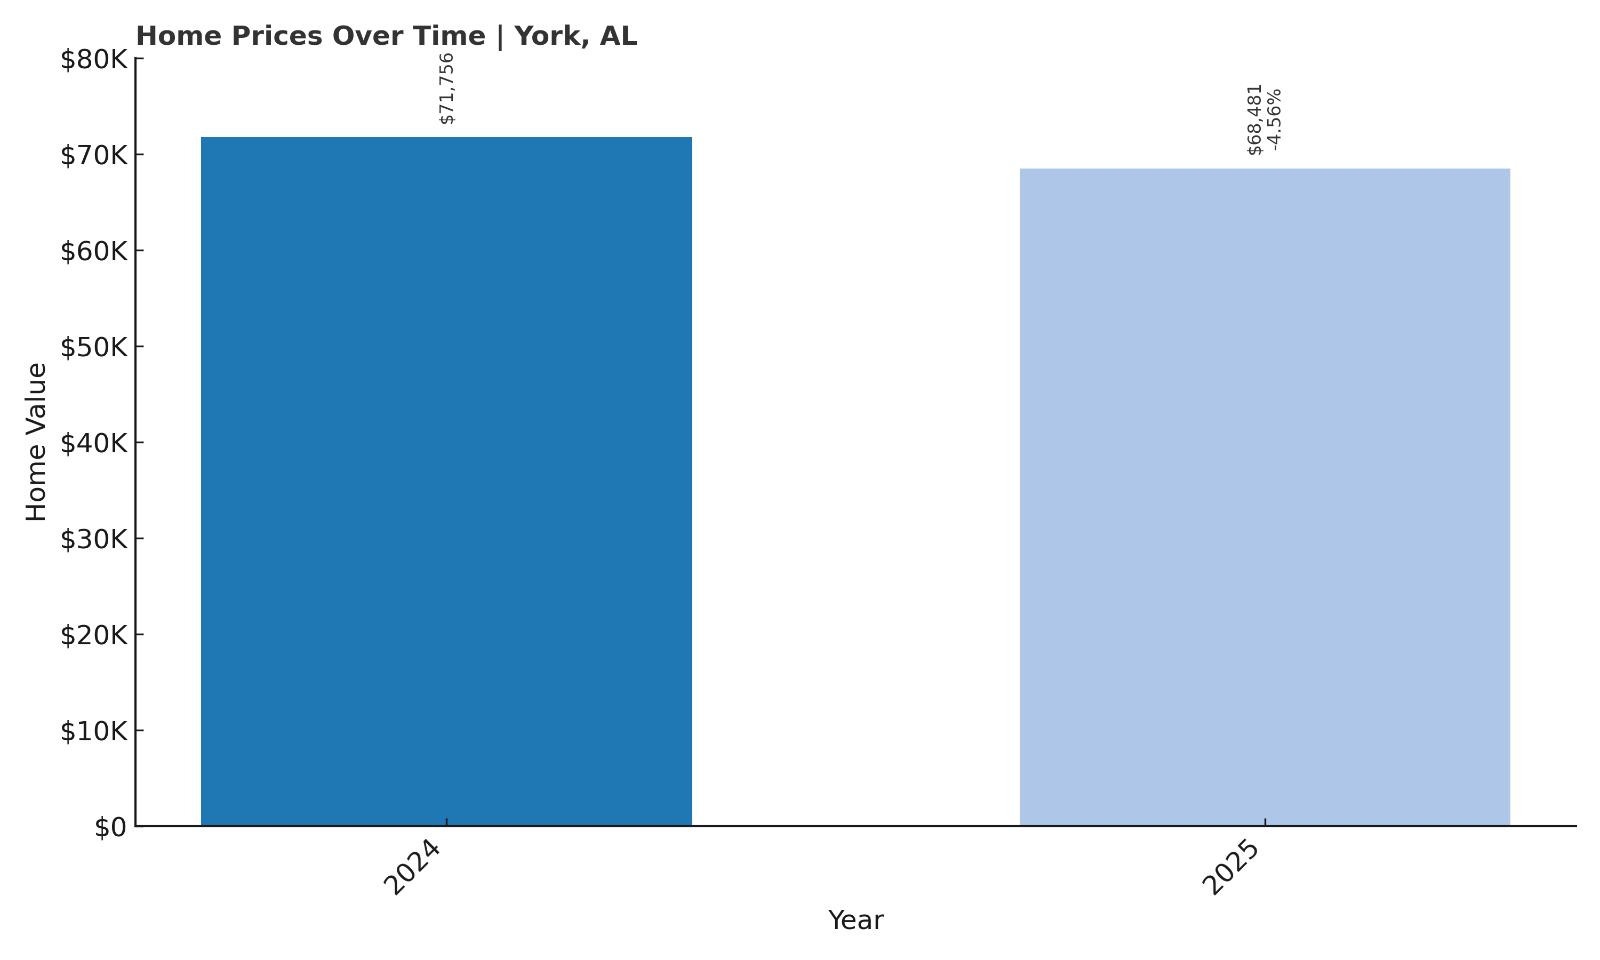
9. York – 5% Home Price Decrease Since 2024
- 2010: N/A
- 2011: N/A
- 2012: N/A
- 2013: N/A
- 2014: N/A
- 2015: N/A
- 2016: N/A
- 2017: N/A
- 2018: N/A
- 2019: N/A
- 2020: N/A
- 2021: N/A
- 2022: N/A
- 2023: N/A
- 2024: $71,756.06
- 2025: $68,480.60 (-$3,275.46, -4.56% from previous year)
York’s market data is limited, but the numbers we do have point to a modest recent decline. In 2025, home prices fell by just over 4.5% from the previous year, bringing the average down to about $68,500. Without historical data before 2024, it’s difficult to assess whether this dip marks a correction or simply reflects low transaction volume in a small town. However, with prices staying below $70,000, York remains one of the most affordable places in Alabama for homebuyers. A single year of decline doesn’t necessarily indicate weakness—especially in a rural town where a few high- or low-priced transactions can dramatically affect averages. It’s possible York had an unusually high price point in 2024, and the 2025 figure is more typical of its market baseline. Either way, the current number supports the town’s inclusion on this list of most affordable places. The price level may also offer upside if regional infrastructure or population trends shift in its favor.
York – Small-Town Affordability in West Alabama
York is located in Sumter County, near the Mississippi state line, and it embodies the rural charm and quiet pace of west Alabama’s Black Belt region. With a population under 2,500, it’s the kind of place where people know their neighbors and life moves slower than in the state’s metro hubs. The town has faced its share of economic challenges, particularly with job scarcity and aging infrastructure, but its housing market remains one of the most accessible in the state. The historic downtown area reflects a mix of architectural styles, and the city has made efforts in recent years to improve civic life through arts programs and public events. Proximity to the University of West Alabama in Livingston provides some educational and cultural spillover, which may support stability in the long term.
While York may not have big-box retailers or major employers, it offers something else: peace, affordability, and a sense of rootedness. For remote workers or retirees who don’t need daily access to urban services, York offers an incredibly low barrier to entry. The housing stock includes both fixer-uppers and move-in-ready properties at a fraction of what buyers would pay even in Alabama’s larger towns. If you’re looking to downsize or escape high housing costs without giving up homeownership, York is one of the rare places where under $70,000 still buys you a home. As broadband access expands in rural areas, towns like York may be poised to attract new residents seeking low-cost living with community appeal.
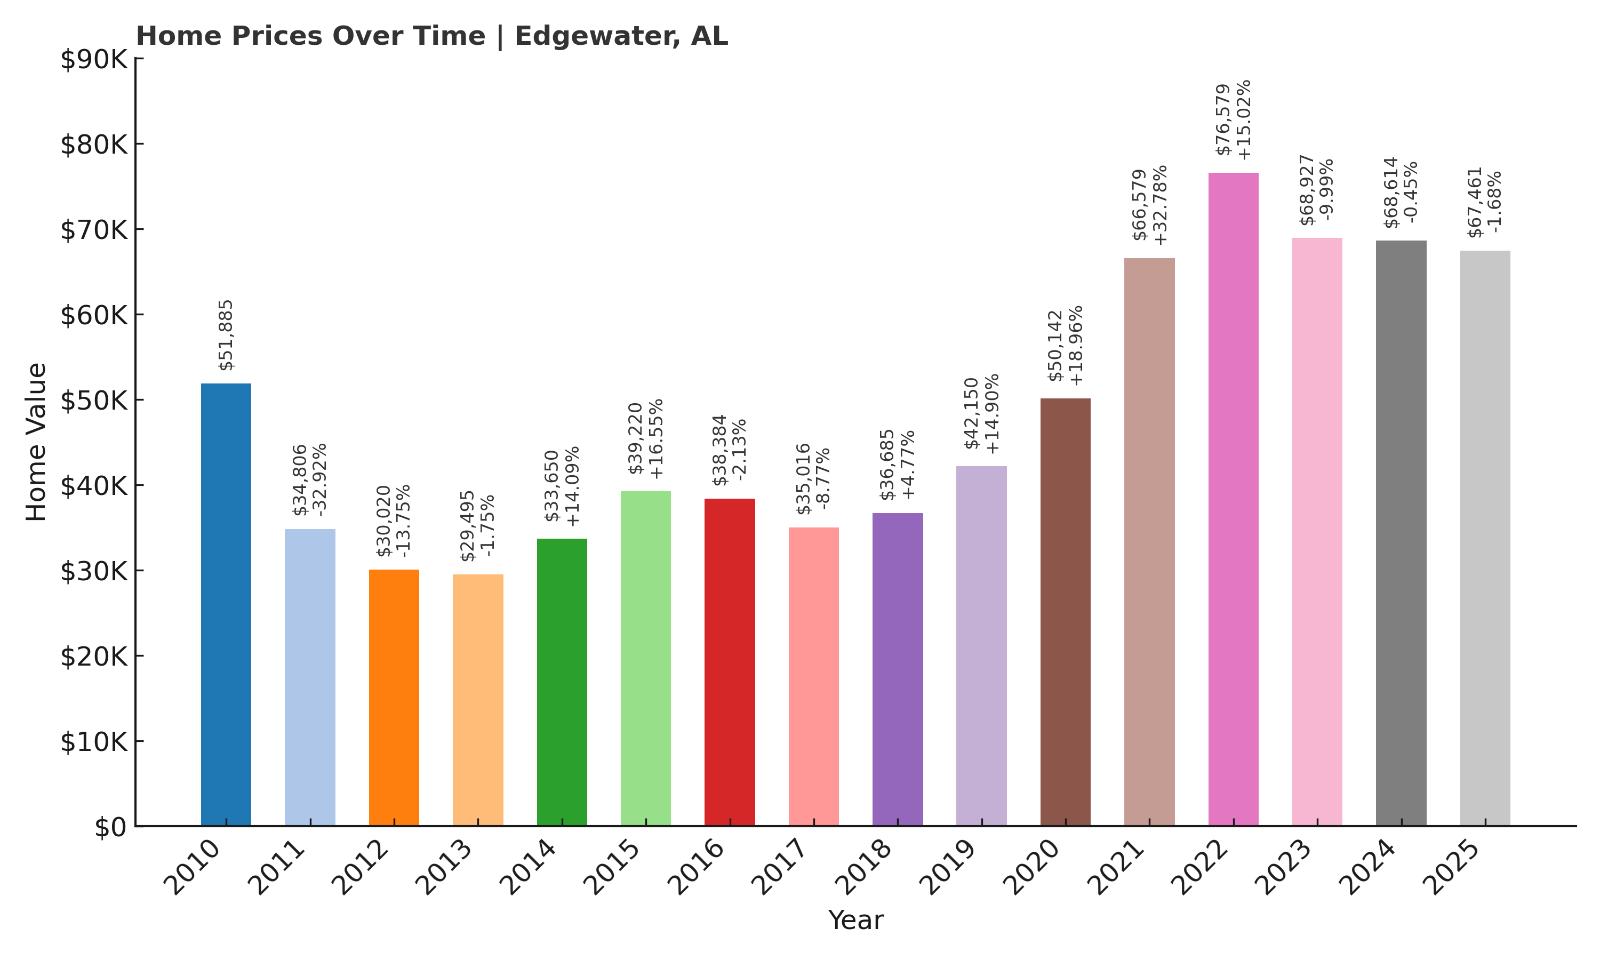
8. Edgewater – 30% Home Price Increase Since 2010
- 2010: $51,884.65
- 2011: $34,806.12 (-$17,078.53, -32.92% from previous year)
- 2012: $30,020.16 (-$4,785.96, -13.75% from previous year)
- 2013: $29,494.64 (-$525.52, -1.75% from previous year)
- 2014: $33,650.41 (+$4,155.78, +14.09% from previous year)
- 2015: $39,219.63 (+$5,569.22, +16.55% from previous year)
- 2016: $38,384.23 (-$835.40, -2.13% from previous year)
- 2017: $35,015.95 (-$3,368.28, -8.78% from previous year)
- 2018: $36,685.14 (+$1,669.20, +4.77% from previous year)
- 2019: $42,149.82 (+$5,464.67, +14.90% from previous year)
- 2020: $50,141.98 (+$7,992.16, +18.96% from previous year)
- 2021: $66,579.43 (+$16,437.45, +32.78% from previous year)
- 2022: $76,579.16 (+$9,999.73, +15.02% from previous year)
- 2023: $68,926.70 (-$7,652.45, -9.99% from previous year)
- 2024: $68,614.10 (-$312.61, -0.45% from previous year)
- 2025: $67,460.51 (-$1,153.59, -1.68% from previous year)
Edgewater’s home prices have increased by about 30% since 2010, despite some sharp ups and downs along the way. After a brutal decline in the early 2010s, the market began recovering steadily by 2015. The biggest leaps came between 2019 and 2022, when home values jumped from around $42,000 to over $76,000. That kind of rapid appreciation isn’t typical for such a small community, but Edgewater experienced it due to surging regional demand and investor interest in affordable areas close to Birmingham. Since then, the market has been gradually correcting, with moderate declines in each of the last three years. Prices today hover around $67,000—well off the 2022 peak, but still far above the town’s lowest point in the early 2010s. Overall, Edgewater’s housing market tells a story of recovery, expansion, and recalibration. Its current affordability makes it a worthwhile candidate for budget-minded buyers seeking proximity to urban centers.
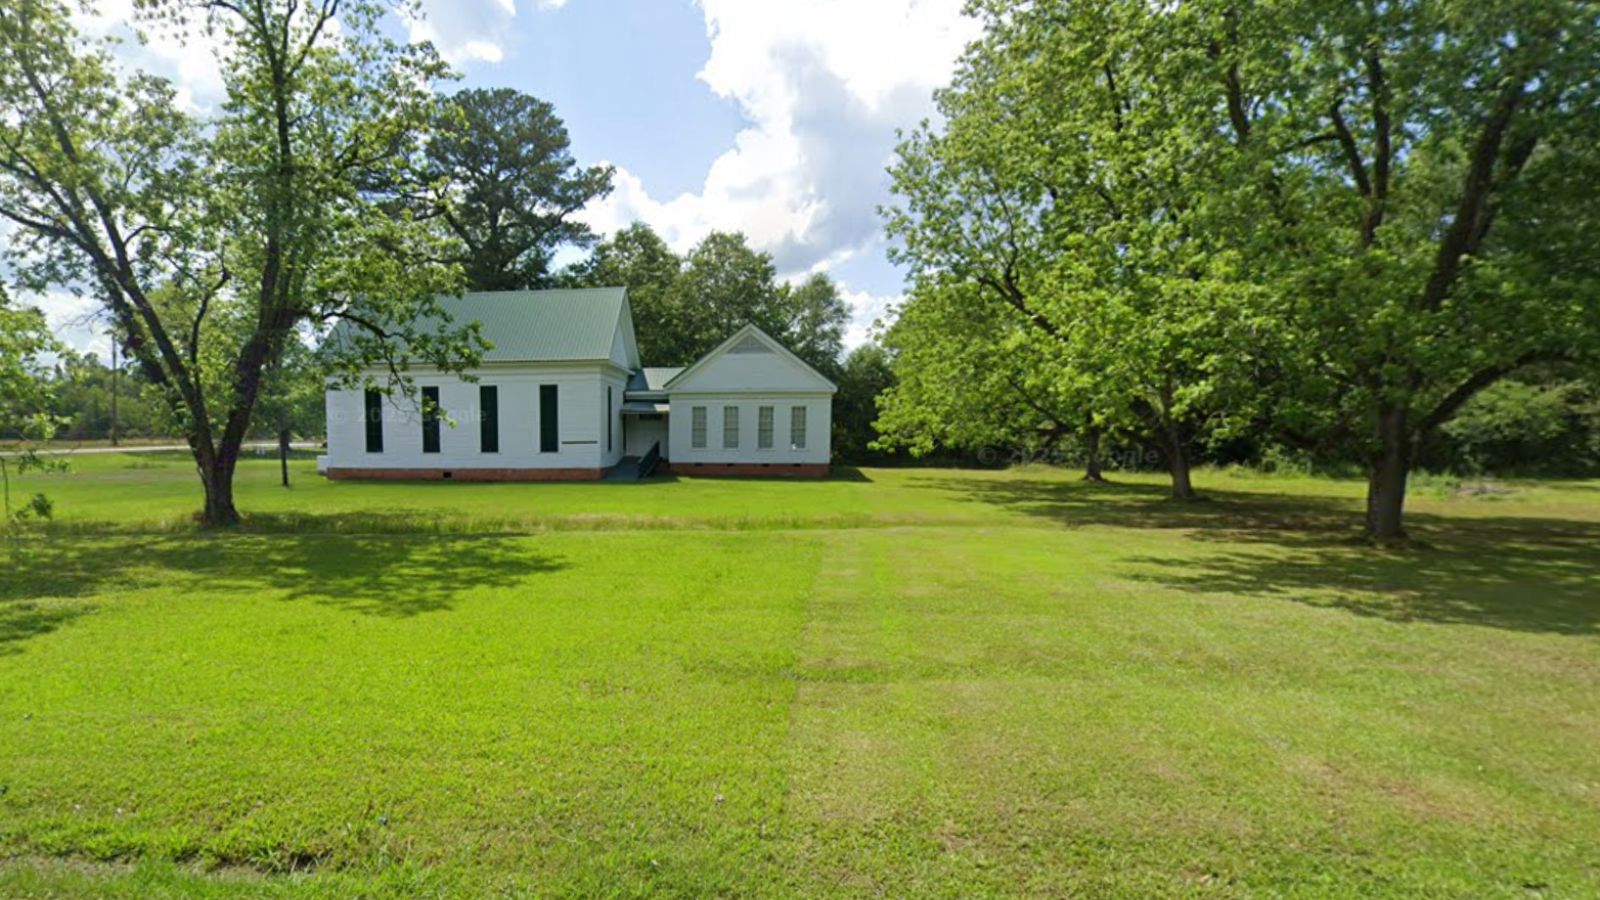
Edgewater – Affordable Living Near the Metro Edge
Edgewater is located in Jefferson County, just a short drive from downtown Birmingham. Despite being close to Alabama’s largest metro, it has retained a quiet, residential feel that appeals to families and retirees looking for low-cost alternatives to city living. The area was once shaped by the mining industry, and its post-industrial transformation has been slow but steady. Today, Edgewater offers mostly single-family homes, some with large yards, in a peaceful environment with light traffic and limited commercial activity. While it lacks some of the amenities of nearby suburbs, the town’s proximity to larger hubs like Forestdale and Birmingham fills in those gaps.
The sharp rise in prices during 2020–2022 likely reflected a broader regional trend where demand spilled over from Birmingham into smaller nearby markets. As that demand cooled, Edgewater experienced a correction—but current prices remain far from distressed. For buyers, the decline offers an opportunity to get into a historically undervalued area with good access to employment, education, and transportation. Edgewater remains one of the least expensive housing markets in Jefferson County and may appeal to those looking to buy their first home, downsize affordably, or invest with an eye on future stability.
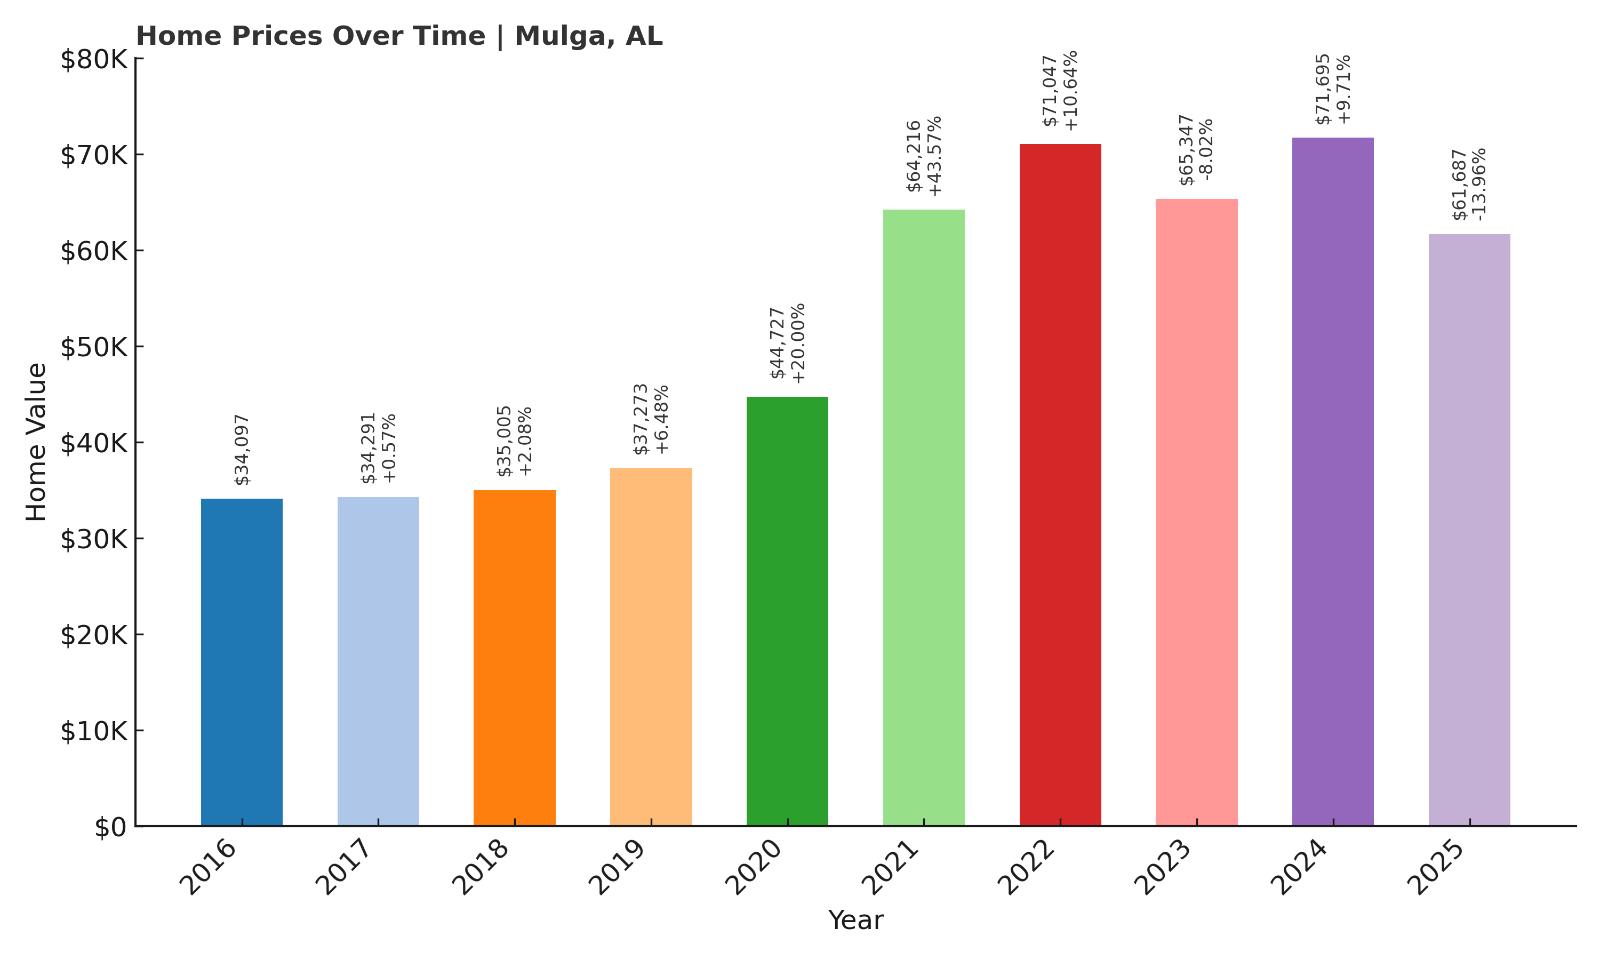
7. Mulga – 81% Home Price Increase Since 2016
🔥 Would you like to save this?
- 2010: N/A
- 2011: N/A
- 2012: N/A
- 2013: N/A
- 2014: N/A
- 2015: N/A
- 2016: $34,096.61
- 2017: $34,290.92 (+$194.30, +0.57% from previous year)
- 2018: $35,004.75 (+$713.83, +2.08% from previous year)
- 2019: $37,273.16 (+$2,268.42, +6.48% from previous year)
- 2020: $44,726.99 (+$7,453.83, +20.00% from previous year)
- 2021: $64,216.32 (+$19,489.33, +43.57% from previous year)
- 2022: $71,047.14 (+$6,830.82, +10.64% from previous year)
- 2023: $65,347.38 (-$5,699.75, -8.02% from previous year)
- 2024: $71,694.72 (+$6,347.34, +9.71% from previous year)
- 2025: $61,686.74 (-$10,007.99, -13.96% from previous year)
Mulga’s housing market has seen an 81% increase since 2016, even with a sharp decline in 2025. The biggest boom came between 2020 and 2021, when average home prices skyrocketed by over 43%—a huge leap for such a small town. After a brief stumble in 2023, values rebounded again in 2024 before falling hard in the most recent year, possibly reflecting a market correction after rapid growth. Still, even with the 2025 drop, prices remain well above pre-pandemic levels. At just over $61,000, Mulga remains one of the most affordable towns on this list, yet its earlier growth signals that demand had been heating up. The market here appears to have been heavily influenced by pandemic-era migration and investor interest, followed by volatility as conditions normalized. For buyers who missed the previous run-up, the recent dip could represent a new entry point in a town with long-term value potential.
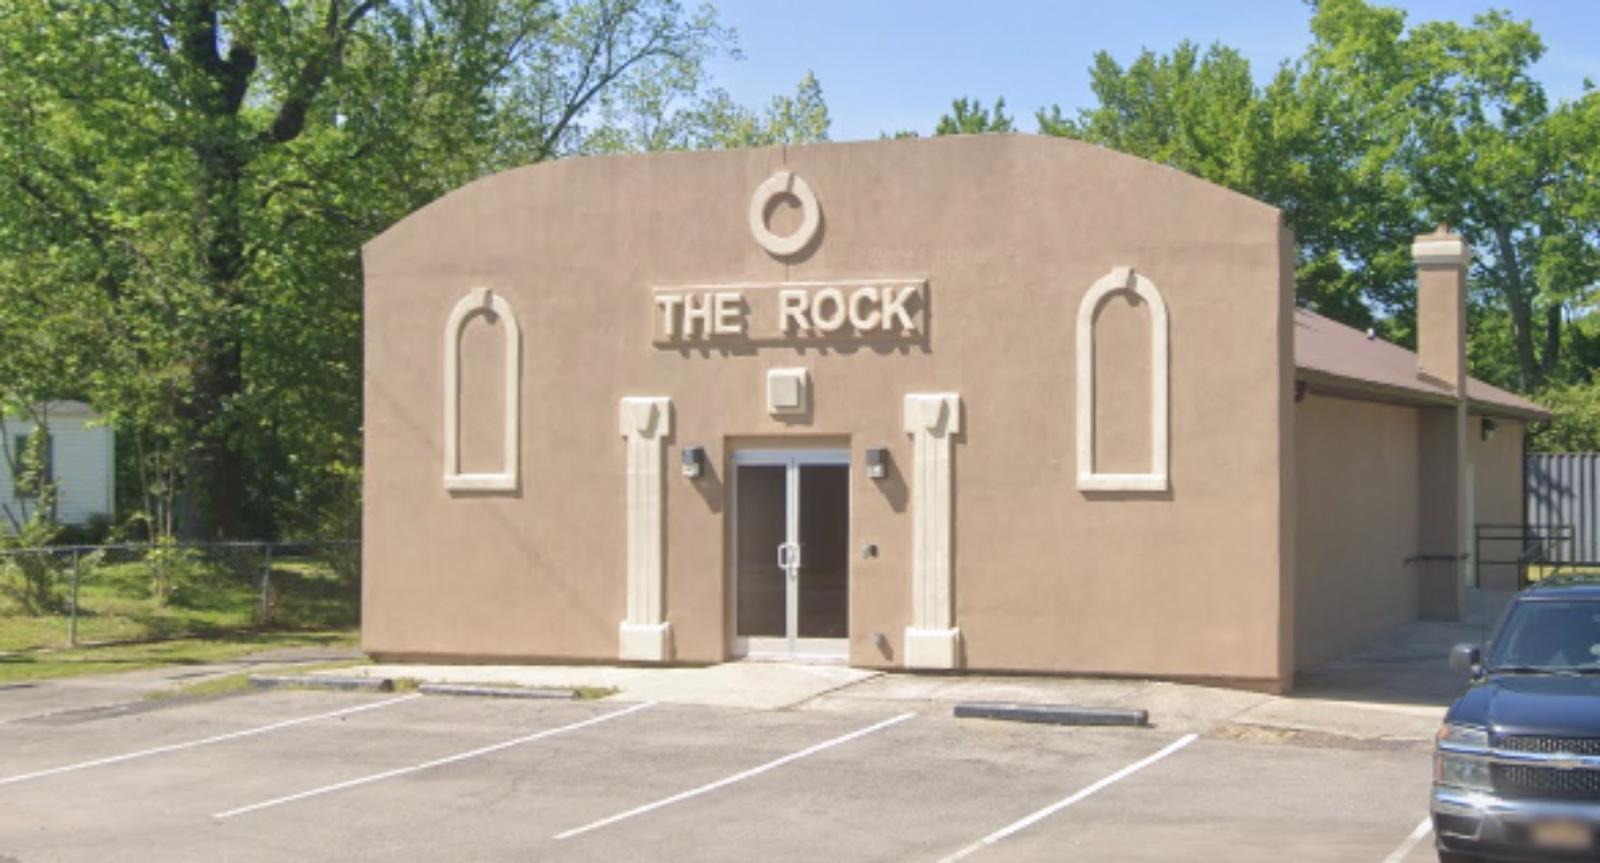
Mulga – A Tiny Town With Big Price Swings
Mulga is a very small community in western Jefferson County, just northwest of Birmingham. With a population of under 1,000 people, it’s a quiet place defined by modest homes, rural surroundings, and a strong sense of local identity. Historically a coal-mining area, Mulga has transitioned into a residential town with limited commercial development. Its appeal lies in simplicity and low cost—both in terms of home prices and general cost of living. The town is served by nearby schools and has reasonable access to major roads, including U.S. Route 78 and I-22, making it viable for commuters who want distance from the metro core but still need convenience.
Mulga’s housing market saw a remarkable surge during the early 2020s, likely spurred by a mix of investor attention and pandemic-related housing shifts. As buyers looked further afield from city centers, towns like Mulga experienced sudden upward pressure on prices. That said, with a nearly 14% drop in 2025, the town is now more affordable again—and still sits above its pre-boom values. While services and infrastructure are limited compared to larger suburbs, Mulga remains an attractive option for low-income buyers, rural enthusiasts, or investors seeking long-term gains from undervalued property. Its price history reflects how even the smallest towns have been swept up in national housing trends.
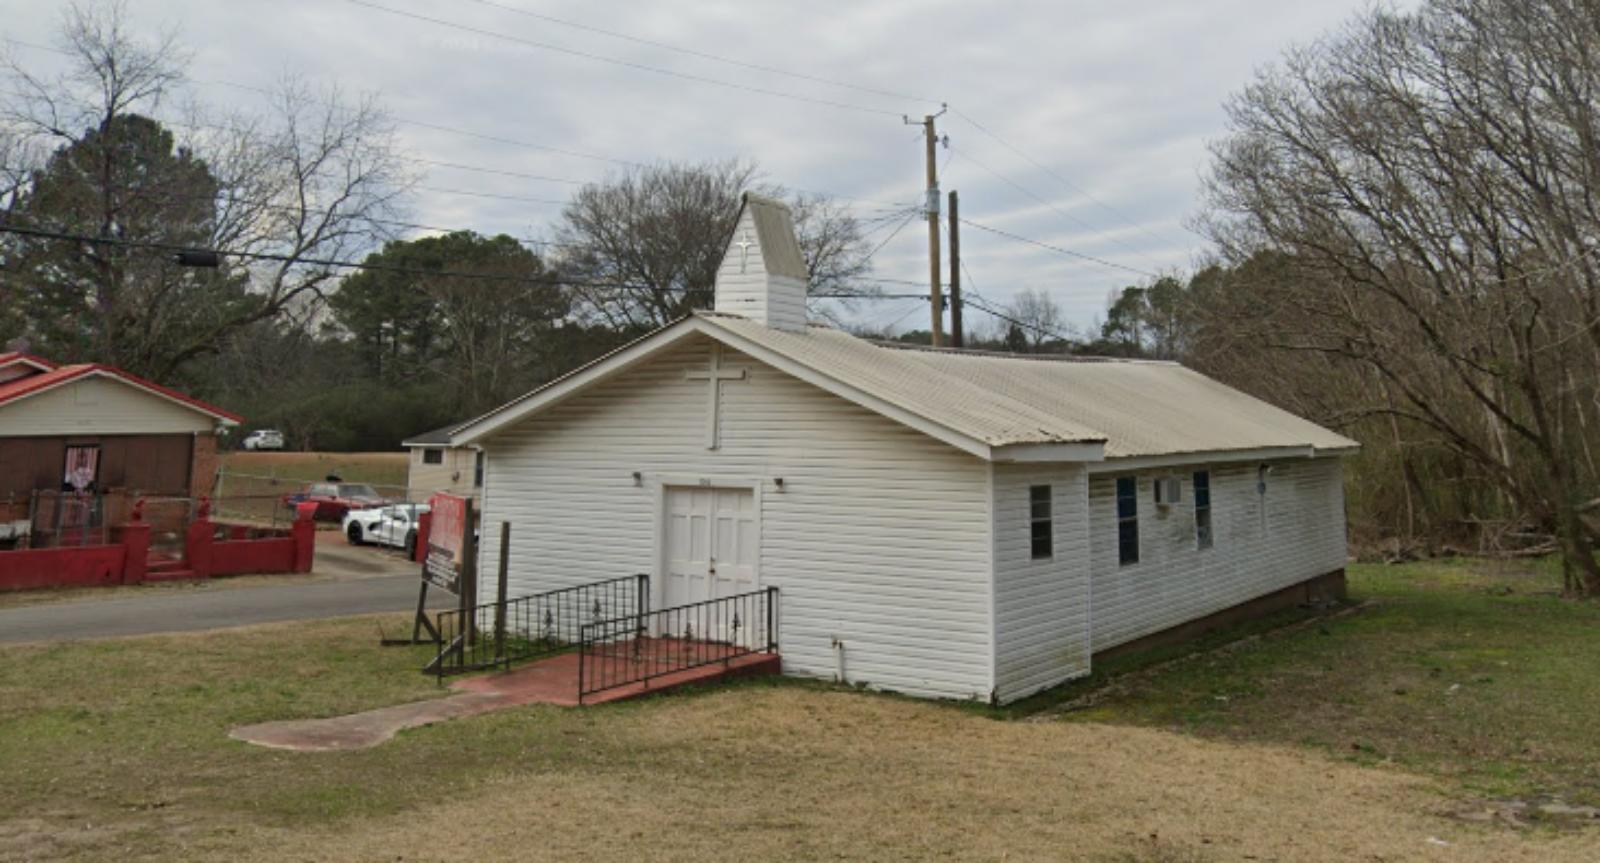
6. McDonald Chapel – 20% Home Price Increase Since 2010
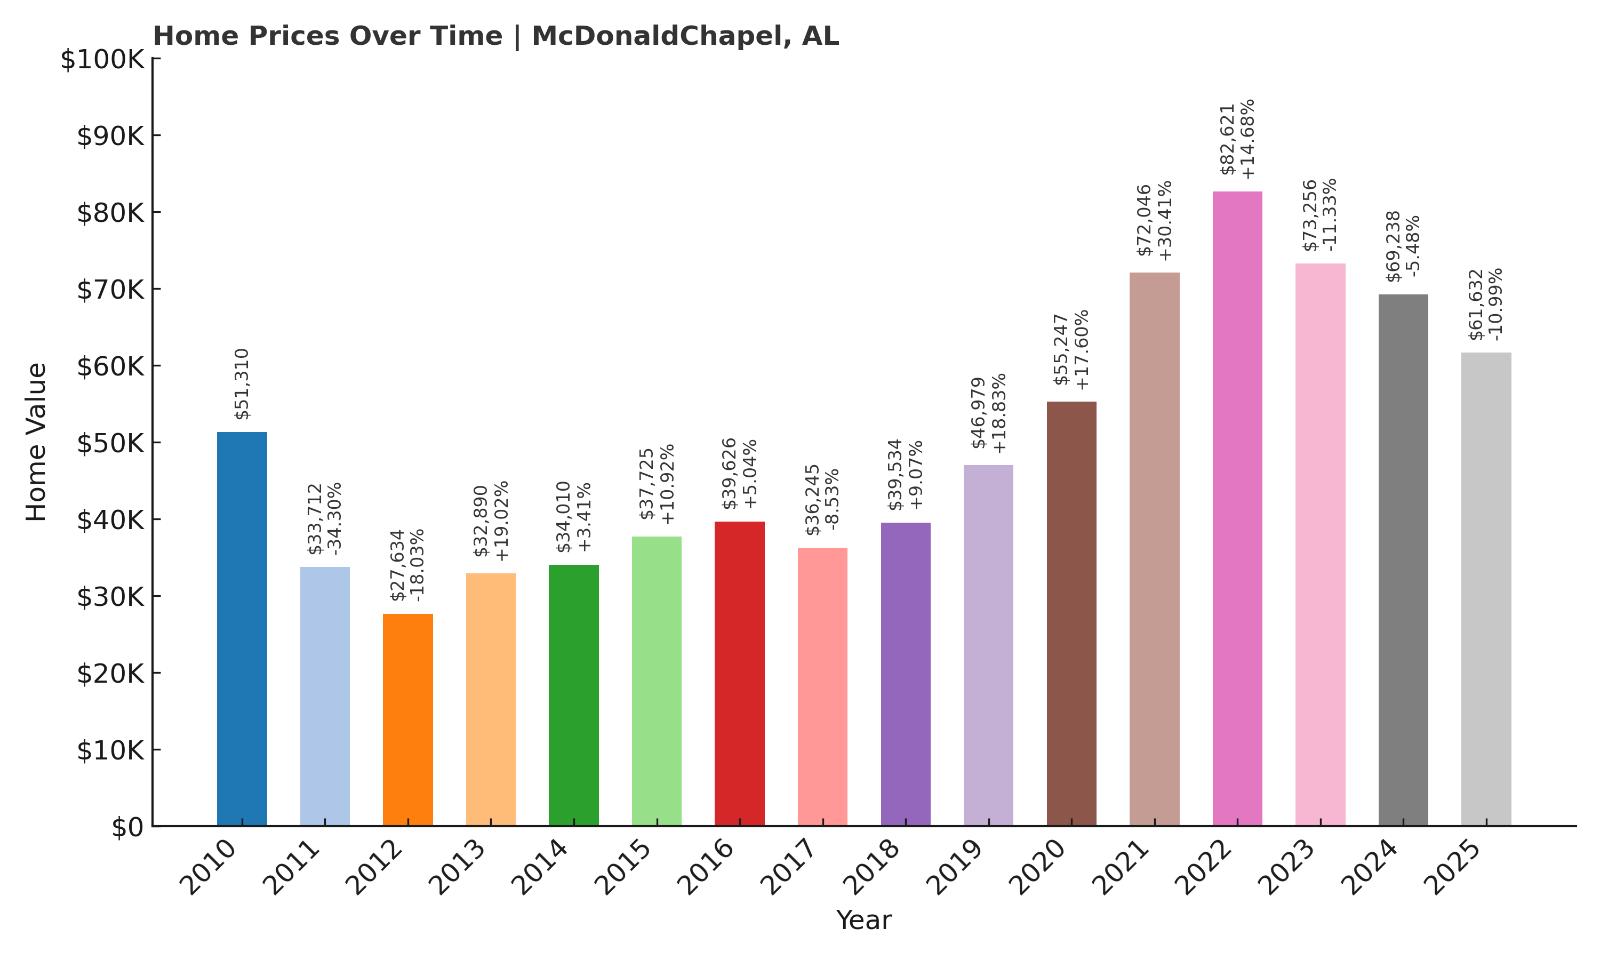
- 2010: $51,310.06
- 2011: $33,712.04 (-$17,598.01, -34.30% from previous year)
- 2012: $27,634.03 (-$6,078.01, -18.03% from previous year)
- 2013: $32,889.66 (+$5,255.63, +19.02% from previous year)
- 2014: $34,009.53 (+$1,119.86, +3.40% from previous year)
- 2015: $37,725.09 (+$3,715.56, +10.93% from previous year)
- 2016: $39,625.95 (+$1,900.86, +5.04% from previous year)
- 2017: $36,245.24 (-$3,380.72, -8.53% from previous year)
- 2018: $39,534.39 (+$3,289.16, +9.07% from previous year)
- 2019: $46,978.87 (+$7,444.47, +18.83% from previous year)
- 2020: $55,246.90 (+$8,268.03, +17.60% from previous year)
- 2021: $72,045.65 (+$16,798.75, +30.41% from previous year)
- 2022: $82,621.17 (+$10,575.52, +14.68% from previous year)
- 2023: $73,256.05 (-$9,365.11, -11.34% from previous year)
- 2024: $69,238.42 (-$4,017.63, -5.48% from previous year)
- 2025: $61,632.01 (-$7,606.42, -10.99% from previous year)
McDonald Chapel has had a turbulent housing market since 2010, but the long view shows a 20% increase in average home prices over that period. From 2011 to 2012, values fell dramatically, bottoming out at just over $27,000. But by 2021, the town’s average price had more than doubled from its lows, peaking at $72,000 during the post-COVID housing surge. Since then, however, the market has declined each year, with 2025 showing the steepest drop yet—nearly 11%. These swings reveal a market sensitive to larger trends, where affordability can attract new interest quickly but also makes it more susceptible to correction. Despite the current retreat, today’s average price of $61,600 is still meaningfully higher than the town’s 2010 level. The takeaway is that McDonald Chapel has potential, but also a history of volatility that buyers should approach with awareness.
McDonald Chapel – A Rebuilding Suburb With Deep Housing Cycles
McDonald Chapel is a residential community located just northwest of Birmingham in Jefferson County. The area suffered significant damage during the 2011 tornado outbreak, which likely contributed to the sharp early-2010s price declines reflected in the data. Since then, much of the area has seen rebuilding, with newer homes and gradual infrastructure improvements drawing some renewed attention. McDonald Chapel remains quiet and largely residential, with a landscape dominated by single-family homes on medium-sized lots. While commercial development is minimal, its close proximity to Forestdale and Birmingham ensures residents have access to everything they need within a short drive.
The dramatic price gains seen between 2019 and 2022 likely reflect a mix of improved housing stock, strong investor interest, and broader trends affecting the Birmingham suburbs. The town’s affordability—especially in the wake of recent declines—makes it appealing to first-time buyers and those seeking below-market value. At the same time, its history of dramatic price swings means prospective homeowners and investors should plan for long-term holding, rather than expecting quick returns. McDonald Chapel has shown that it can rebound powerfully, even after setbacks, but it continues to evolve in fits and starts. Those willing to engage with its past and present may find unique opportunities in a market that has already proven its resilience.
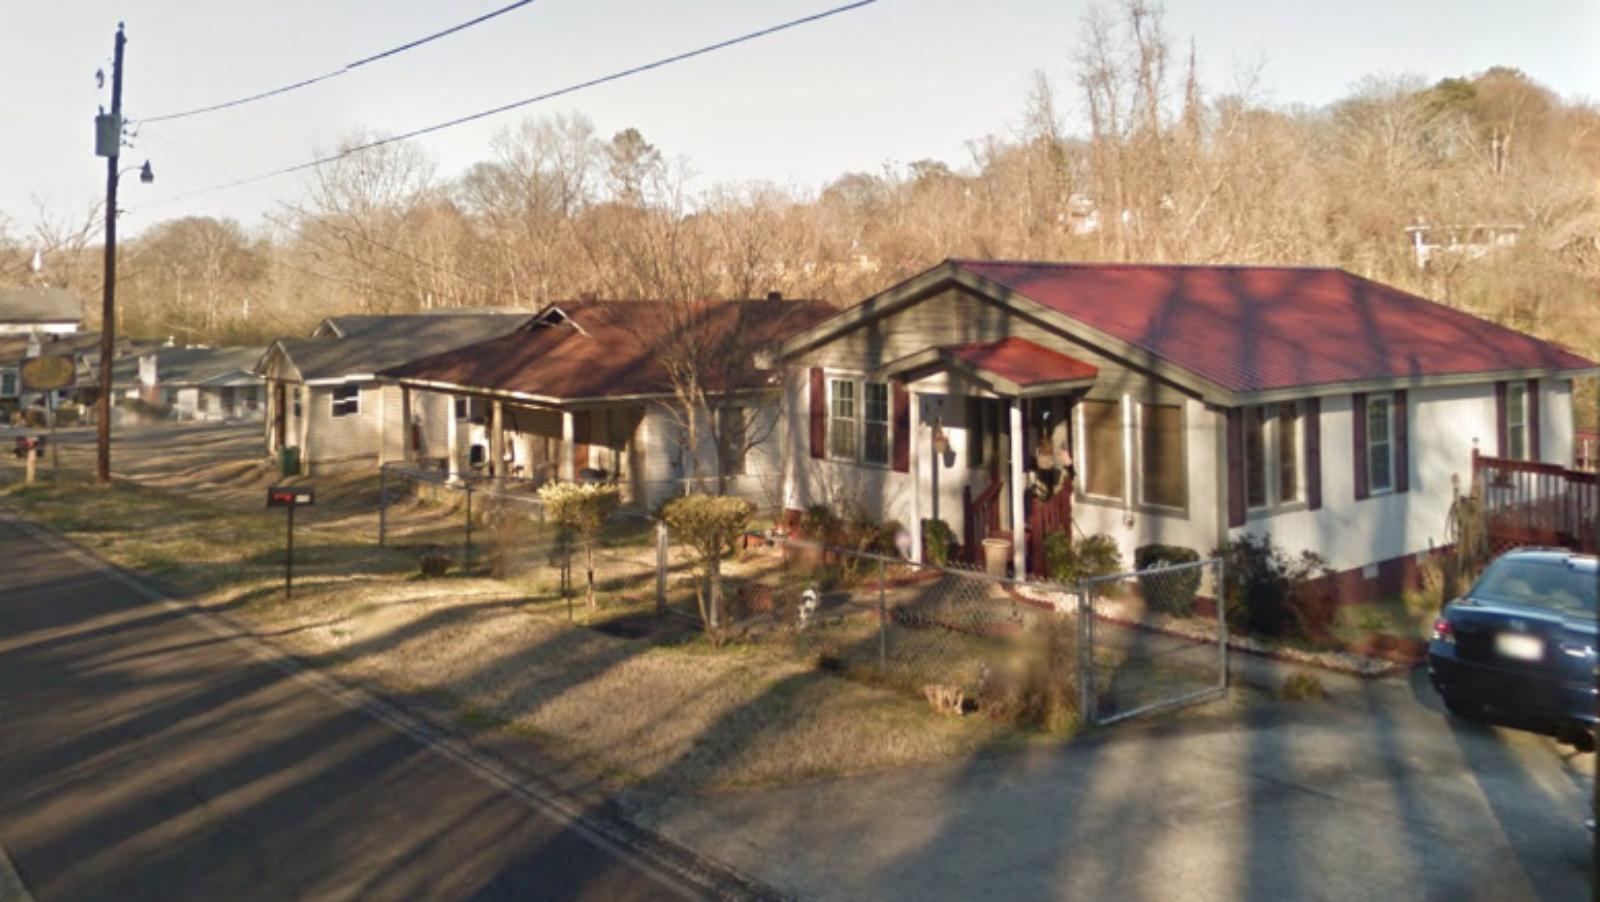
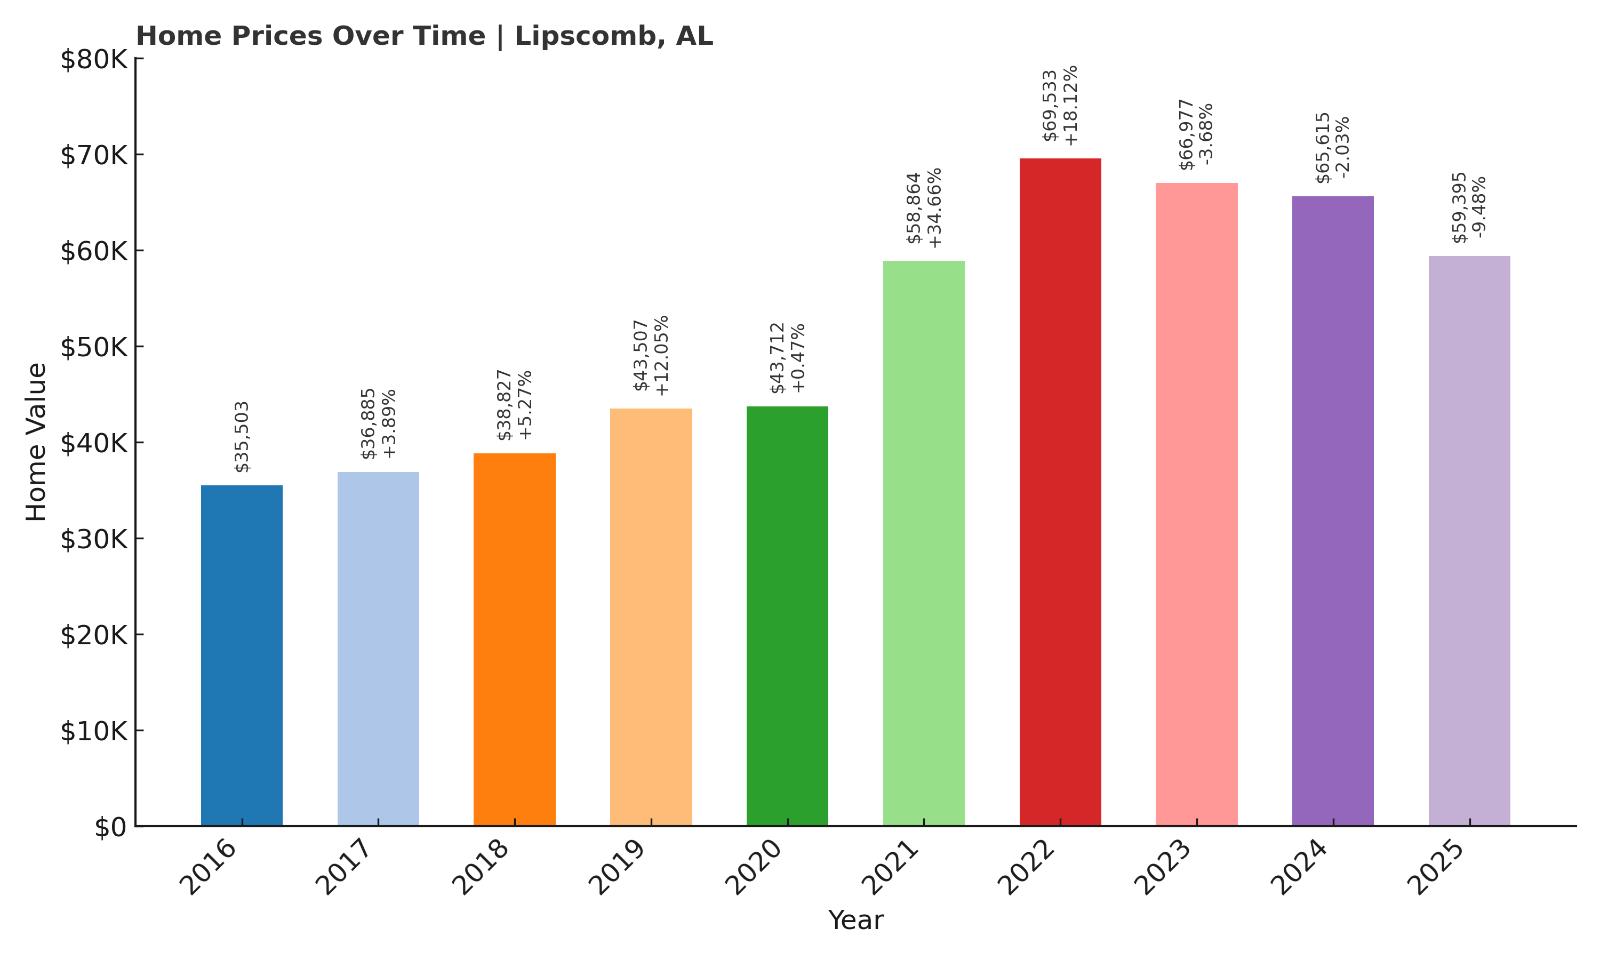
5. Lipscomb – 67% Home Price Increase Since 2016
- 2010: N/A
- 2011: N/A
- 2012: N/A
- 2013: N/A
- 2014: N/A
- 2015: N/A
- 2016: $35,502.75
- 2017: $36,884.66 (+$1,381.91, +3.89% from previous year)
- 2018: $38,827.50 (+$1,942.84, +5.27% from previous year)
- 2019: $43,507.21 (+$4,679.71, +12.05% from previous year)
- 2020: $43,712.45 (+$205.24, +0.47% from previous year)
- 2021: $58,863.81 (+$15,151.36, +34.66% from previous year)
- 2022: $69,533.06 (+$10,669.25, +18.13% from previous year)
- 2023: $66,977.49 (-$2,555.57, -3.68% from previous year)
- 2024: $65,615.11 (-$1,362.39, -2.03% from previous year)
- 2025: $59,395.18 (-$6,219.93, -9.48% from previous year)
Lipscomb’s housing market has seen a 67% increase since 2016, with most of that growth concentrated between 2020 and 2022. After peaking at nearly $70,000 in 2022, the town has experienced a three-year decline, bringing average prices down to just under $60,000. Even with the recent softness, today’s home values remain significantly higher than in the mid-2010s. The large spike in 2021—up 34% in a single year—likely reflects intense buyer activity at the height of the pandemic housing surge. While prices have cooled since then, the overall trajectory still favors long-term appreciation. The trend suggests Lipscomb remains a highly affordable market with some potential for future recovery if local demand returns. Buyers today are entering well below the market’s recent peak, which could offer room for renewed value growth over time.
Lipscomb – Quiet Value Near Birmingham’s Core
Lipscomb is a small city located in central Jefferson County, just southwest of downtown Birmingham. With a population of under 3,000, it’s a compact residential community that offers some of the lowest home prices in the Birmingham metro area. The town is known for its modest post-war homes, walkable streets, and easy access to major thoroughfares including I-20 and I-59. While it doesn’t have significant commercial development or upscale amenities, Lipscomb’s biggest strength is its location—placing it just minutes from some of Birmingham’s largest employment centers. This geographic advantage likely contributed to the big price gains seen in the early 2020s, as buyers sought budget-friendly options within commuting distance of the city.
Today, Lipscomb remains one of the metro’s most affordable enclaves. While recent declines may give pause, they also create buying opportunities for long-term investors or first-time homebuyers who value location and low costs. The town’s existing infrastructure, including local parks and municipal services, is modest but functional. Its proximity to larger suburbs like Fairfield and Midfield ensures access to schools, healthcare, and shopping, while maintaining a quieter neighborhood atmosphere. As the broader metro housing market stabilizes, Lipscomb could once again become a magnet for buyers priced out of trendier zip codes but still wanting to stay close to Birmingham’s urban core.
4. Selma – 4% Home Price Increase Since 2010
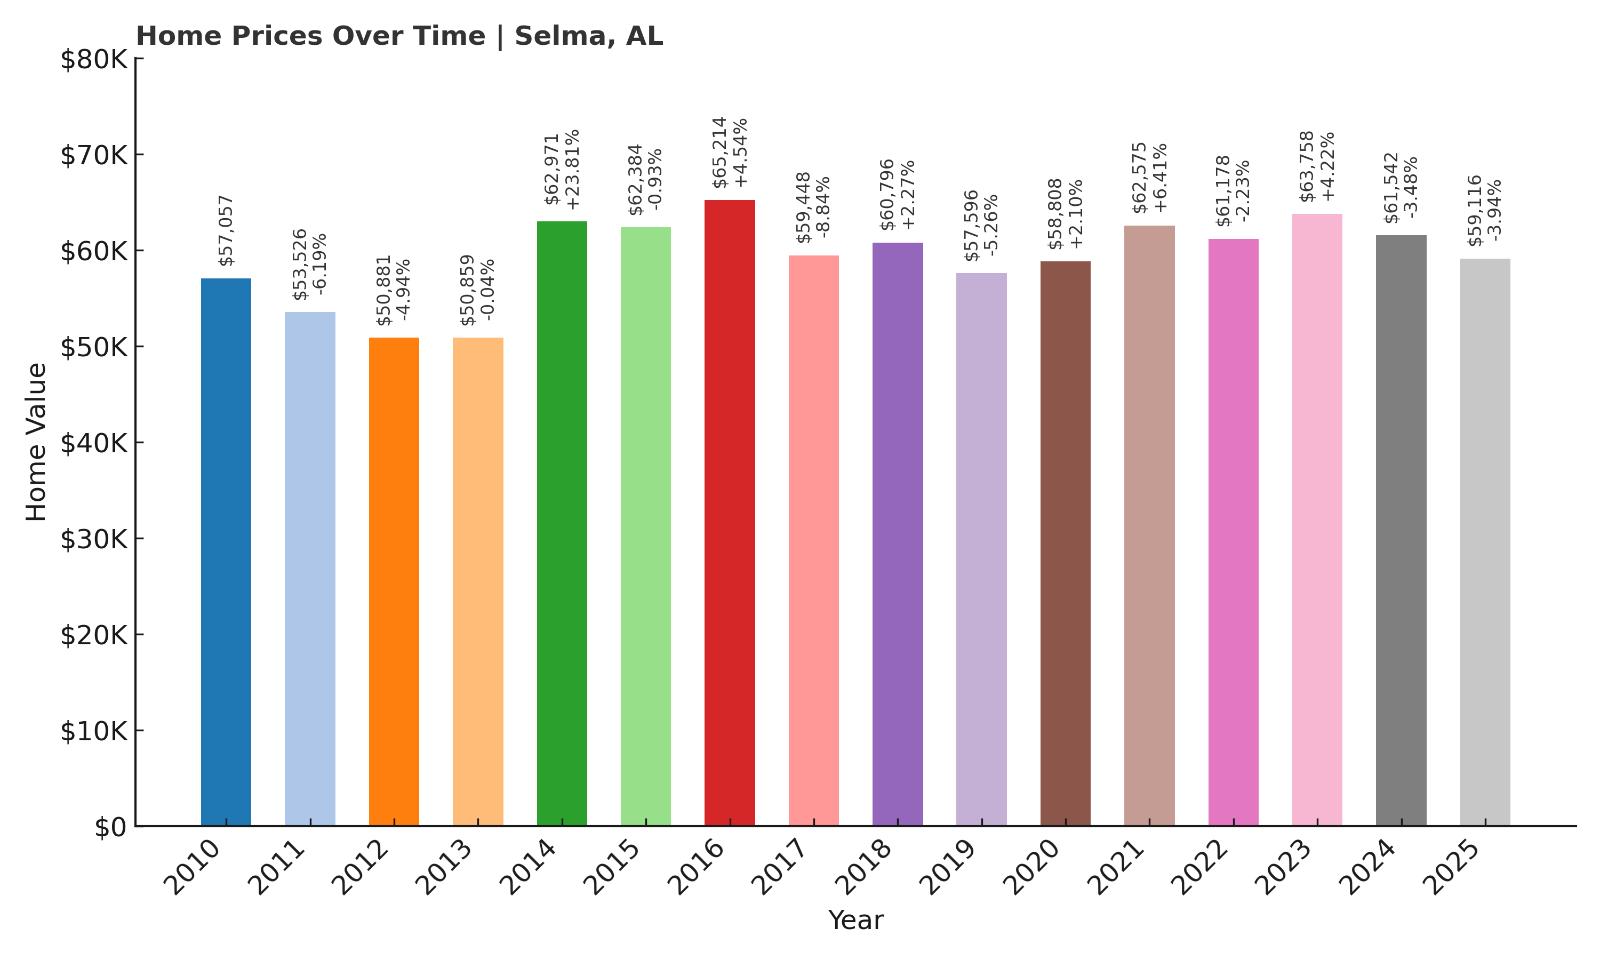
- 2010: $57,056.88
- 2011: $53,525.83 (-$3,531.05, -6.19% from previous year)
- 2012: $50,880.65 (-$2,645.19, -4.94% from previous year)
- 2013: $50,859.25 (-$21.40, -0.04% from previous year)
- 2014: $62,971.09 (+$12,111.84, +23.81% from previous year)
- 2015: $62,384.43 (-$586.65, -0.93% from previous year)
- 2016: $65,213.66 (+$2,829.23, +4.54% from previous year)
- 2017: $59,448.05 (-$5,765.61, -8.84% from previous year)
- 2018: $60,796.26 (+$1,348.21, +2.27% from previous year)
- 2019: $57,596.48 (-$3,199.78, -5.26% from previous year)
- 2020: $58,808.16 (+$1,211.68, +2.10% from previous year)
- 2021: $62,574.95 (+$3,766.79, +6.41% from previous year)
- 2022: $61,178.32 (-$1,396.64, -2.23% from previous year)
- 2023: $63,758.10 (+$2,579.78, +4.22% from previous year)
- 2024: $61,541.67 (-$2,216.43, -3.48% from previous year)
- 2025: $59,116.11 (-$2,425.56, -3.94% from previous year)
Selma’s housing market has been flat overall, showing only a modest 4% increase since 2010. That said, the picture is more complex beneath the surface. Home prices here have fluctuated significantly over the years, with large gains in some years—like the 23.8% jump in 2014—and declines in others. From 2022 through 2025, prices have edged down each year, returning to the $59,000 range seen in the early 2010s. This kind of volatility, without clear upward momentum, reflects a market under pressure, likely affected by broader economic and demographic trends. Still, homeownership remains extremely accessible, and the market’s lack of sharp increases may appeal to buyers seeking low volatility in terms of cost of entry. In 2025, Selma’s average home value is just over $59,000—among the lowest in Alabama.
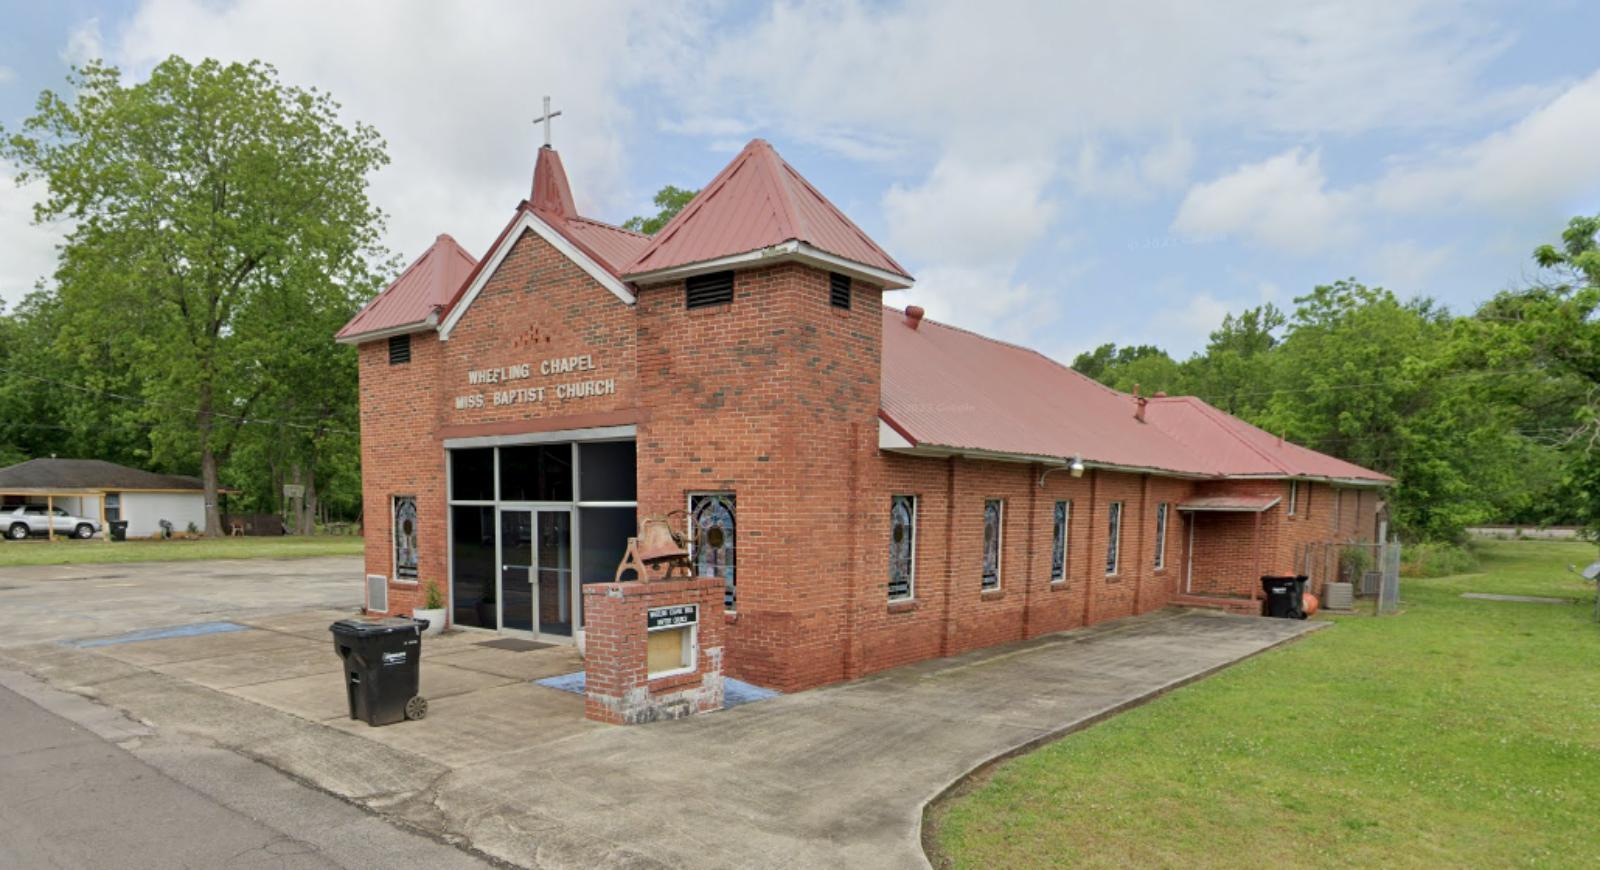
Selma – Historic City with Persistently Low Prices
Selma is one of Alabama’s most historically significant cities, best known as the site of the Selma-to-Montgomery marches during the civil rights era. Located in Dallas County along the Alabama River, the city has a rich heritage, grand antebellum architecture, and a deep cultural legacy. Despite its national profile, Selma’s housing market remains deeply affordable, with prices rarely climbing far from the $60,000 mark. While that makes it attractive for buyers on a budget, it also reflects the city’s long-running economic struggles, population decline, and infrastructure challenges. Job opportunities are limited, and public investment has lagged behind other parts of the state.
Even so, Selma retains a sense of pride and identity that continues to draw residents and nonprofits alike. Preservation efforts, tourism, and cultural programming have helped maintain civic life, and ongoing revitalization campaigns aim to breathe new life into its historic downtown. For buyers who value architectural character, walkable neighborhoods, and connection to history, Selma offers properties with soul—and space—at a fraction of the cost of similar homes elsewhere. But those investing here should do so with a long-term mindset, as the road to significant appreciation is likely to remain slow and uneven.
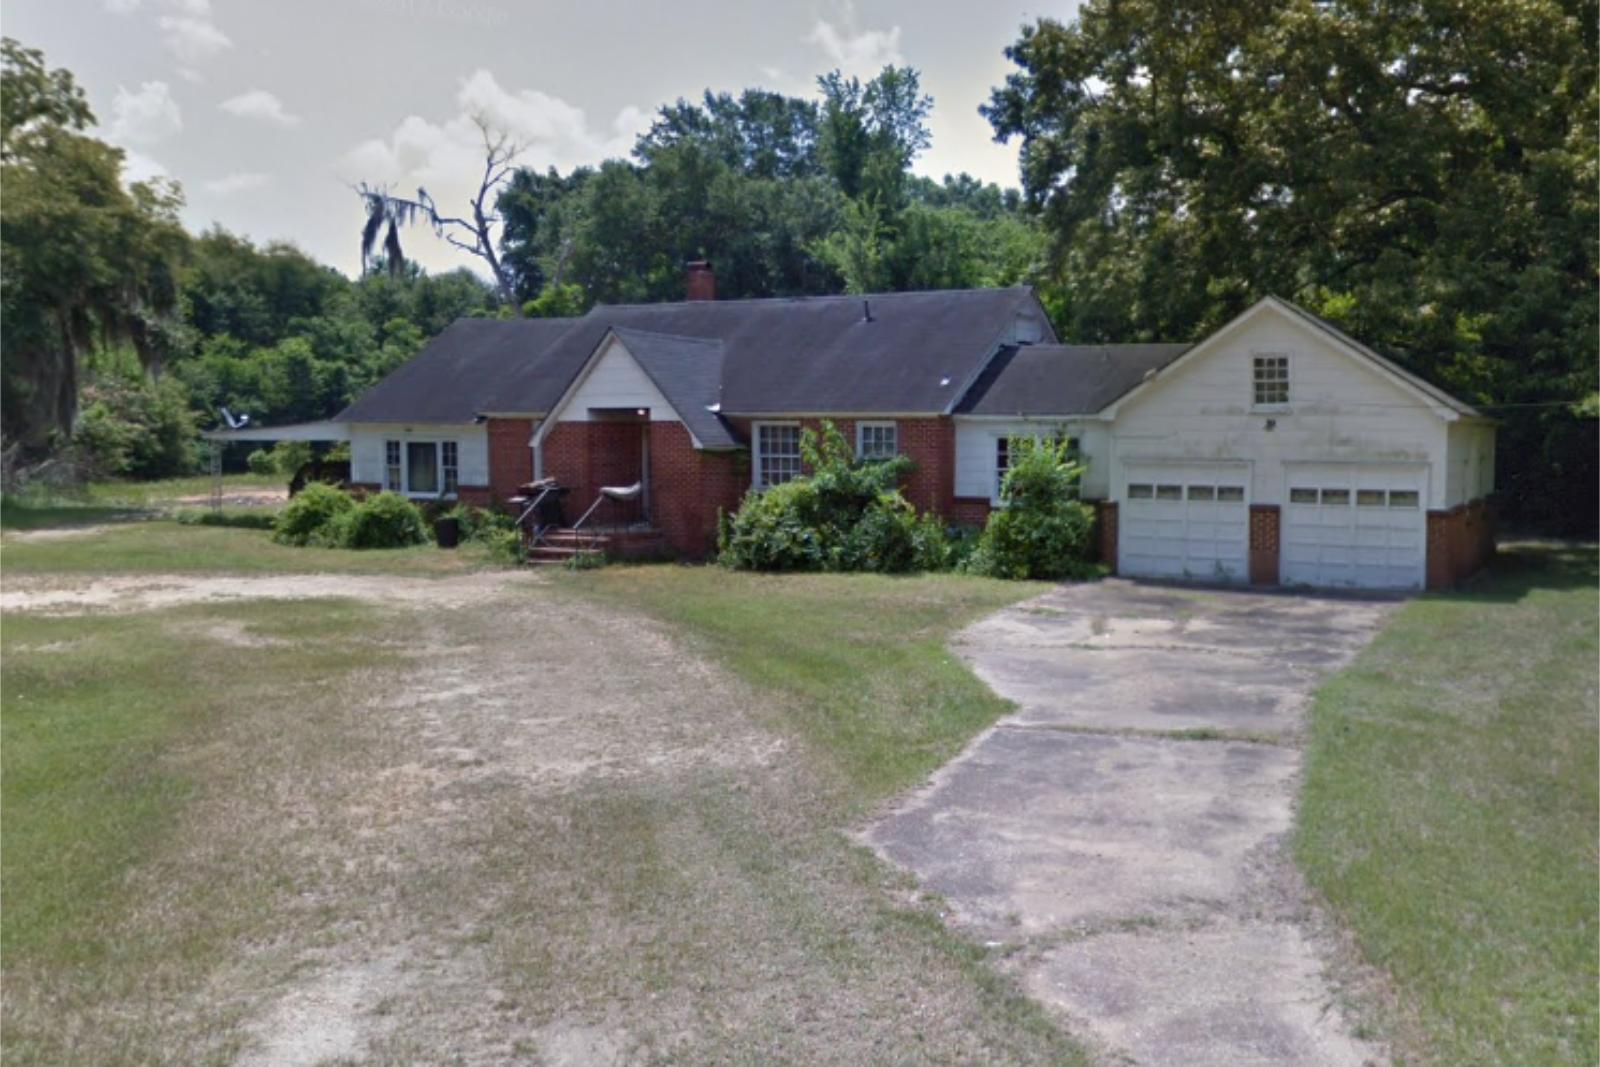
3. Prichard – 26% Home Price Decrease Since 2010
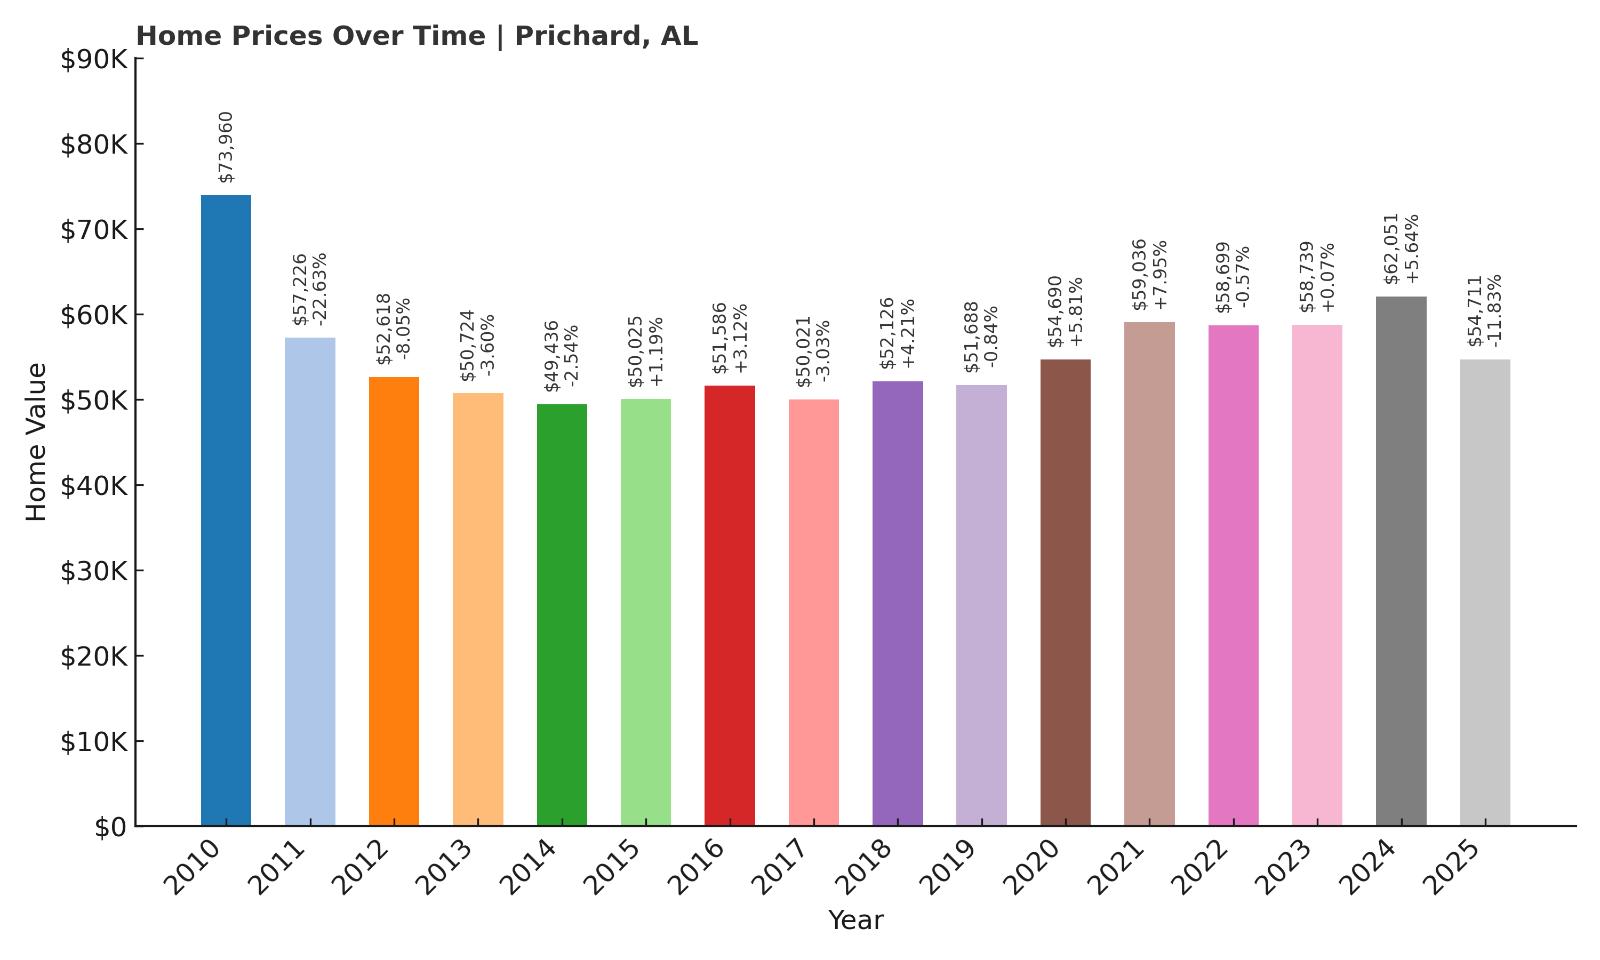
- 2010: $73,959.84
- 2011: $57,225.94 (-$16,733.90, -22.63% from previous year)
- 2012: $52,617.68 (-$4,608.26, -8.05% from previous year)
- 2013: $50,724.21 (-$1,893.47, -3.60% from previous year)
- 2014: $49,435.82 (-$1,288.39, -2.54% from previous year)
- 2015: $50,025.34 (+$589.51, +1.19% from previous year)
- 2016: $51,586.09 (+$1,560.76, +3.12% from previous year)
- 2017: $50,021.30 (-$1,564.80, -3.03% from previous year)
- 2018: $52,126.44 (+$2,105.15, +4.21% from previous year)
- 2019: $51,687.62 (-$438.82, -0.84% from previous year)
- 2020: $54,690.44 (+$3,002.82, +5.81% from previous year)
- 2021: $59,036.46 (+$4,346.03, +7.95% from previous year)
- 2022: $58,698.86 (-$337.60, -0.57% from previous year)
- 2023: $58,738.61 (+$39.75, +0.07% from previous year)
- 2024: $62,051.15 (+$3,312.54, +5.64% from previous year)
- 2025: $54,711.24 (-$7,339.91, -11.83% from previous year)
Prichard’s housing market has fallen nearly 26% since 2010, making it one of the few towns on this list with long-term negative growth. The bulk of that decline came early, particularly during 2011 and 2012, when prices dropped sharply. From 2013 onward, the market has fluctuated in a narrow band, mostly between $49,000 and $59,000, with some modest gains during the pandemic boom. However, the large decline in 2025—down nearly 12%—has erased most of the post-COVID momentum. With home values now sitting around $54,700, prices are roughly where they were a decade ago. That lack of appreciation may deter investors, but also highlights affordability for buyers looking to own without taking on much debt.
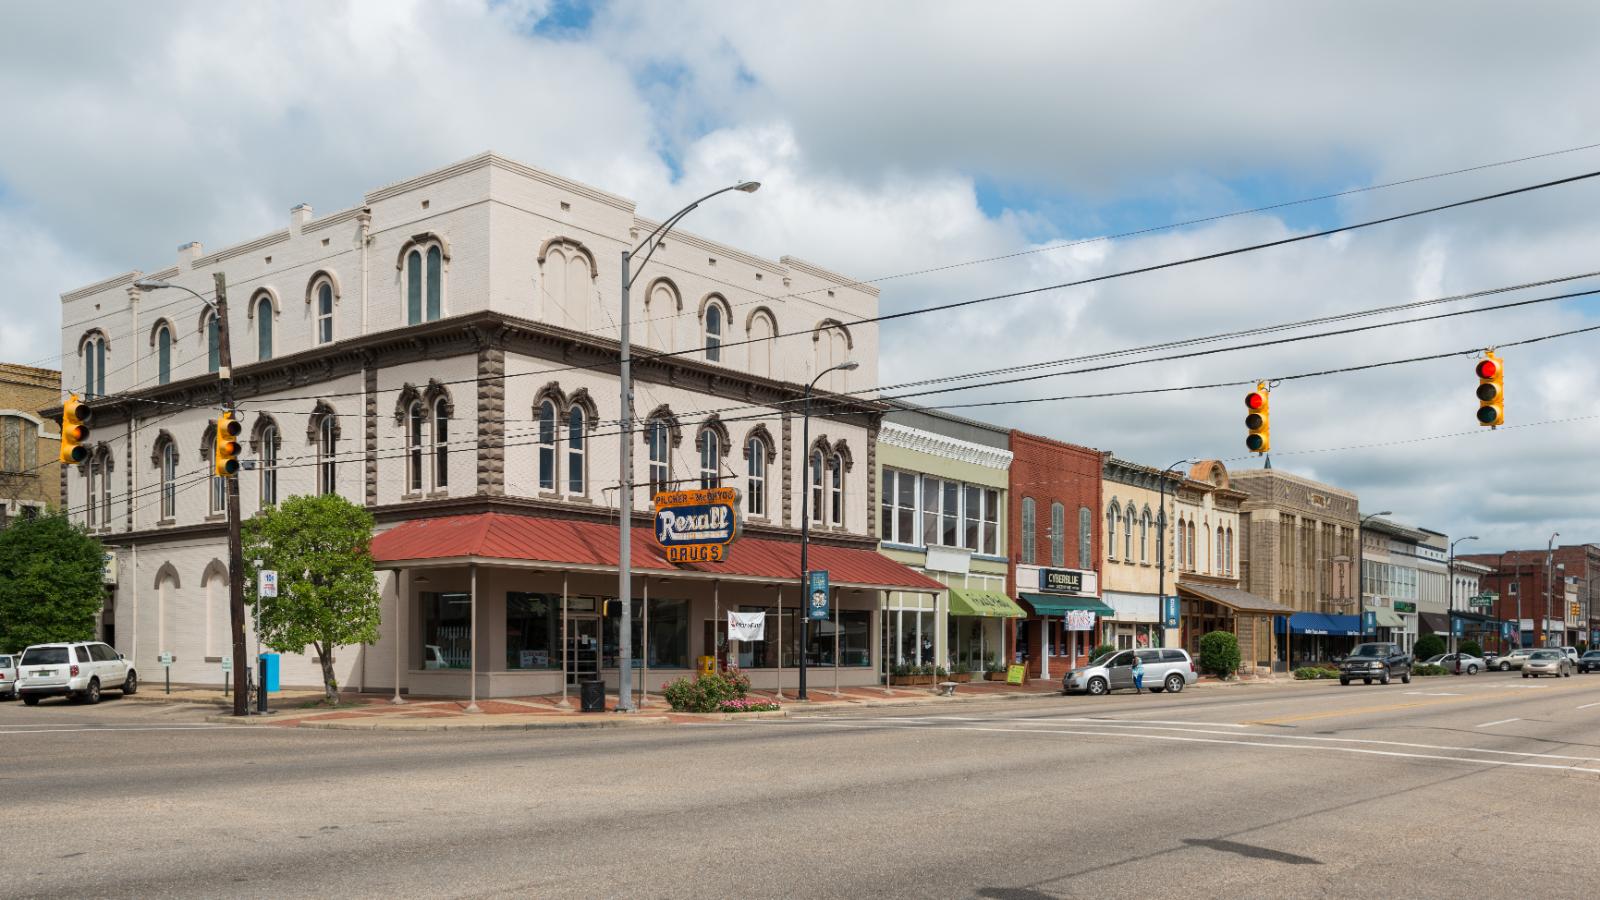
Prichard – Urban Struggles, But Rock-Bottom Prices
🔥 Would you like to save this?
Located just north of Mobile, Prichard is a historically industrial city that has faced significant economic challenges over the past several decades. Once a vibrant hub with a strong manufacturing base, the city suffered from deindustrialization and declining population, leading to widespread disinvestment and persistent poverty. That economic reality is reflected in its housing market: homes are extremely affordable, but appreciation is limited. Many properties sit below $60,000, even after renovations, and while some neighborhoods are improving, others remain in need of major infrastructure updates.
Despite these challenges, Prichard’s location remains a potential asset. It borders Mobile, has access to major highways and the port, and benefits from proximity to regional employers. Local officials have made efforts to attract new businesses and improve public safety, but change has been slow. For homebuyers seeking extremely low prices and willing to bet on future recovery, Prichard offers real estate opportunities that are difficult to find elsewhere in the Gulf Coast region. But prospective buyers should enter with eyes wide open: while affordability is high, returns may take time and require patience.
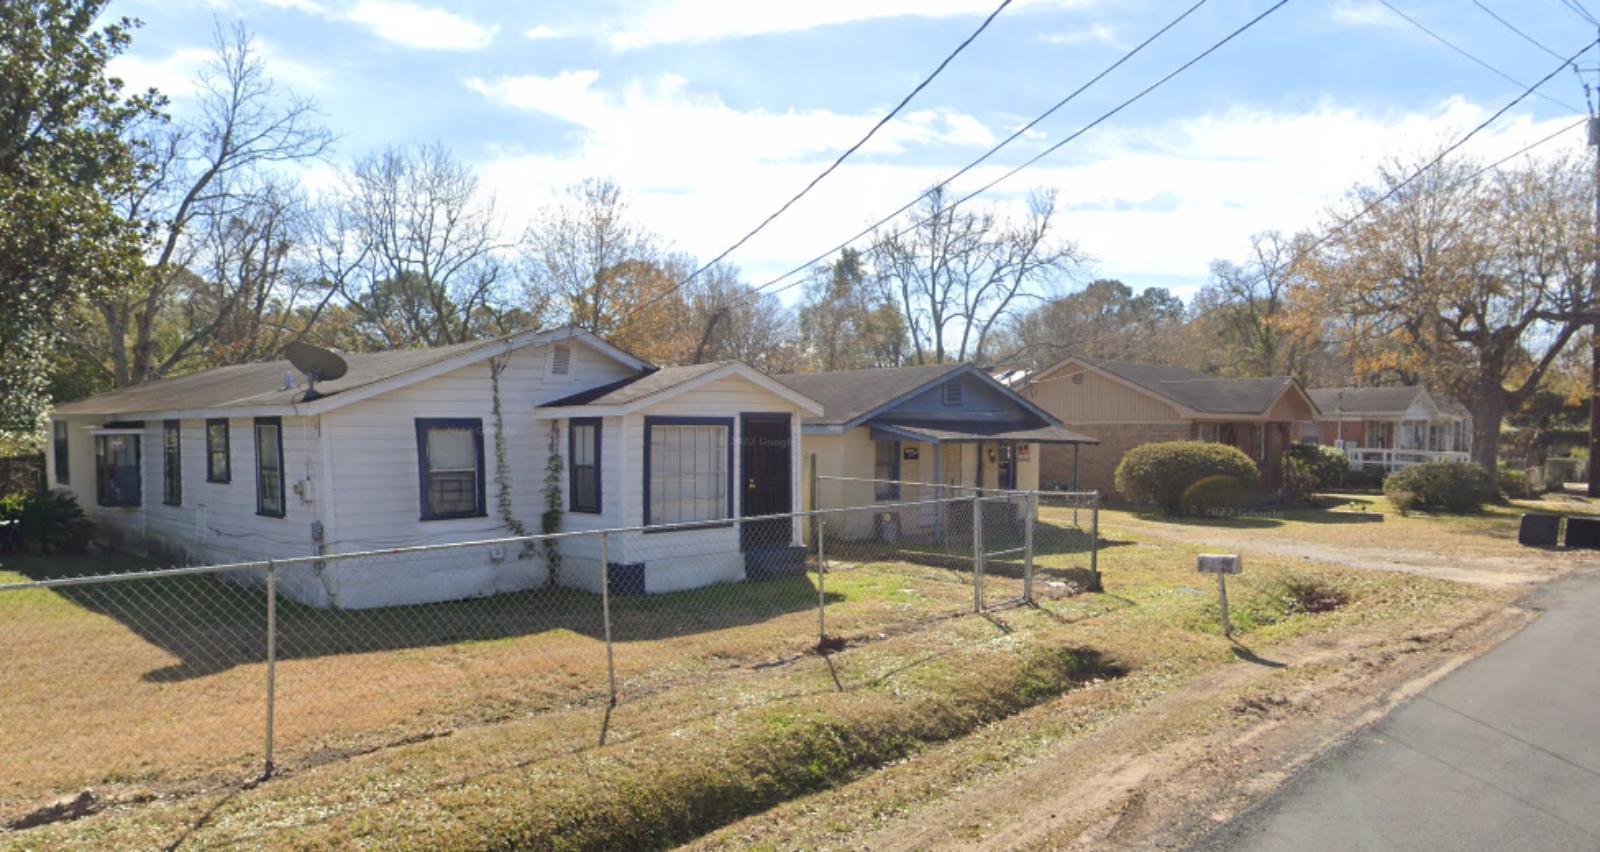
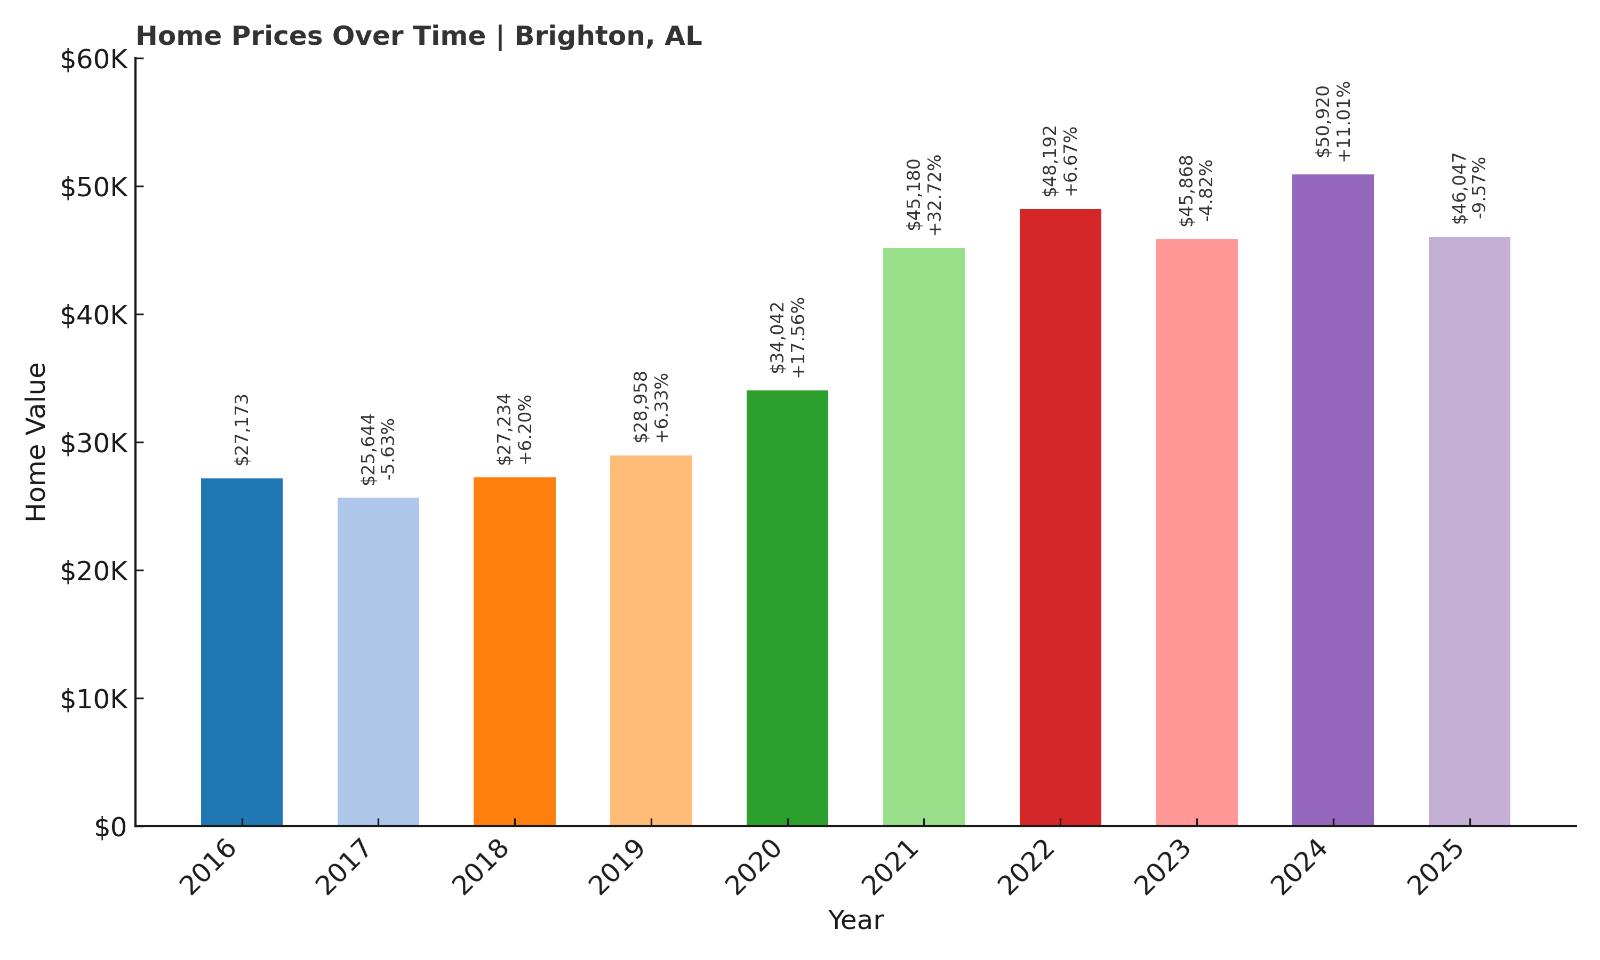
2. Brighton – 69% Home Price Increase Since 2016
- 2010: N/A
- 2011: N/A
- 2012: N/A
- 2013: N/A
- 2014: N/A
- 2015: N/A
- 2016: $27,172.59
- 2017: $25,644.08 (-$1,528.51, -5.63% from previous year)
- 2018: $27,234.07 (+$1,590.00, +6.20% from previous year)
- 2019: $28,958.05 (+$1,723.97, +6.33% from previous year)
- 2020: $34,041.52 (+$5,083.47, +17.55% from previous year)
- 2021: $45,180.39 (+$11,138.87, +32.72% from previous year)
- 2022: $48,192.38 (+$3,011.99, +6.67% from previous year)
- 2023: $45,867.56 (-$2,324.83, -4.82% from previous year)
- 2024: $50,919.63 (+$5,052.07, +11.01% from previous year)
- 2025: $46,046.81 (-$4,872.82, -9.57% from previous year)
Brighton’s home values have increased nearly 69% since 2016, despite some notable swings along the way. The most dramatic surge happened between 2020 and 2021, when prices rose over 32%, driven by broader pandemic market dynamics and investor interest in Birmingham’s outer suburbs. After hitting nearly $51,000 in 2024, prices pulled back by nearly 10% in 2025, bringing the average home value to about $46,000. Still, compared to its low of $27,000 in 2016, the long-term picture remains one of growth. Brighton’s market has clearly benefited from proximity to Birmingham and affordability-driven demand. The recent dip may reflect market rebalancing more than local weakness.
Brighton – Birmingham’s Underrated Bargain
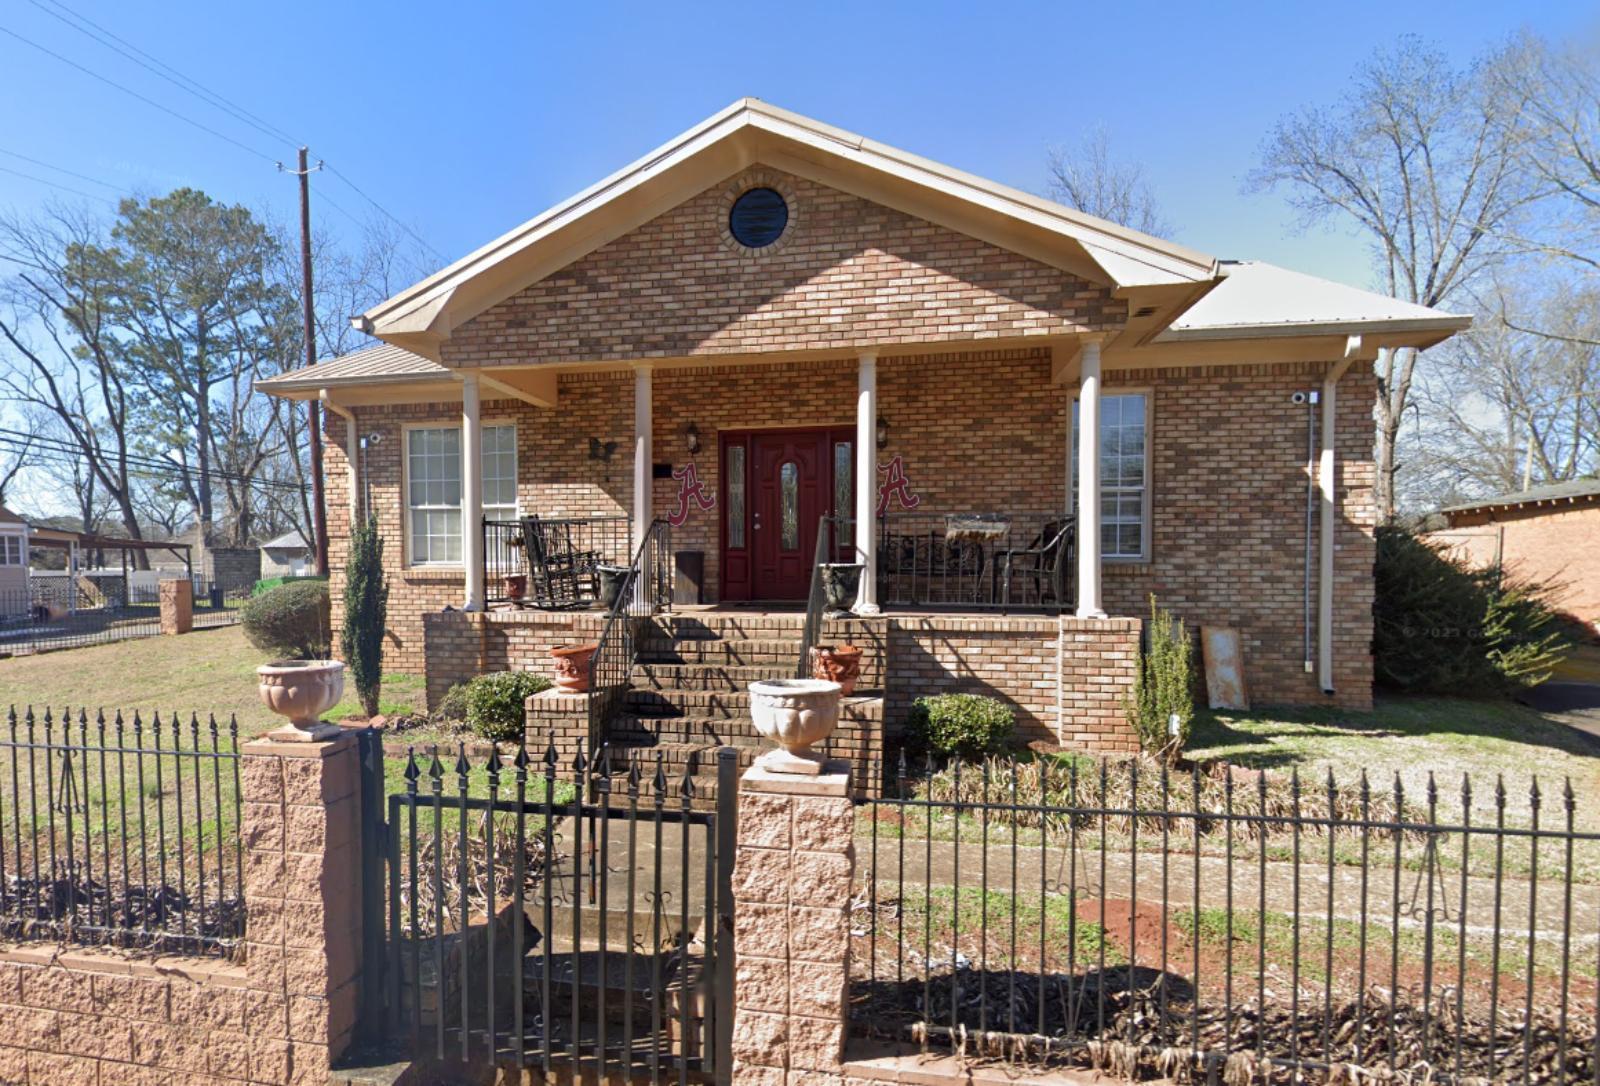
Brighton is a small city in central Jefferson County that borders Midfield and Fairfield, placing it squarely within the Birmingham metro zone. Once a bustling steel-town suburb, Brighton experienced sharp population losses in the late 20th century but has seen glimmers of reinvestment in recent years. The housing stock includes a mix of older bungalows and post-war single-family homes, many of which are ripe for renovation. This has made Brighton increasingly attractive to budget-minded buyers and real estate investors seeking proximity to downtown Birmingham without the price tag. Infrastructure is basic but functional, and access to schools, shopping, and transit is within a short drive.
While Brighton still contends with economic hurdles, its affordability makes it a unique entry point into Birmingham’s real estate market. With prices hovering around $46,000, homeownership is accessible to many renters or first-time buyers who would be priced out of neighboring suburbs. Recent price dips could offer opportunities to enter the market below trend, especially for buyers willing to invest in improvements. Brighton may never be flashy, but its potential as a low-cost housing haven continues to grow.
1. Selmont West Selmont – 3% Home Price Decrease Since 2024

- 2010: N/A
- 2011: N/A
- 2012: N/A
- 2013: N/A
- 2014: N/A
- 2015: N/A
- 2016: N/A
- 2017: N/A
- 2018: N/A
- 2019: N/A
- 2020: N/A
- 2021: N/A
- 2022: N/A
- 2023: N/A
- 2024: $32,610.27
- 2025: $31,588.10 (-$1,022.17, -3.13% from previous year)
Selmont West Selmont has the lowest average home prices on this list, with 2025 values sitting just above $31,500. With only two years of data, the market trend is hard to analyze in depth, but the modest 3% decline from 2024 suggests stability more than weakness. This community stands out for affordability more than appreciation. Buyers here aren’t likely to see quick returns, but they also face one of the lowest barriers to homeownership anywhere in Alabama. In many cities, $30,000 wouldn’t buy a parking spot—here, it gets you a whole home. That level of affordability alone earns Selmont West Selmont a spot at the top of this ranking.
Selmont West Selmont – Alabama’s Cheapest Market
Selmont West Selmont lies just across the Alabama River from downtown Selma and shares much of its economic and cultural DNA. Like Selma, it has struggled with poverty and underinvestment but also benefits from its connection to one of the state’s most historic cities. The area is primarily residential, with modest homes, quiet streets, and a deeply local way of life. Public services and infrastructure are limited, and commercial development is minimal, but the sense of affordability is unmatched. That makes it an appealing destination for people looking to buy without taking on a heavy mortgage burden.
For prospective homeowners seeking a foothold in the market or retirees looking to downsize affordably, Selmont West Selmont offers opportunities that are increasingly rare. Prices under $35,000 are hard to find anywhere in the country, let alone in a town with access to major landmarks, nearby employment in Selma, and the serenity of riverfront living. While economic challenges remain, the area’s stability in pricing suggests a durable base—and a place where homeownership is still within reach for nearly anyone.