🔥 Would you like to save this?
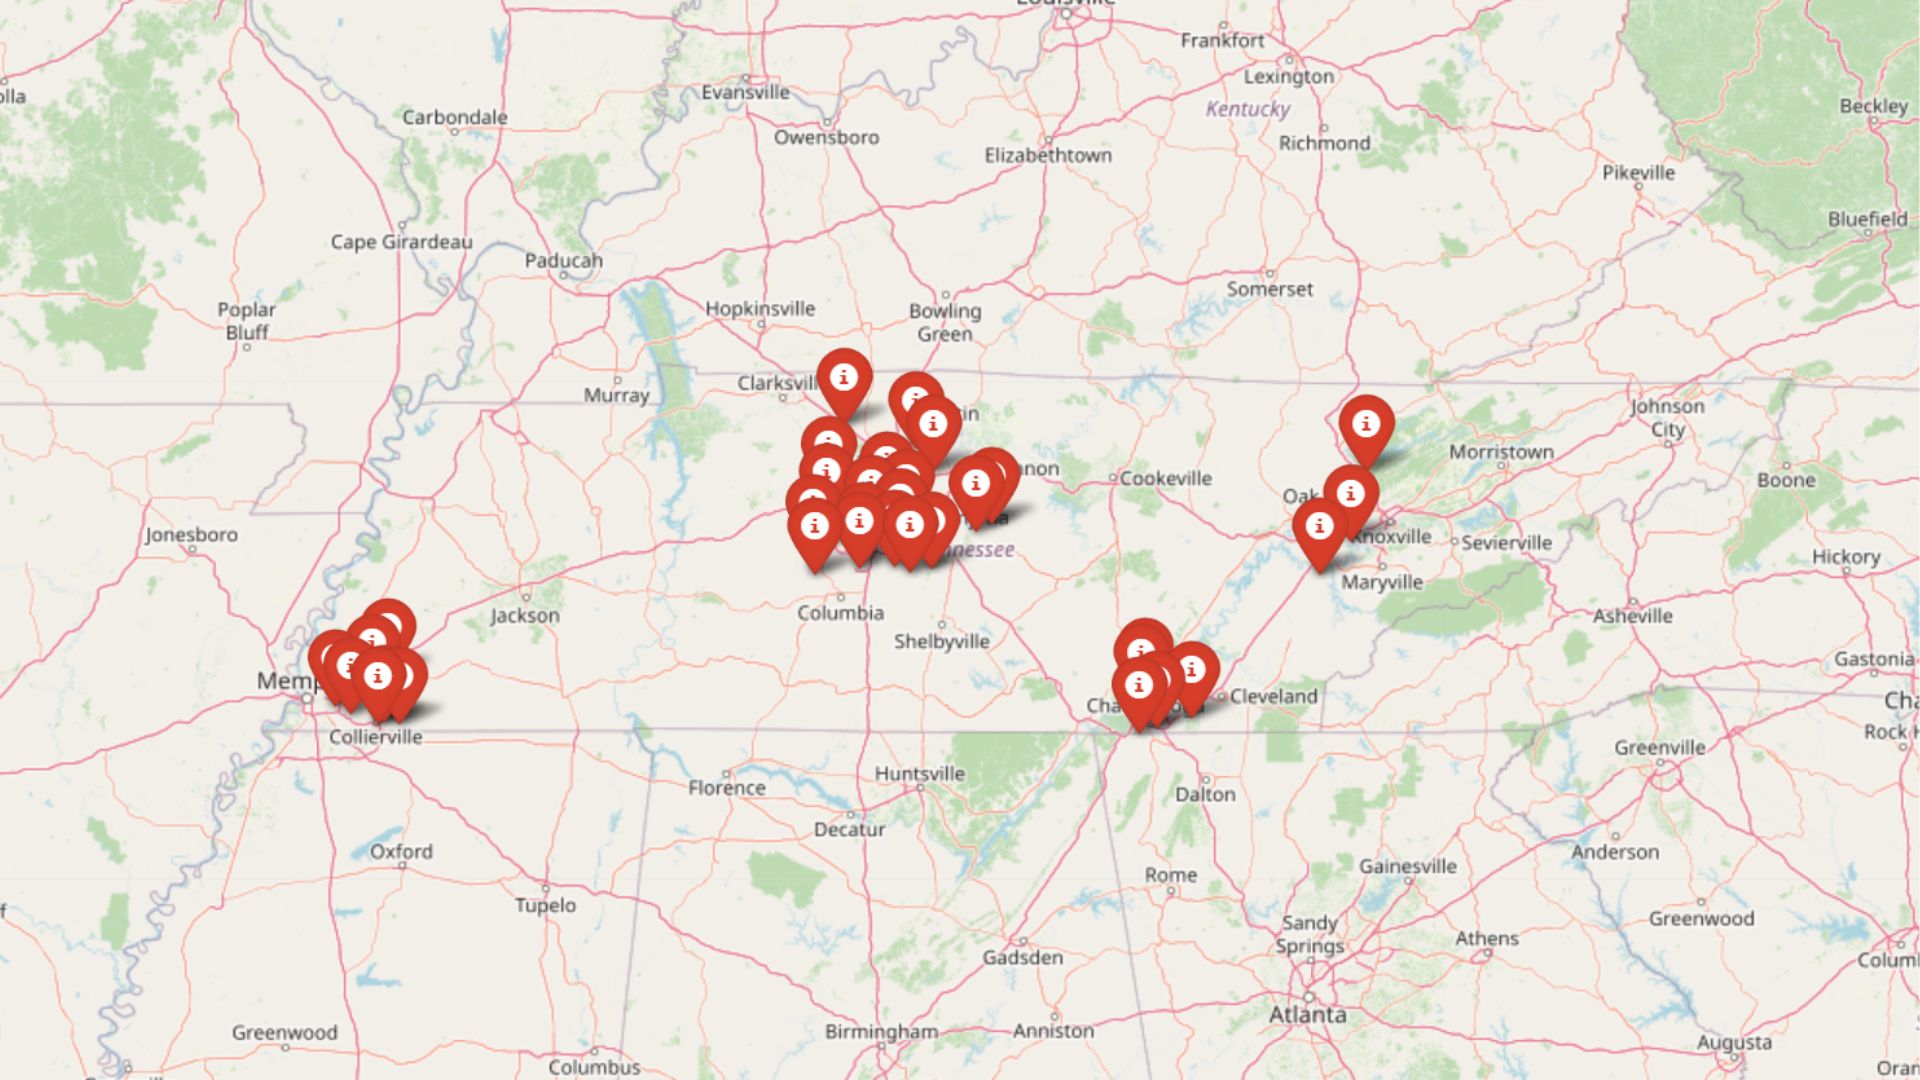
Think Tennessee’s still all about cheap land and quiet living? Not anymore. The Zillow Home Value Index shows property prices across the state climbing fast, from rural retreats to suburbs that now command top dollar. In some towns, prices have doubled since 2010—pushing even modest homes into luxury territory. Whether it’s top schools, mountain views, or city convenience driving demand, these 33 towns prove that Tennessee real estate isn’t the bargain it used to be.
33. Ooltewah – 103% Home Price Increase Since 2010
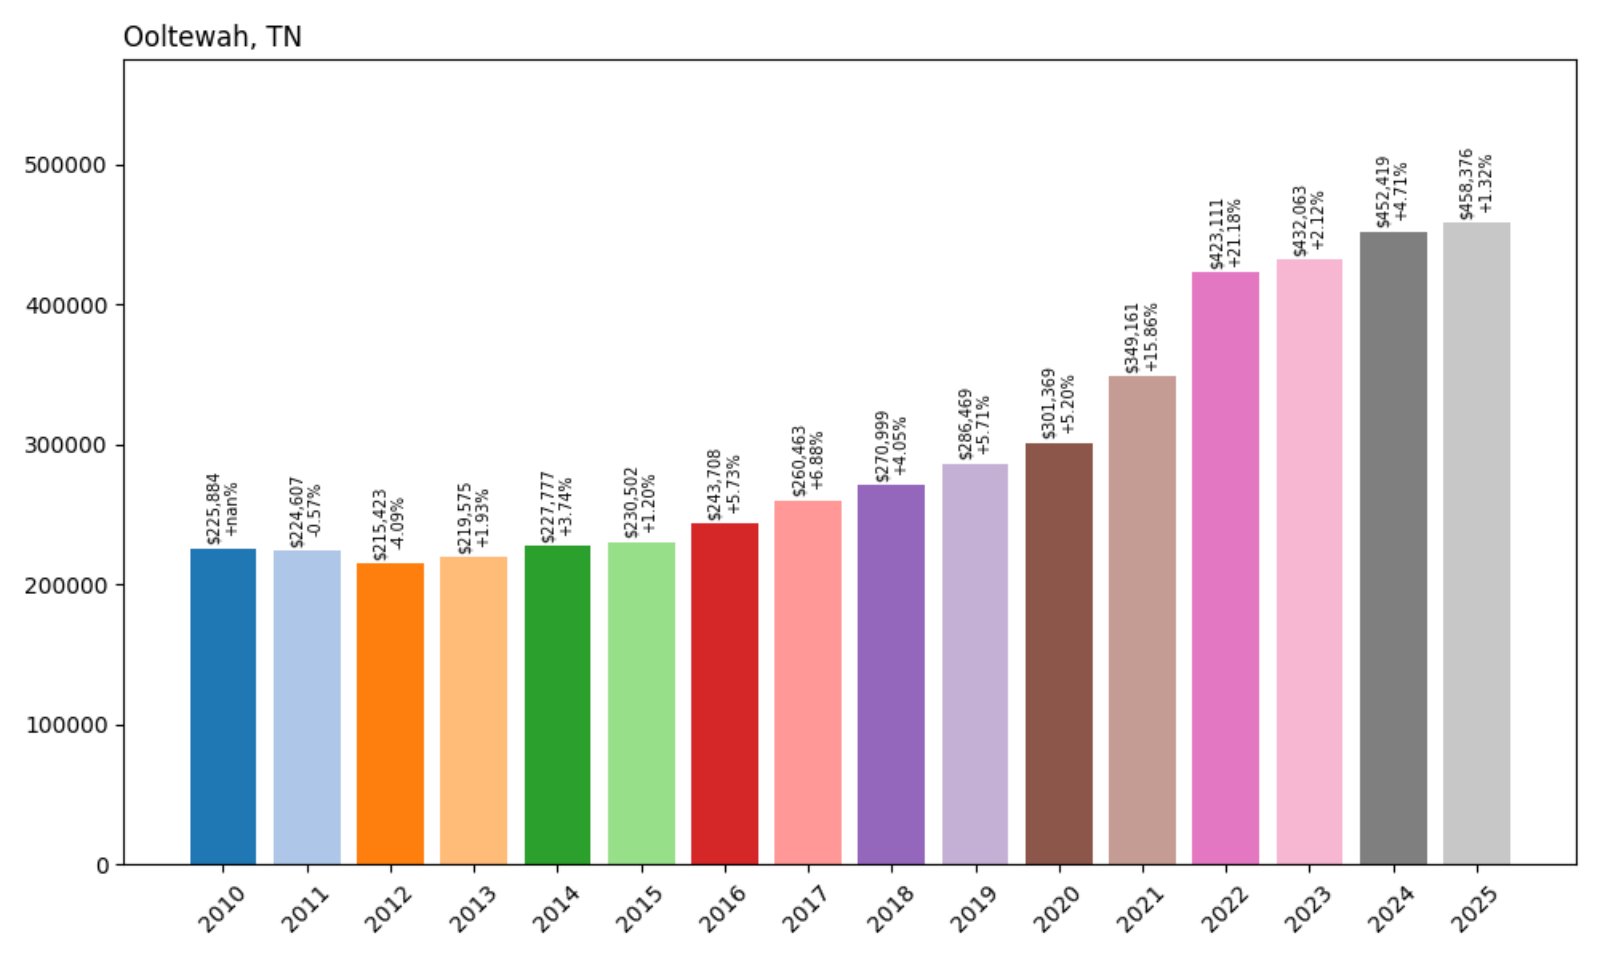
- 2010: $225,884
- 2011: $224,607 (−$1,277, −0.57% from previous year)
- 2012: $215,423 (−$9,185, −4.09% from previous year)
- 2013: $219,575 (+$4,153, +1.93% from previous year)
- 2014: $227,777 (+$8,202, +3.74% from previous year)
- 2015: $230,502 (+$2,724, +1.20% from previous year)
- 2016: $243,708 (+$13,206, +5.73% from previous year)
- 2017: $260,463 (+$16,755, +6.88% from previous year)
- 2018: $270,999 (+$10,536, +4.05% from previous year)
- 2019: $286,469 (+$15,469, +5.71% from previous year)
- 2020: $301,369 (+$14,900, +5.20% from previous year)
- 2021: $349,161 (+$47,792, +15.86% from previous year)
- 2022: $423,111 (+$73,950, +21.18% from previous year)
- 2023: $432,063 (+$8,952, +2.12% from previous year)
- 2024: $452,419 (+$20,356, +4.71% from previous year)
- 2025: $458,376 (+$5,956, +1.32% from previous year)
Ooltewah’s home values have grown by more than double since 2010, climbing from around $226K to over $458K in 2025. Most of the gains have come in the past five years, especially between 2020 and 2022. More recently, price increases have slowed, with just over a 1% rise in the past year.
In order to come up with the very specific design ideas, we create most designs with the assistance of state-of-the-art AI interior design software.
Ooltewah – Steady Gains Fueled by Growth Around Chattanooga
Located just outside Chattanooga, Ooltewah has emerged as a desirable suburb with access to both scenic surroundings and employment centers. Its housing market saw substantial appreciation especially from 2020 to 2022, in part due to the pandemic-era migration toward more spacious suburban areas. Proximity to Volkswagen’s Chattanooga operations and strong local schools have helped support rising values.
Though price growth has slowed since 2023, the long-term trend remains upward. Ooltewah continues to attract homebuyers looking for relative value compared to nearby metro areas. Development of retail, green spaces, and ease of access to I-75 also contribute to the area’s popularity.
32. Walnut Grove – 155% Home Price Increase Since 2010
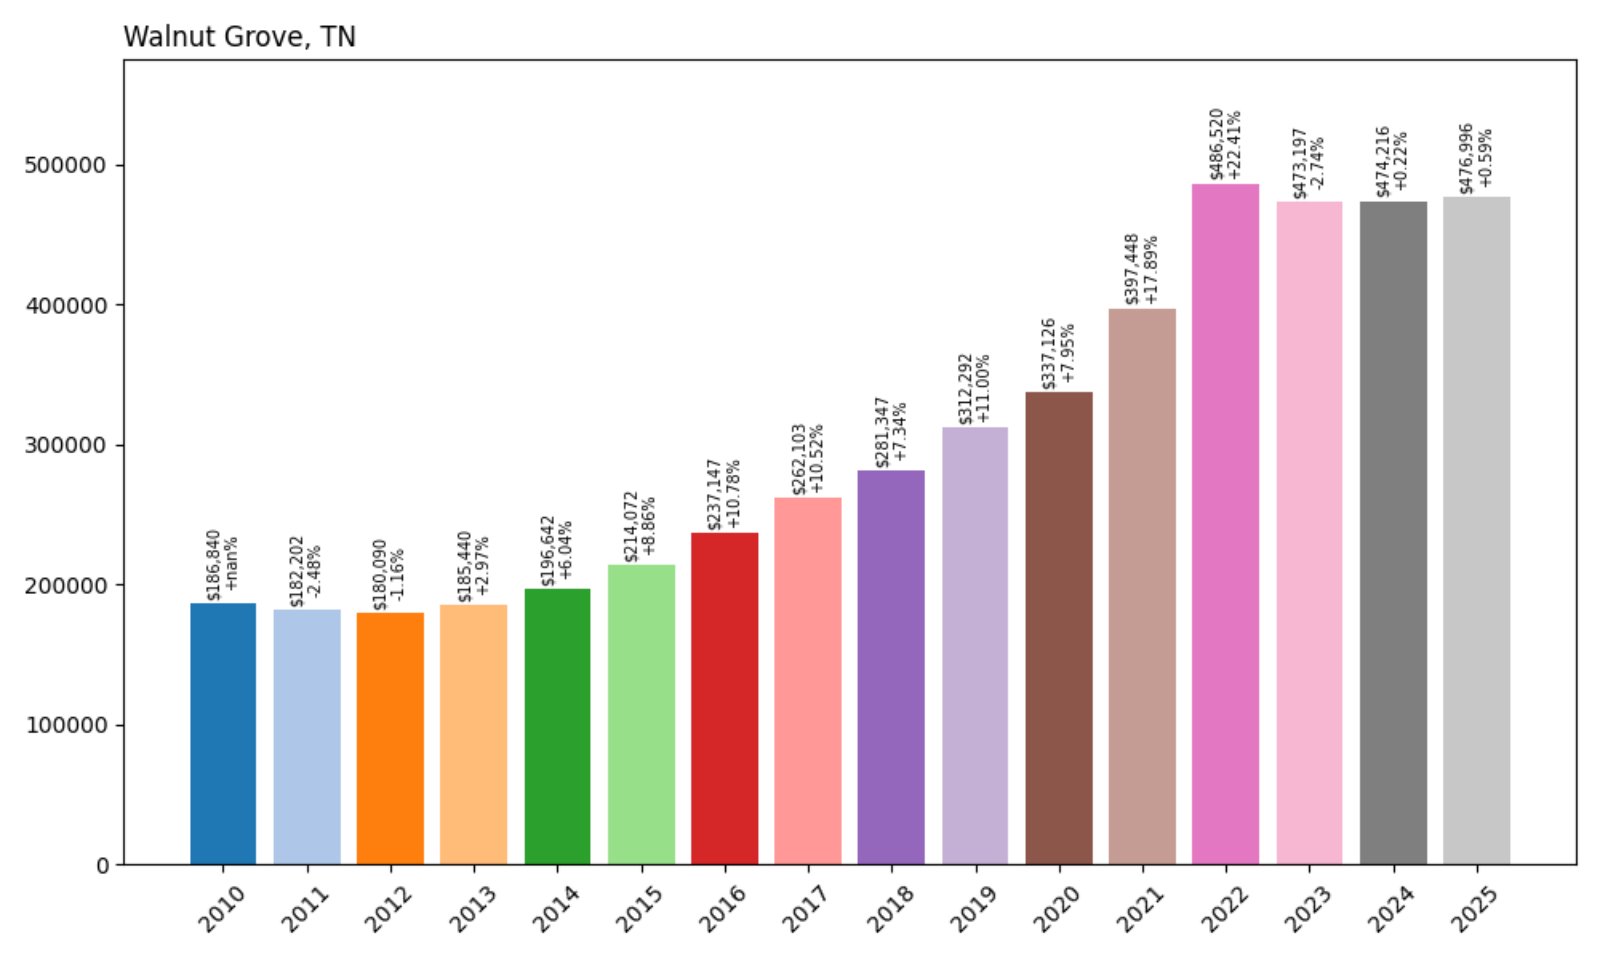
- 2010: $186,840
- 2011: $182,202 (−$4,638, −2.48% from previous year)
- 2012: $180,090 (−$2,112, −1.16% from previous year)
- 2013: $185,440 (+$5,350, +2.97% from previous year)
- 2014: $196,642 (+$11,202, +6.04% from previous year)
- 2015: $214,072 (+$17,430, +8.86% from previous year)
- 2016: $237,147 (+$23,074, +10.78% from previous year)
- 2017: $262,103 (+$24,956, +10.52% from previous year)
- 2018: $281,347 (+$19,244, +7.34% from previous year)
- 2019: $312,292 (+$30,946, +11.00% from previous year)
- 2020: $337,126 (+$24,833, +7.95% from previous year)
- 2021: $397,448 (+$60,323, +17.89% from previous year)
- 2022: $486,520 (+$89,071, +22.41% from previous year)
- 2023: $473,197 (−$13,323, −2.74% from previous year)
- 2024: $474,216 (+$1,019, +0.22% from previous year)
- 2025: $476,996 (+$2,779, +0.59% from previous year)
Walnut Grove’s home prices have climbed from just under $187K in 2010 to nearly $477K in 2025. Growth was particularly strong between 2016 and 2022. Although recent years have seen modest changes, the overall trajectory points to long-term appreciation.
Walnut Grove – High Appreciation From 2016 to 2022
This small community has witnessed remarkable growth over the last decade. Once a quieter area, Walnut Grove saw a surge in home values starting in the mid-2010s as more buyers looked for alternatives to higher-priced suburbs. Between 2015 and 2022, home values more than doubled.
In recent years, the market has cooled slightly with minimal price gains since 2023. However, Walnut Grove remains attractive for its spacious lots, access to nature, and proximity to larger towns like Jackson. These factors continue to make it a strong performer in Tennessee’s housing market.
31. Coopertown – 135% Home Price Increase Since 2010
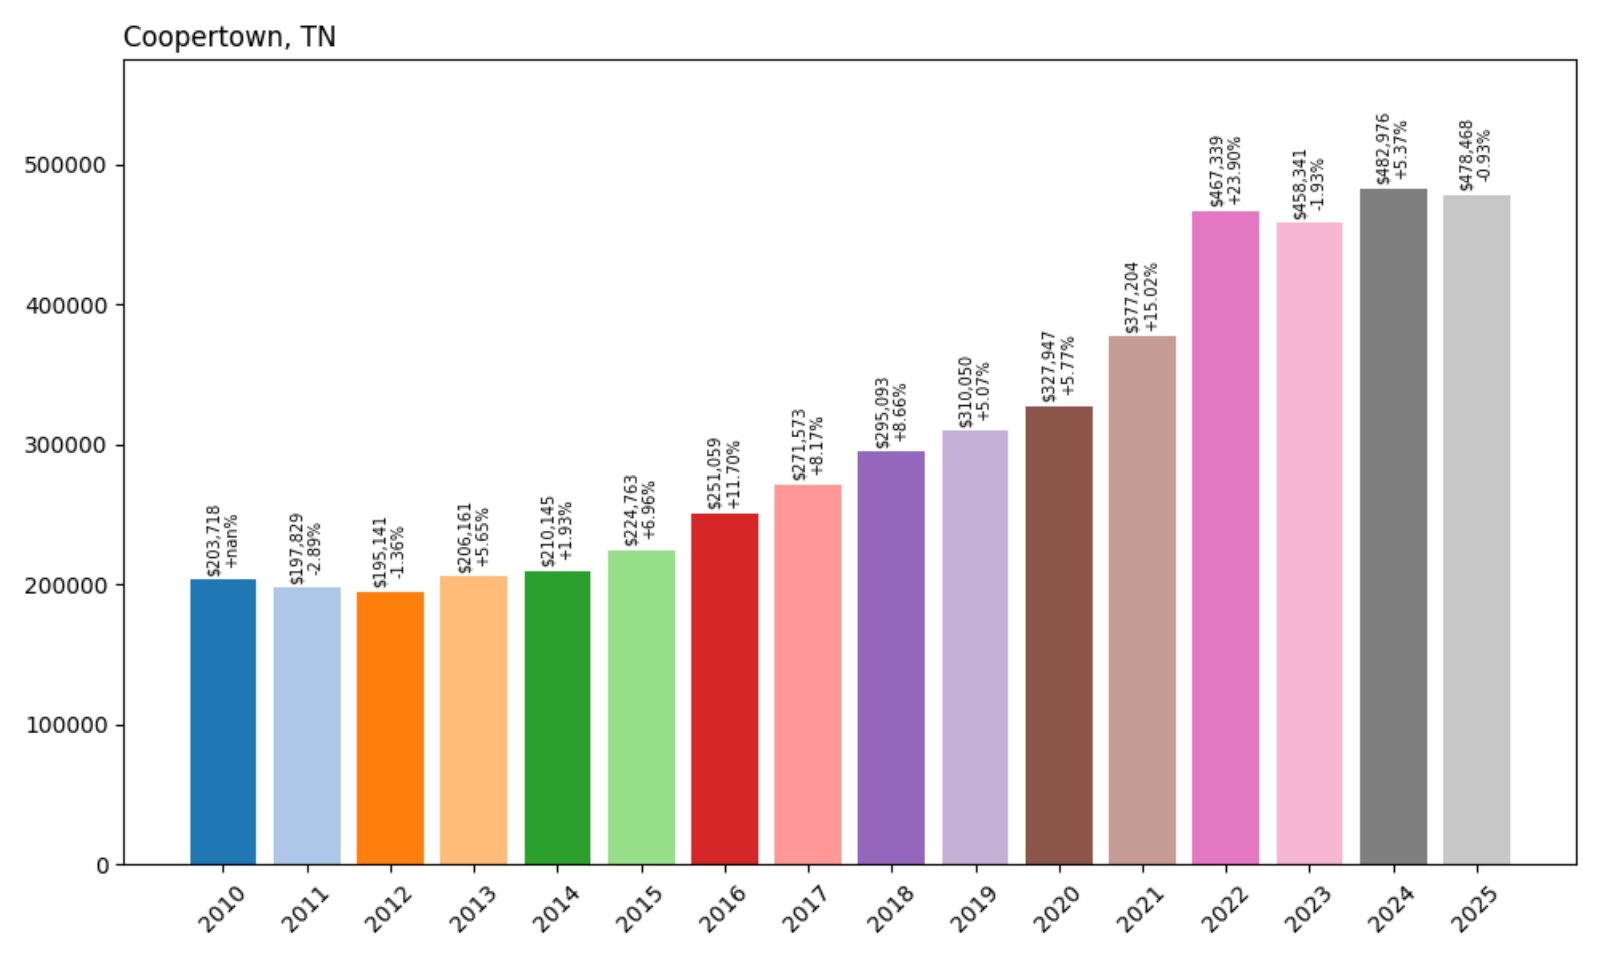
- 2010: $203,718
- 2011: $197,829 (−$5,889, −2.89% from previous year)
- 2012: $195,141 (−$2,688, −1.36% from previous year)
- 2013: $206,161 (+$11,020, +5.65% from previous year)
- 2014: $210,145 (+$3,984, +1.93% from previous year)
- 2015: $224,763 (+$14,618, +6.96% from previous year)
- 2016: $251,059 (+$26,296, +11.70% from previous year)
- 2017: $271,573 (+$20,514, +8.17% from previous year)
- 2018: $295,093 (+$23,521, +8.66% from previous year)
- 2019: $310,050 (+$14,957, +5.07% from previous year)
- 2020: $327,947 (+$17,897, +5.77% from previous year)
- 2021: $377,204 (+$49,257, +15.02% from previous year)
- 2022: $467,339 (+$90,136, +23.90% from previous year)
- 2023: $458,341 (−$8,999, −1.93% from previous year)
- 2024: $482,976 (+$24,635, +5.37% from previous year)
- 2025: $478,468 (−$4,508, −0.93% from previous year)
Coopertown’s home values rose from just over $203K in 2010 to nearly $478K by 2025. Most of the appreciation occurred after 2016, with a sharp jump in 2022. Prices have cooled slightly since then, but values remain well above pre-pandemic levels.
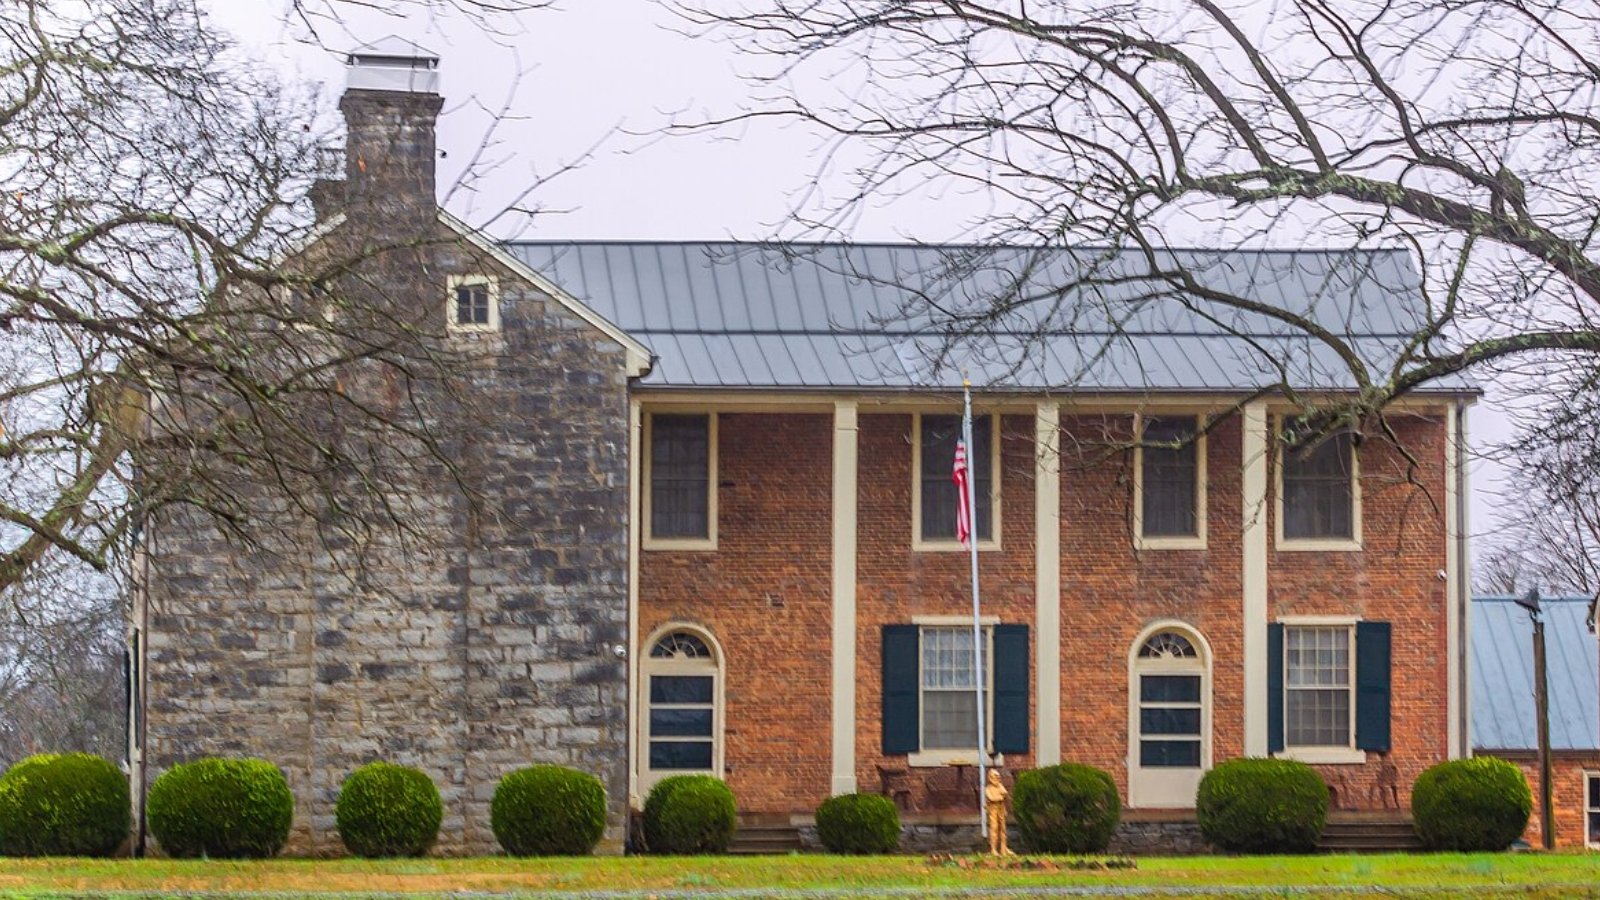
Coopertown – Sharp Growth During Pandemic Boom
Coopertown, located in Robertson County north of Nashville, experienced its biggest housing boom during the COVID-19 pandemic, when prices shot up by nearly 24% in 2022 alone. That rapid growth reflects an influx of homebuyers seeking more space and affordability outside of larger cities.
Though prices dipped in 2023, they quickly rebounded in 2024 before leveling off in 2025. The town’s appeal lies in its balance of rural living and accessibility to Nashville’s job market. Families are drawn by the quiet environment, and ongoing residential development continues to fuel demand.
30. Kingston Springs – 156% Home Price Increase Since 2010
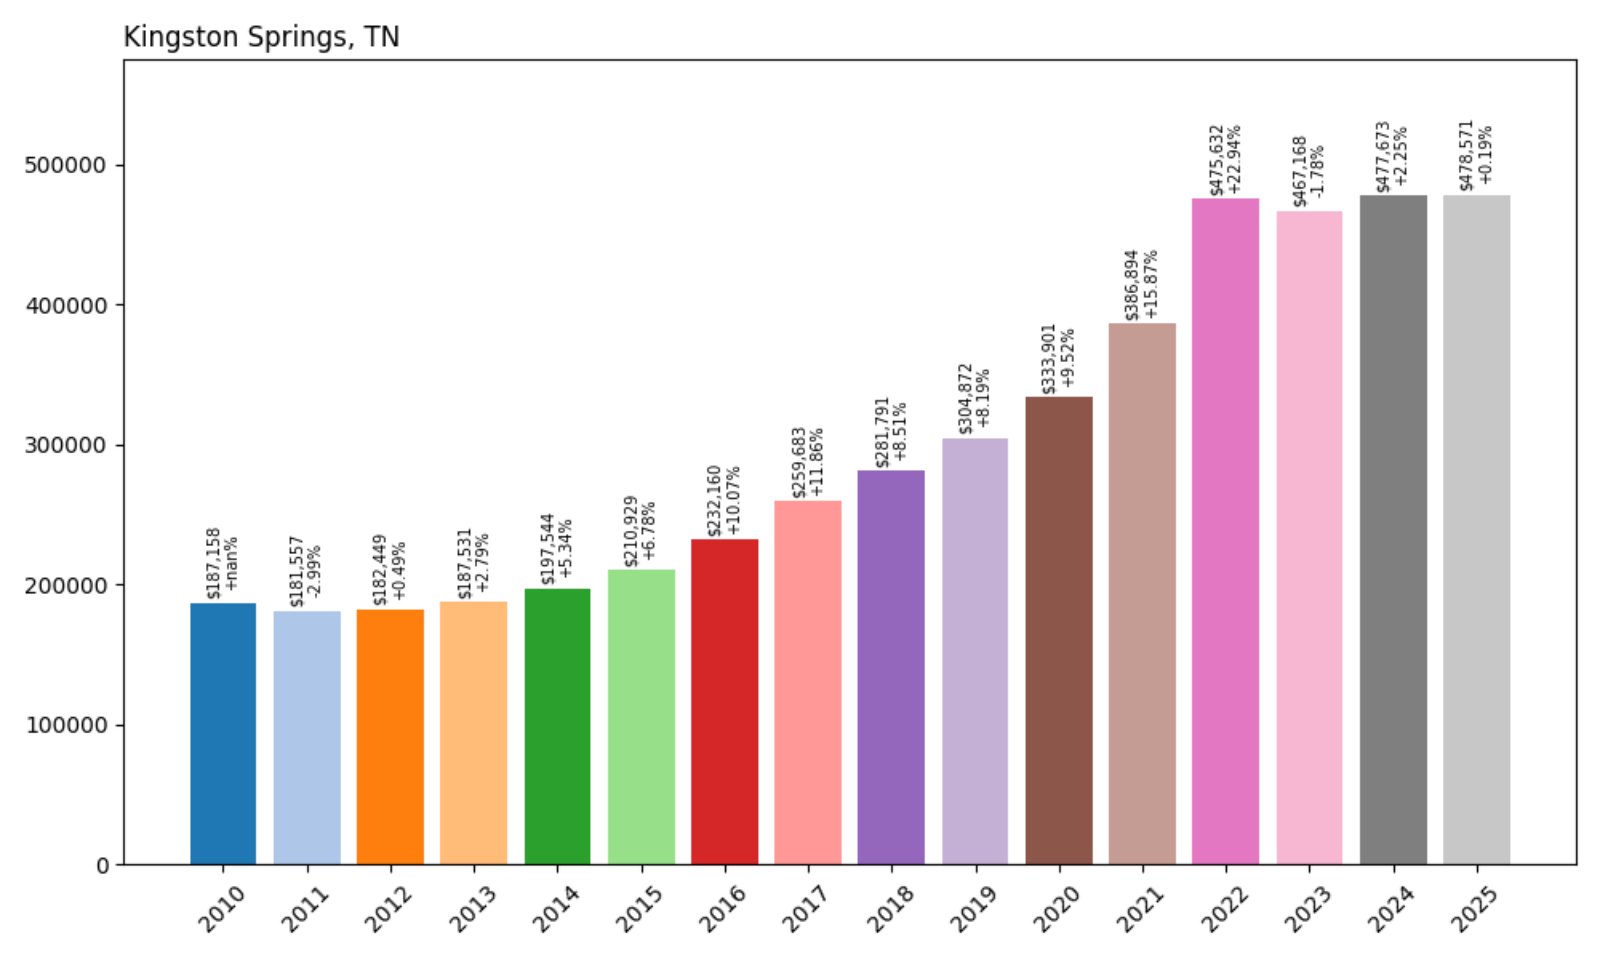
- 2010: $187,158
- 2011: $181,557 (−$5,600, −2.99% from previous year)
- 2012: $182,449 (+$892, +0.49% from previous year)
- 2013: $187,531 (+$5,082, +2.79% from previous year)
- 2014: $197,544 (+$10,013, +5.34% from previous year)
- 2015: $210,929 (+$13,385, +6.78% from previous year)
- 2016: $232,160 (+$21,230, +10.07% from previous year)
- 2017: $259,683 (+$27,523, +11.86% from previous year)
- 2018: $281,791 (+$22,108, +8.51% from previous year)
- 2019: $304,872 (+$23,081, +8.19% from previous year)
- 2020: $333,901 (+$29,029, +9.52% from previous year)
- 2021: $386,894 (+$52,993, +15.87% from previous year)
- 2022: $475,632 (+$88,737, +22.94% from previous year)
- 2023: $467,168 (−$8,463, −1.78% from previous year)
- 2024: $477,673 (+$10,505, +2.25% from previous year)
- 2025: $478,571 (+$898, +0.19% from previous year)
Home values in Kingston Springs have increased over 2.5 times since 2010, reflecting steady long-term growth and a major leap in 2022. Price movements have been more muted in the past couple of years, suggesting a market cooling phase.
Kingston Springs – Quiet, Scenic, and High Demand
Located in Cheatham County just west of Nashville, Kingston Springs offers a mix of small-town charm and proximity to the metro area. Its wooded surroundings and riverside parks attract families and retirees alike. This appeal helped push home prices up significantly between 2015 and 2022.
Recent data shows a plateau in price growth, but demand for homes remains stable thanks to the area’s livability and limited housing stock. Buyers seeking scenic landscapes and slower-paced communities often find Kingston Springs a top contender.
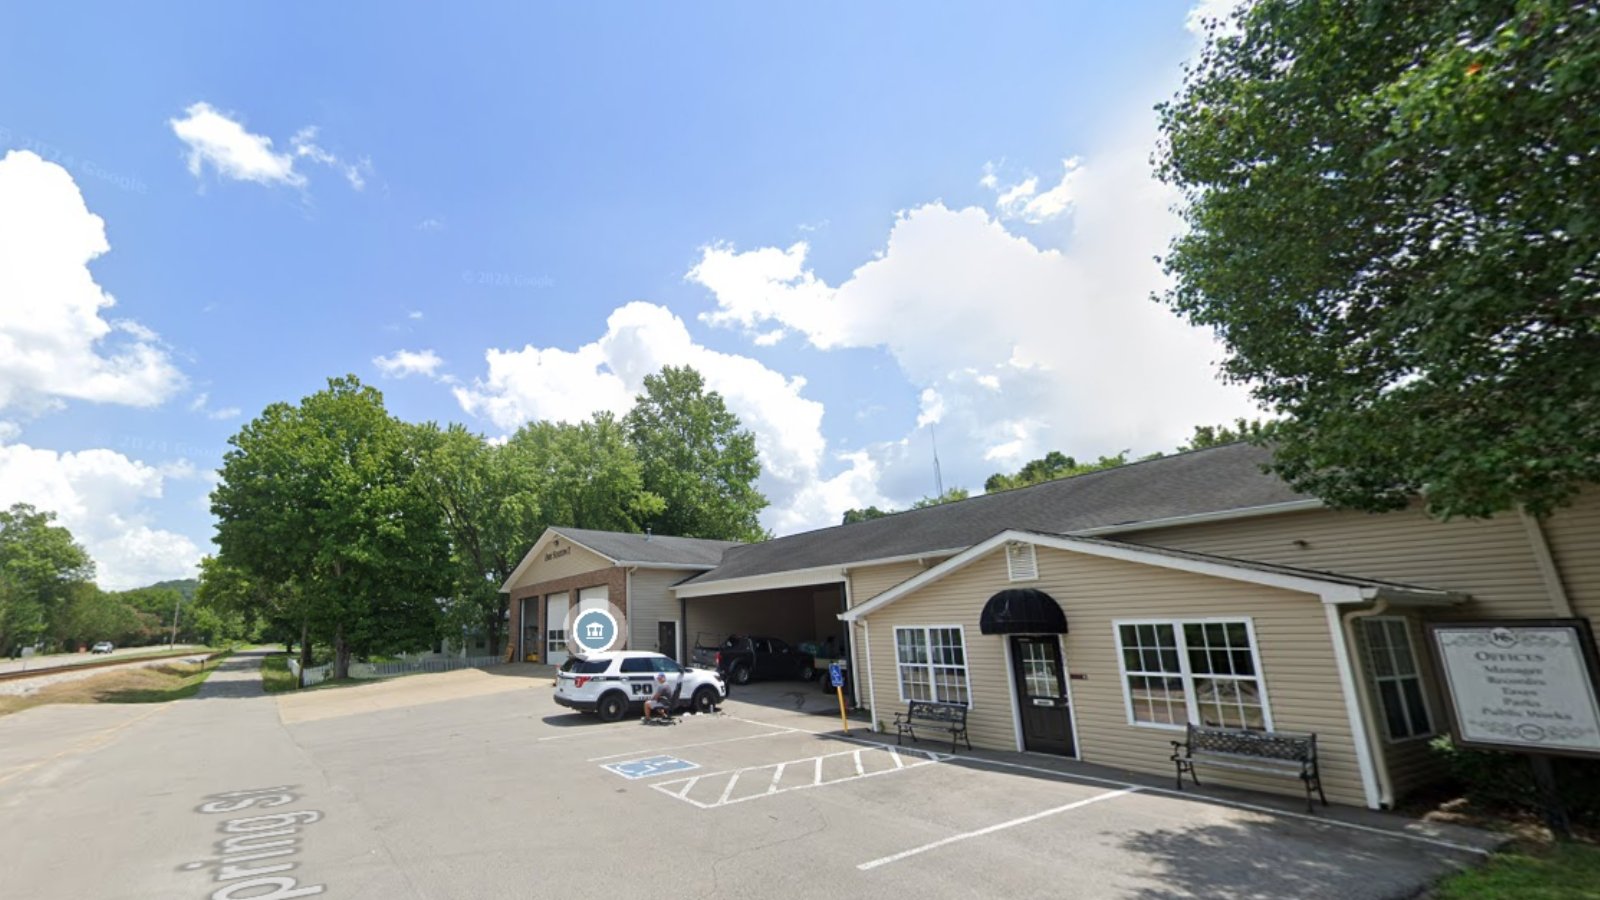
29. Norris – 129% Home Price Increase Since 2010
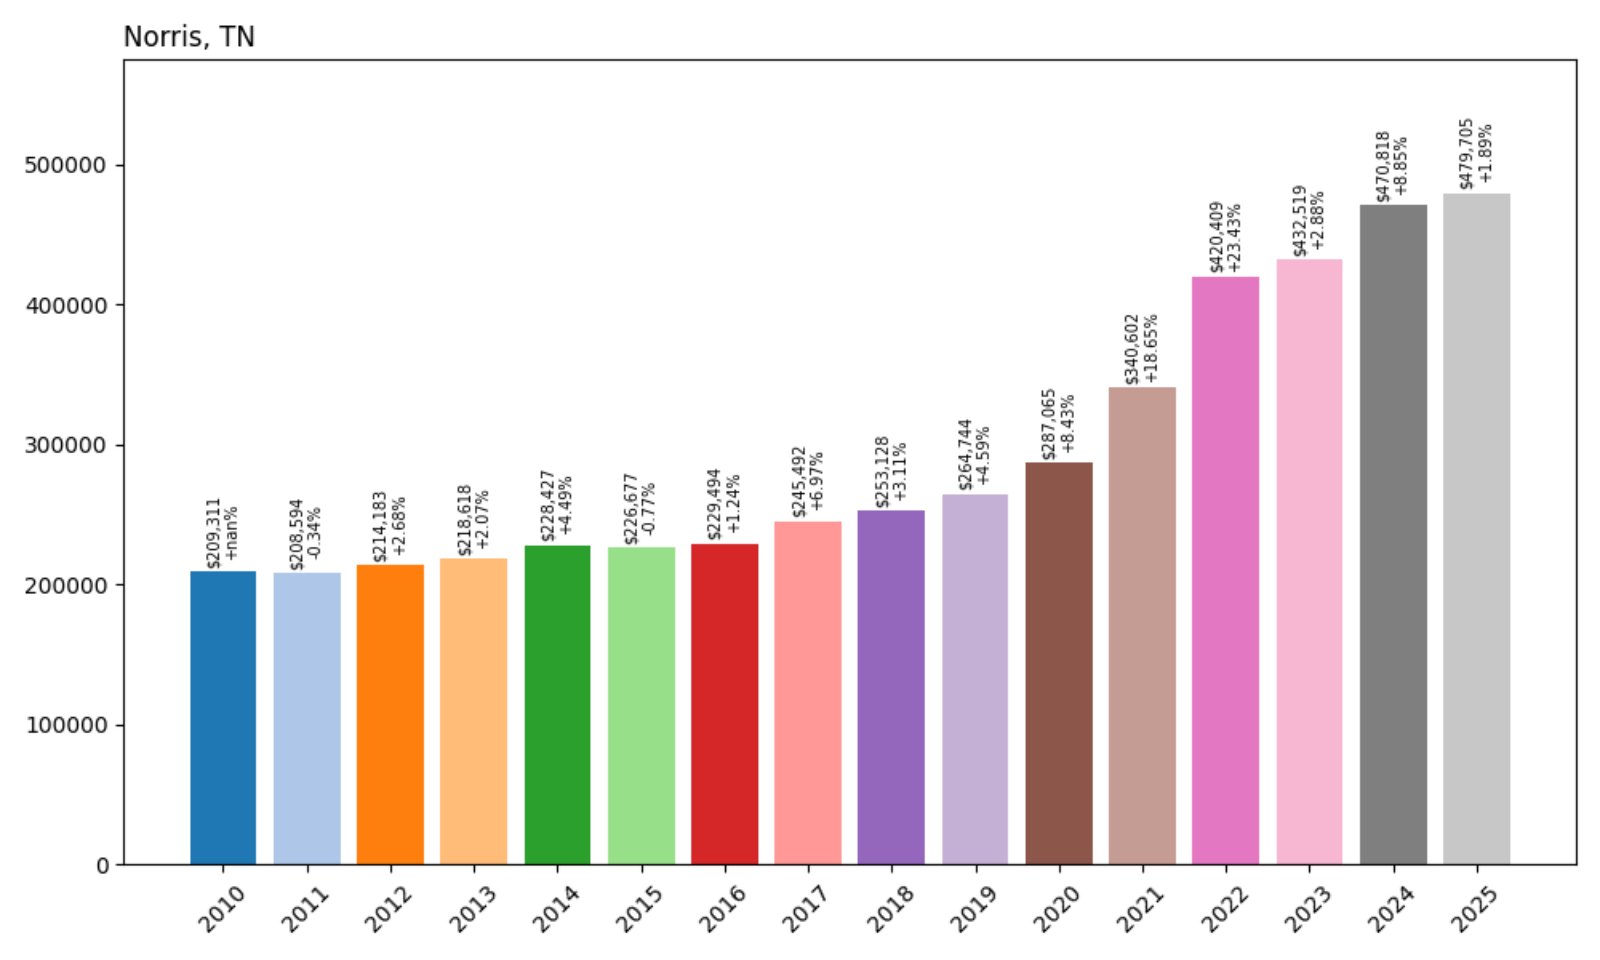
- 2010: $209,311
- 2011: $208,594 (−$717, −0.34% from previous year)
- 2012: $214,183 (+$5,588, +2.68% from previous year)
- 2013: $218,618 (+$4,435, +2.07% from previous year)
- 2014: $228,427 (+$9,809, +4.49% from previous year)
- 2015: $226,677 (−$1,751, −0.77% from previous year)
- 2016: $229,494 (+$2,817, +1.24% from previous year)
- 2017: $245,492 (+$15,998, +6.97% from previous year)
- 2018: $253,128 (+$7,636, +3.11% from previous year)
- 2019: $264,744 (+$11,616, +4.59% from previous year)
- 2020: $287,065 (+$22,321, +8.43% from previous year)
- 2021: $340,602 (+$53,537, +18.65% from previous year)
- 2022: $420,409 (+$79,807, +23.43% from previous year)
- 2023: $432,519 (+$12,109, +2.88% from previous year)
- 2024: $470,818 (+$38,299, +8.85% from previous year)
- 2025: $479,705 (+$8,888, +1.89% from previous year)
Norris home values have climbed from around $209K in 2010 to nearly $480K in 2025. Though the early years saw modest growth, a large jump came between 2020 and 2022. Prices have continued to rise steadily since, with strong performance even in the past two years.
Norris – Mid-Sized Market With Post-2020 Momentum
Norris, a historic planned community northeast of Knoxville, has seen a marked increase in home values since the pandemic began. Once relatively stable in price, the town’s housing market began accelerating in 2020, driven by renewed interest in small-town living and low inventory.
Its proximity to Norris Lake and outdoor recreation areas has attracted retirees and remote workers, contributing to demand. With prices up nearly 130% in 15 years, Norris now ranks among Tennessee’s more expensive markets despite its modest size.
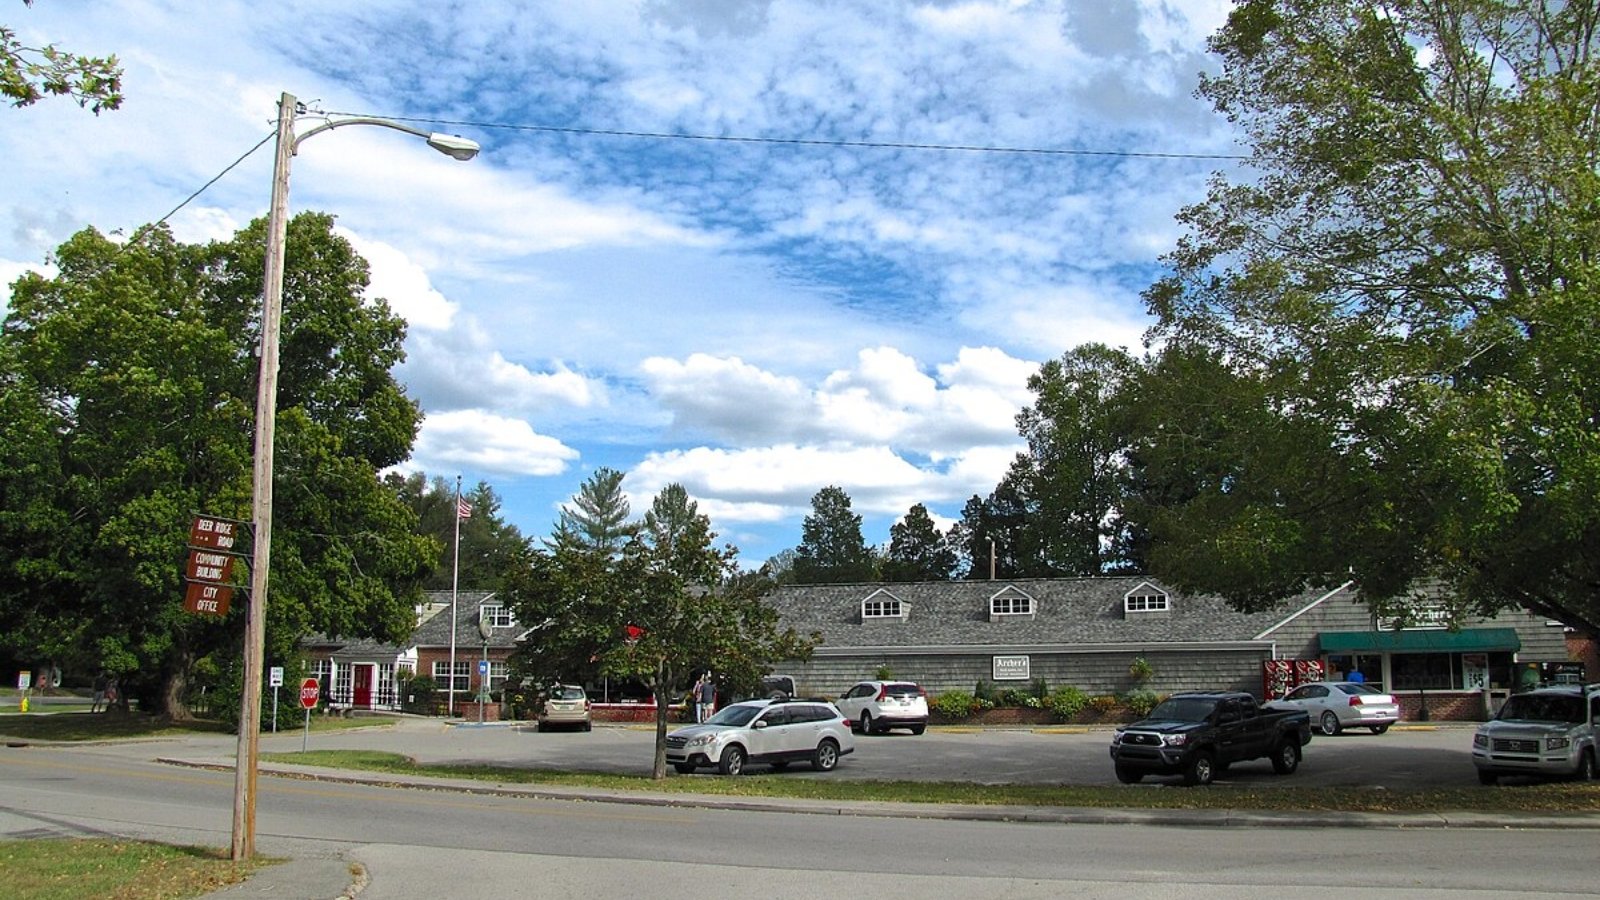
28. Rockvale – 167% Home Price Increase Since 2010
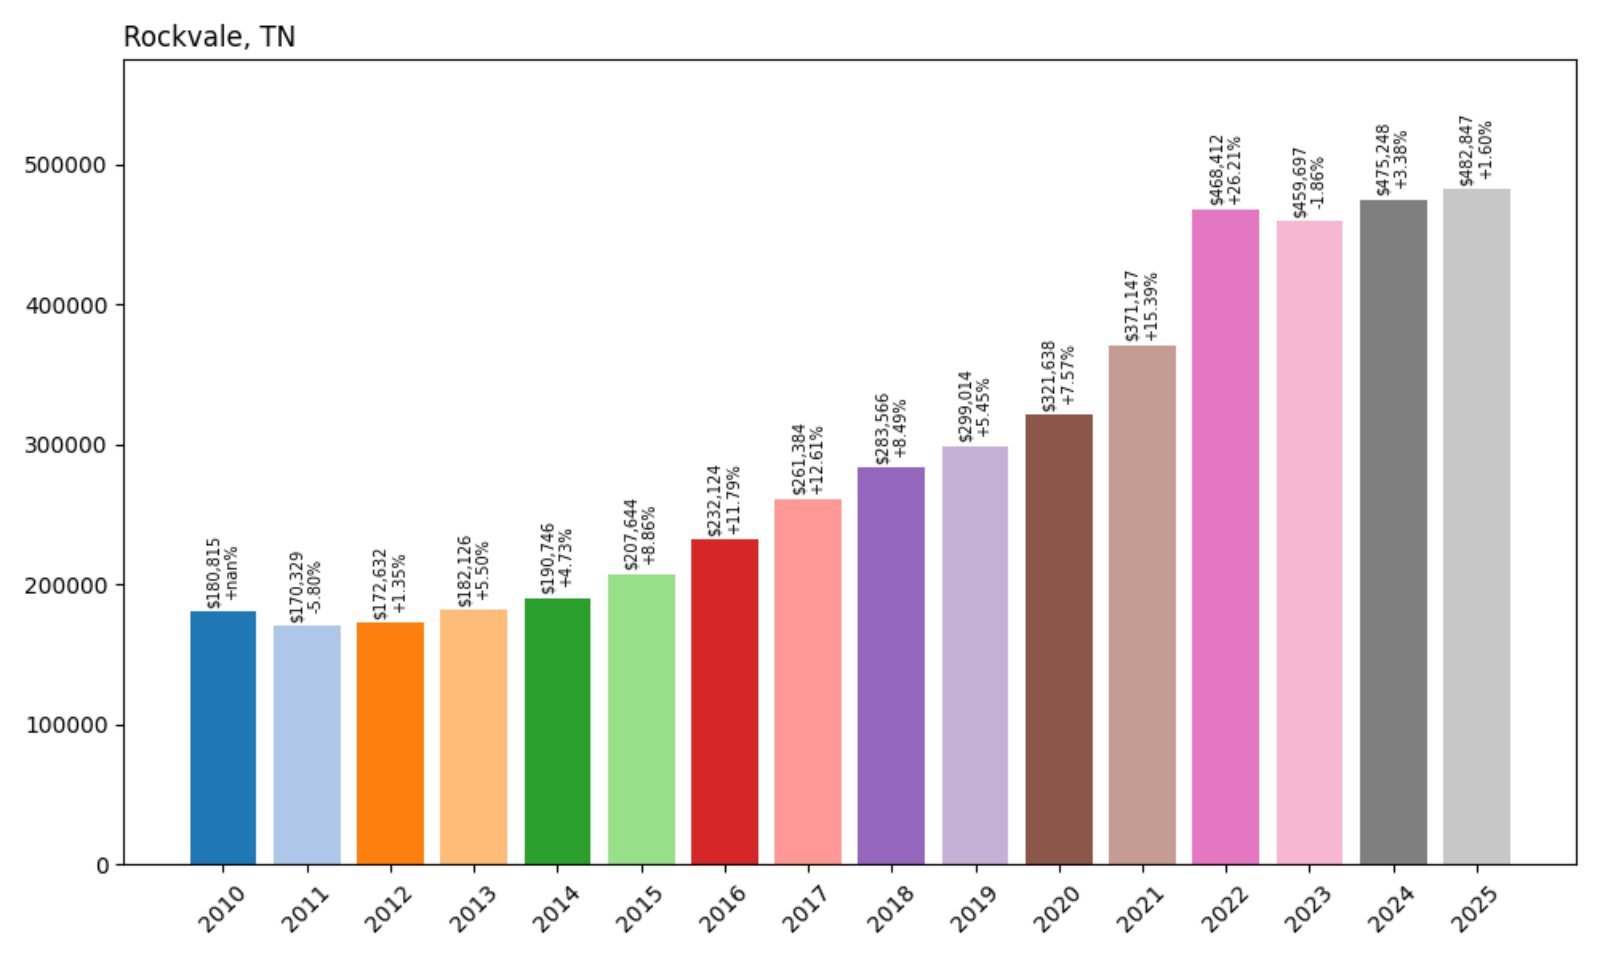
- 2010: $180,815
- 2011: $170,329 (−$10,486, −5.80% from previous year)
- 2012: $172,632 (+$2,303, +1.35% from previous year)
- 2013: $182,126 (+$9,494, +5.50% from previous year)
- 2014: $190,746 (+$8,620, +4.73% from previous year)
- 2015: $207,644 (+$16,898, +8.86% from previous year)
- 2016: $232,124 (+$24,480, +11.79% from previous year)
- 2017: $261,384 (+$29,260, +12.61% from previous year)
- 2018: $283,566 (+$22,182, +8.49% from previous year)
- 2019: $299,014 (+$15,447, +5.45% from previous year)
- 2020: $321,638 (+$22,624, +7.57% from previous year)
- 2021: $371,147 (+$49,510, +15.39% from previous year)
- 2022: $468,412 (+$97,265, +26.21% from previous year)
- 2023: $459,697 (−$8,715, −1.86% from previous year)
- 2024: $475,248 (+$15,551, +3.38% from previous year)
- 2025: $482,847 (+$7,599, +1.60% from previous year)
From just $181K in 2010 to nearly $483K in 2025, Rockvale has experienced one of the largest percentage jumps in home value in Tennessee. Its most significant gains happened from 2020 through 2022, with a brief dip in 2023 followed by renewed growth.
Rockvale – Major Growth on Rutherford County’s Western Edge
Rockvale has transformed rapidly from a rural farming area into a high-demand residential hub. Located near Murfreesboro, it’s benefited from Rutherford County’s broader expansion and infrastructure improvements like the new Rockvale High School, which opened in 2019.
The town’s popularity surged post-2020, when space-seeking buyers flocked to outer-ring suburbs. Though 2023 saw a minor dip, prices rebounded, signaling strong ongoing demand. Limited supply and desirable schools continue to drive its high ranking among Tennessee’s priciest towns.
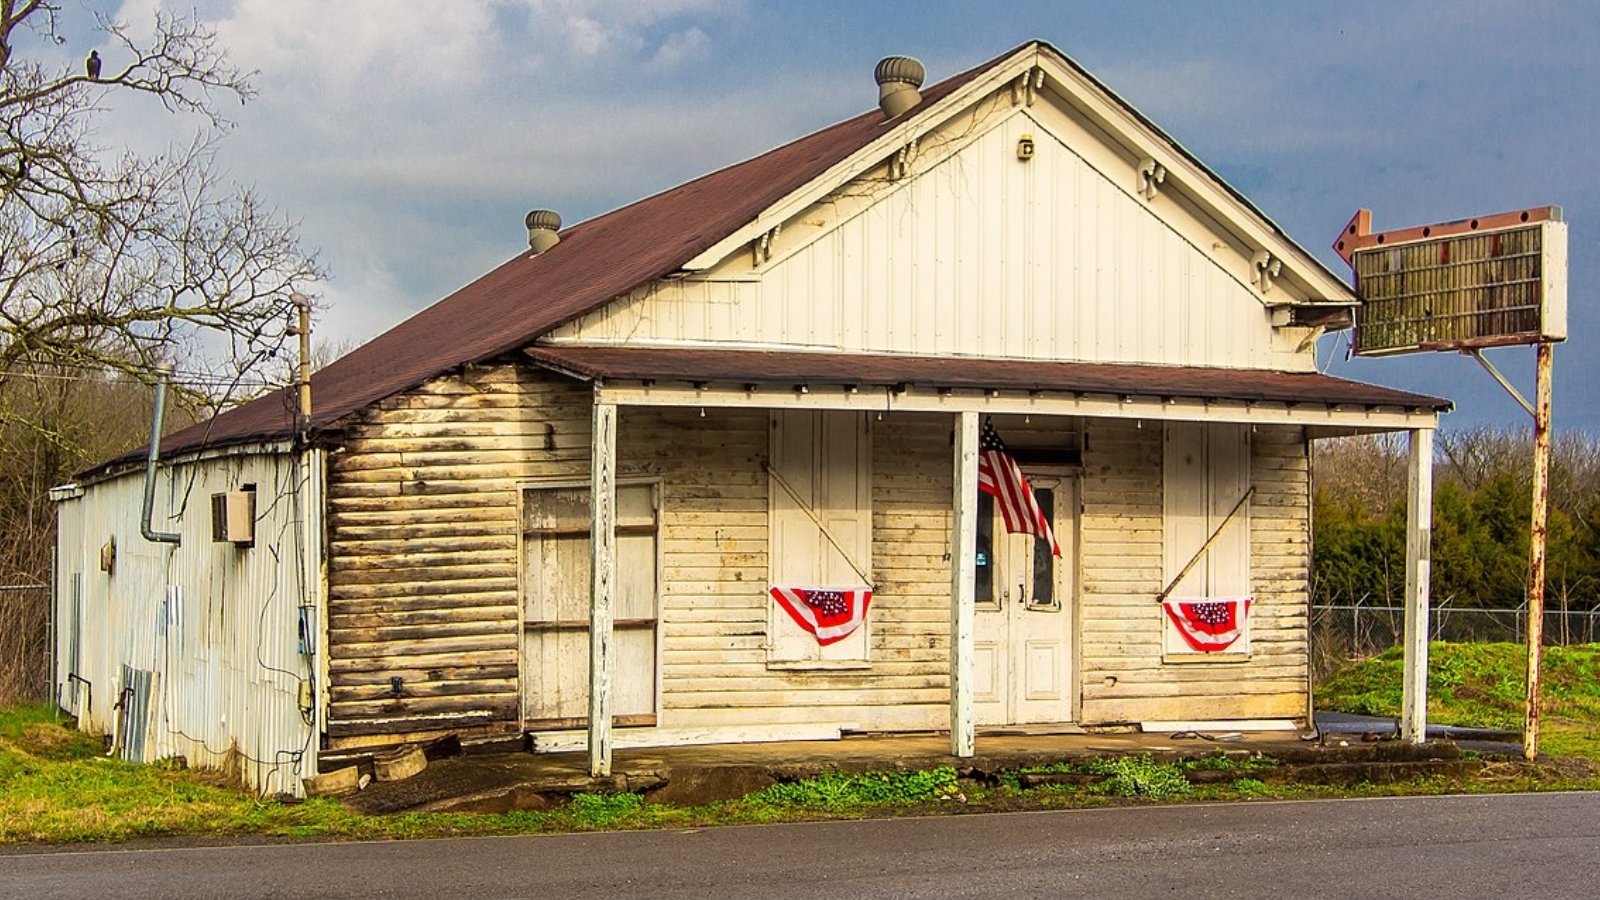
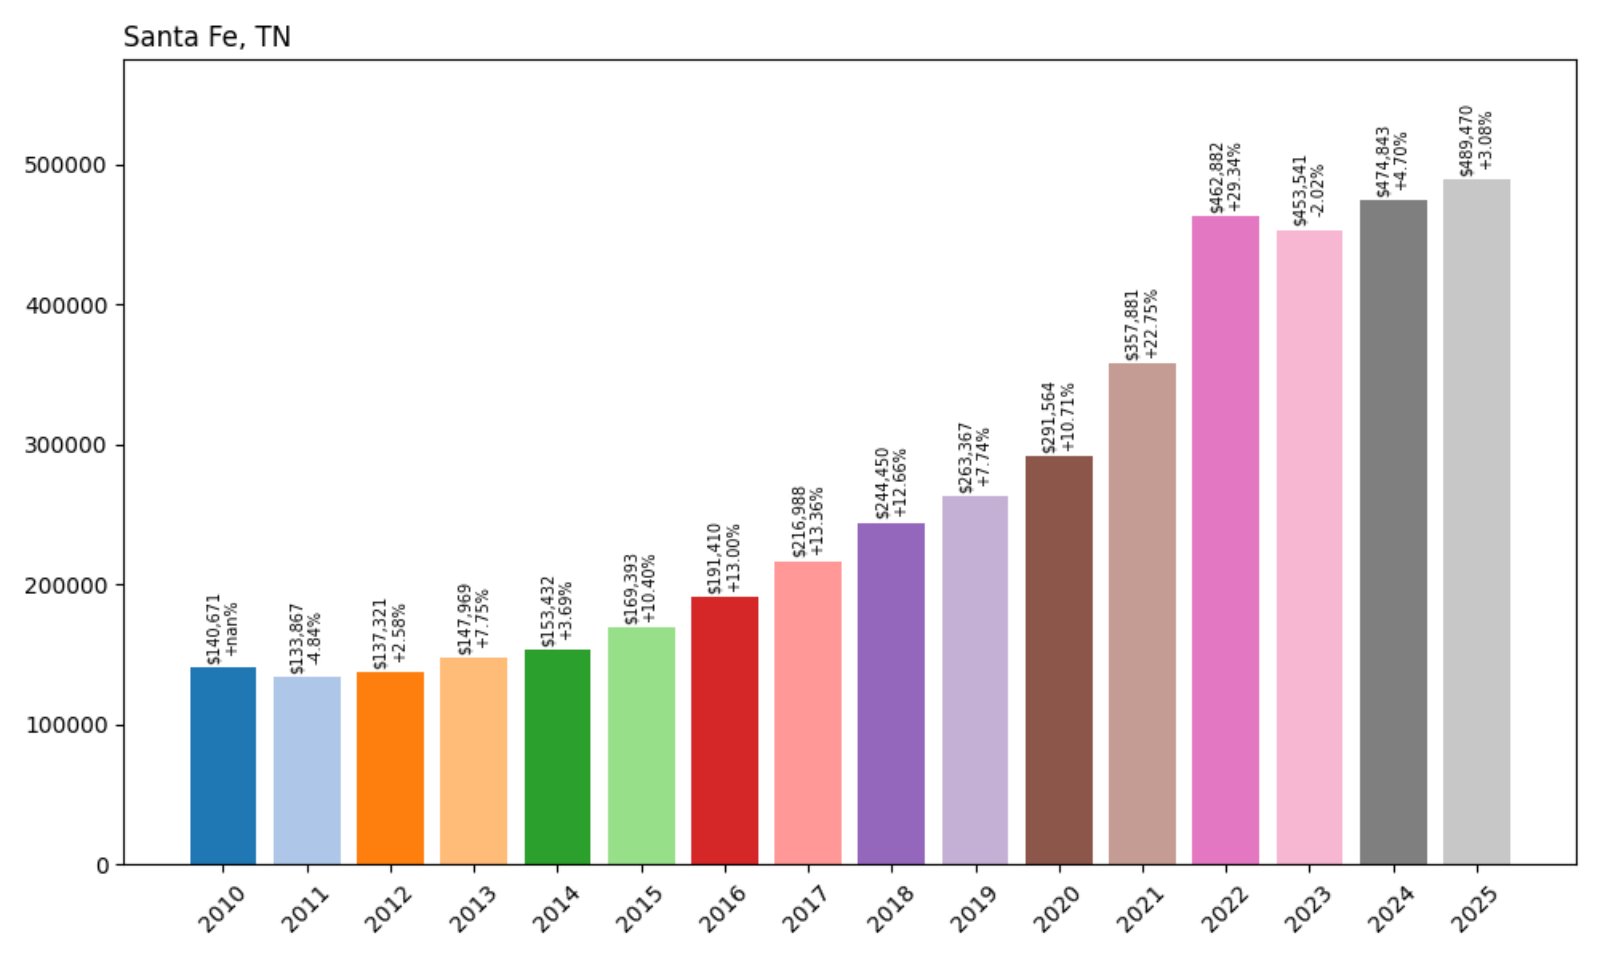
27. Santa Fe – 248% Home Price Increase Since 2010
🔥 Would you like to save this?
- 2010: $140,671
- 2011: $133,867 (−$6,804, −4.84% from previous year)
- 2012: $137,321 (+$3,453, +2.58% from previous year)
- 2013: $147,969 (+$10,649, +7.75% from previous year)
- 2014: $153,432 (+$5,462, +3.69% from previous year)
- 2015: $169,393 (+$15,961, +10.40% from previous year)
- 2016: $191,410 (+$22,017, +13.00% from previous year)
- 2017: $216,988 (+$25,578, +13.36% from previous year)
- 2018: $244,450 (+$27,462, +12.66% from previous year)
- 2019: $263,367 (+$18,917, +7.74% from previous year)
- 2020: $291,564 (+$28,197, +10.71% from previous year)
- 2021: $357,881 (+$66,316, +22.75% from previous year)
- 2022: $462,882 (+$105,001, +29.34% from previous year)
- 2023: $453,541 (−$9,341, −2.02% from previous year)
- 2024: $474,843 (+$21,302, +4.70% from previous year)
- 2025: $489,470 (+$14,627, +3.08% from previous year)
Santa Fe has seen a massive increase in home prices since 2010—nearly 2.5 times higher today. The sharpest jumps occurred between 2015 and 2022, with some correction afterward. The trend remains upward overall.
Santa Fe – Huge Growth Driven by Rural Appeal
Situated in Maury County, Santa Fe’s rural setting, scenic farmland, and increasing appeal to remote workers helped push prices higher over the past decade. Buyers seeking space and privacy without straying far from Columbia or Nashville took notice during the housing rush of the 2020s.
While prices dipped slightly in 2023, they rebounded the following two years. Ongoing development, new homes on large parcels, and growing interest in rural living keep Santa Fe firmly in Tennessee’s top tier for home values.
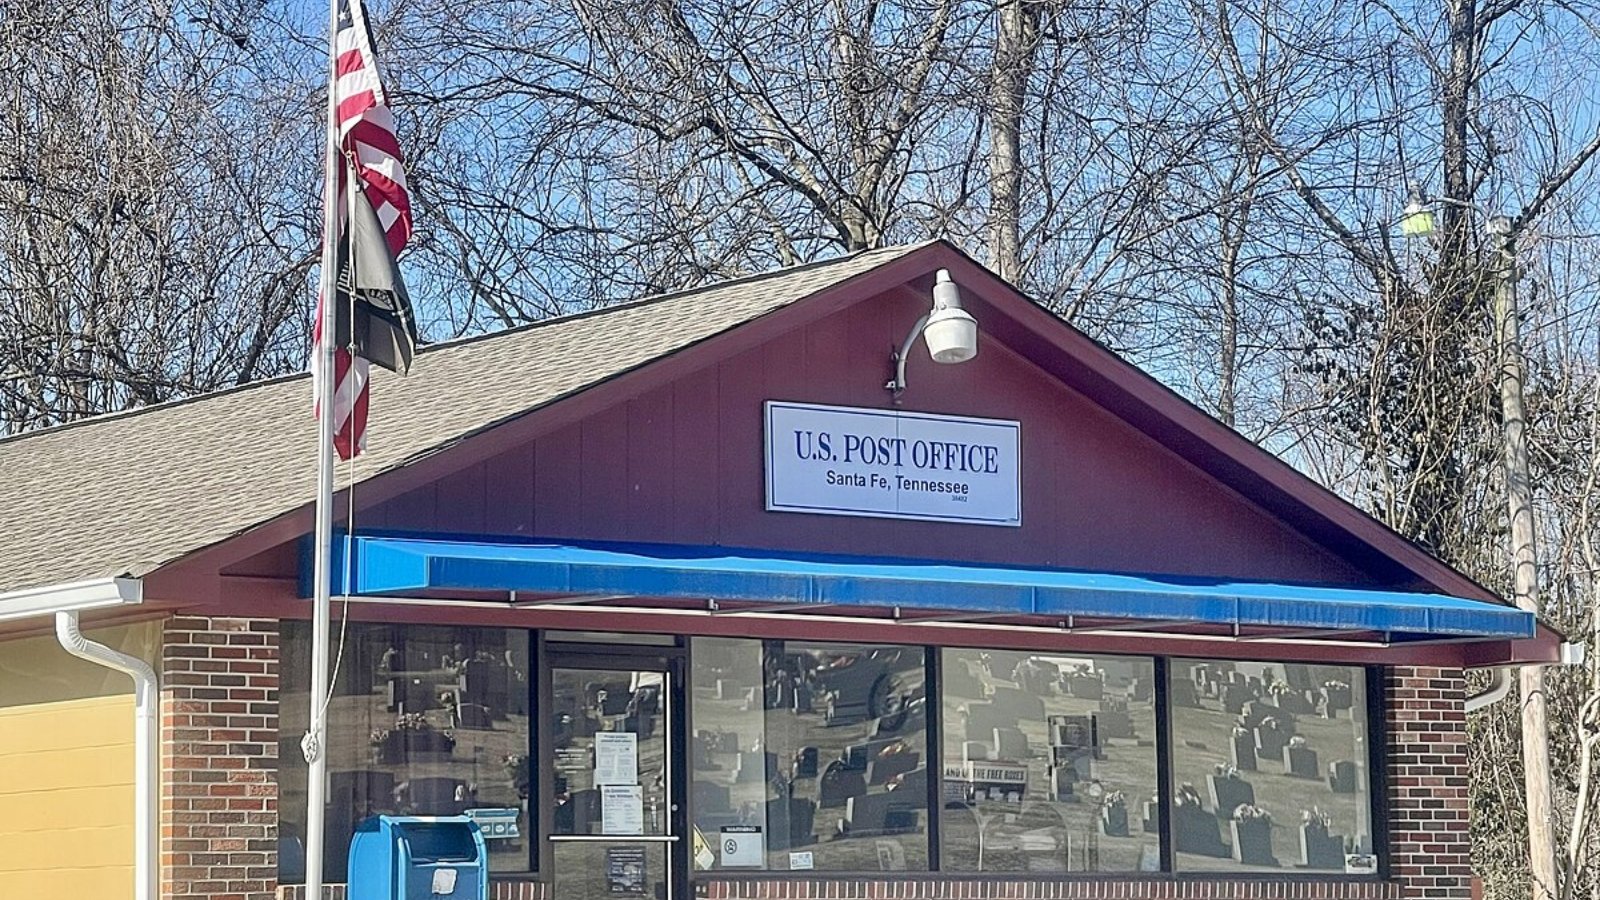
26. Loudon – 127% Home Price Increase Since 2010
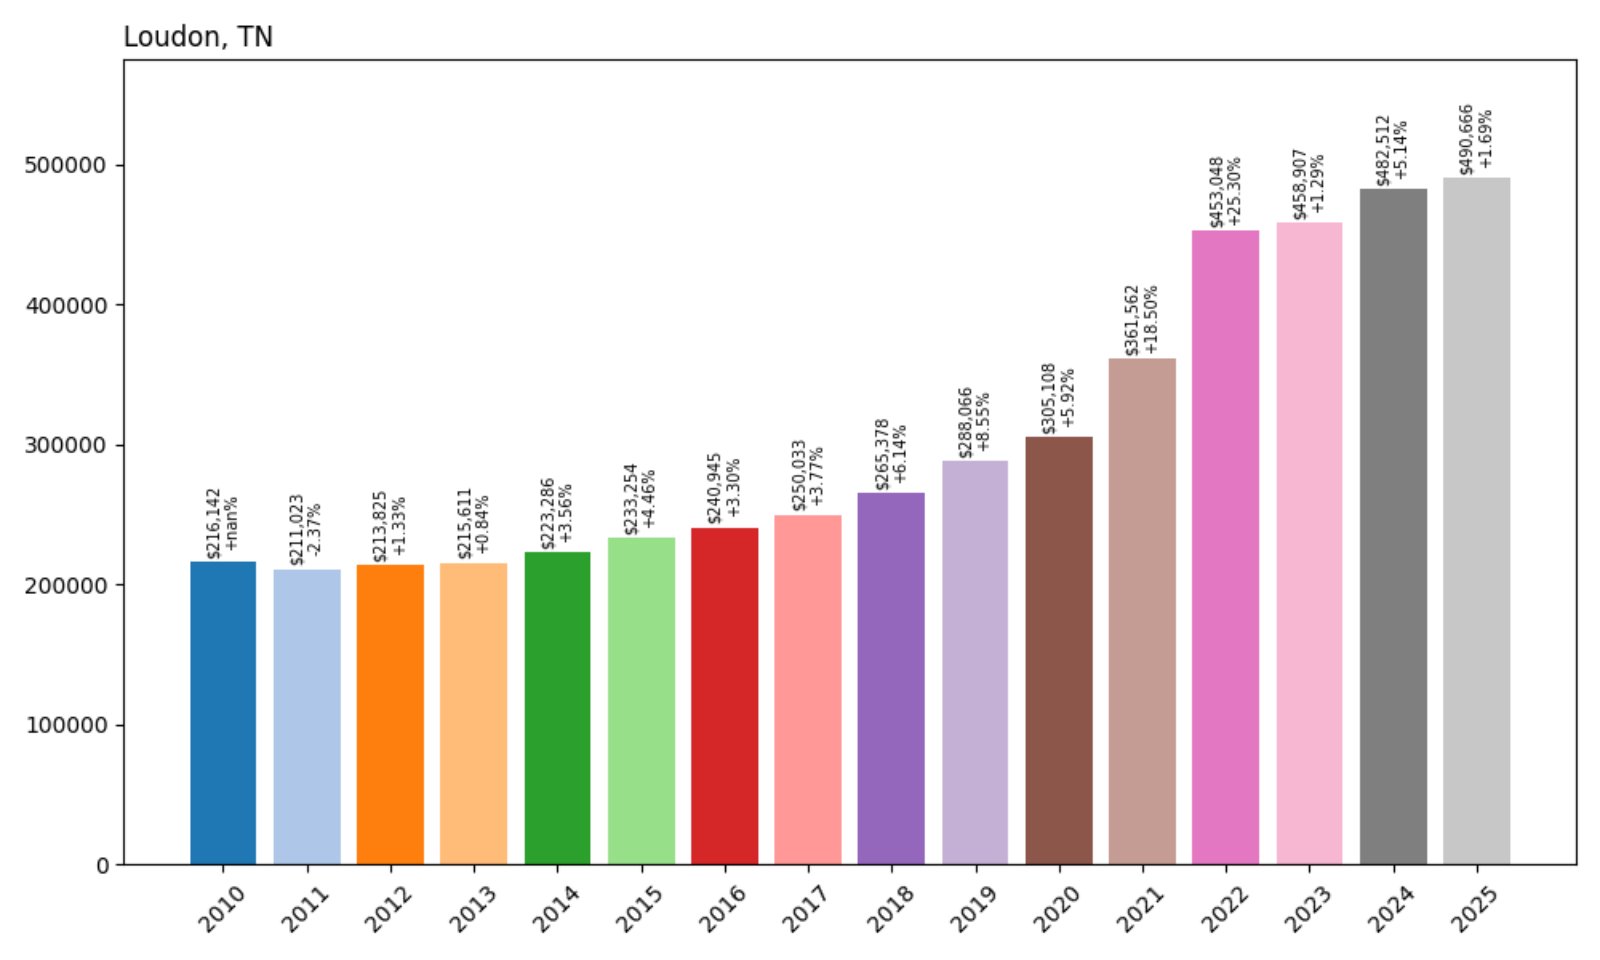
- 2010: $216,142
- 2011: $211,023 (−$5,119, −2.37% from previous year)
- 2012: $213,825 (+$2,803, +1.33% from previous year)
- 2013: $215,611 (+$1,786, +0.84% from previous year)
- 2014: $223,286 (+$7,675, +3.56% from previous year)
- 2015: $233,254 (+$9,968, +4.46% from previous year)
- 2016: $240,945 (+$7,691, +3.30% from previous year)
- 2017: $250,033 (+$9,088, +3.77% from previous year)
- 2018: $265,378 (+$15,346, +6.14% from previous year)
- 2019: $288,066 (+$22,688, +8.55% from previous year)
- 2020: $305,108 (+$17,042, +5.92% from previous year)
- 2021: $361,562 (+$56,455, +18.50% from previous year)
- 2022: $453,048 (+$91,486, +25.30% from previous year)
- 2023: $458,907 (+$5,859, +1.29% from previous year)
- 2024: $482,512 (+$23,605, +5.14% from previous year)
- 2025: $490,666 (+$8,154, +1.69% from previous year)
Loudon’s home prices have more than doubled since 2010, topping $490K in 2025. The biggest jumps occurred in 2021 and 2022, and while recent years brought steadier gains, values continue to trend upward.
Loudon – East Tennessee’s Rising Market
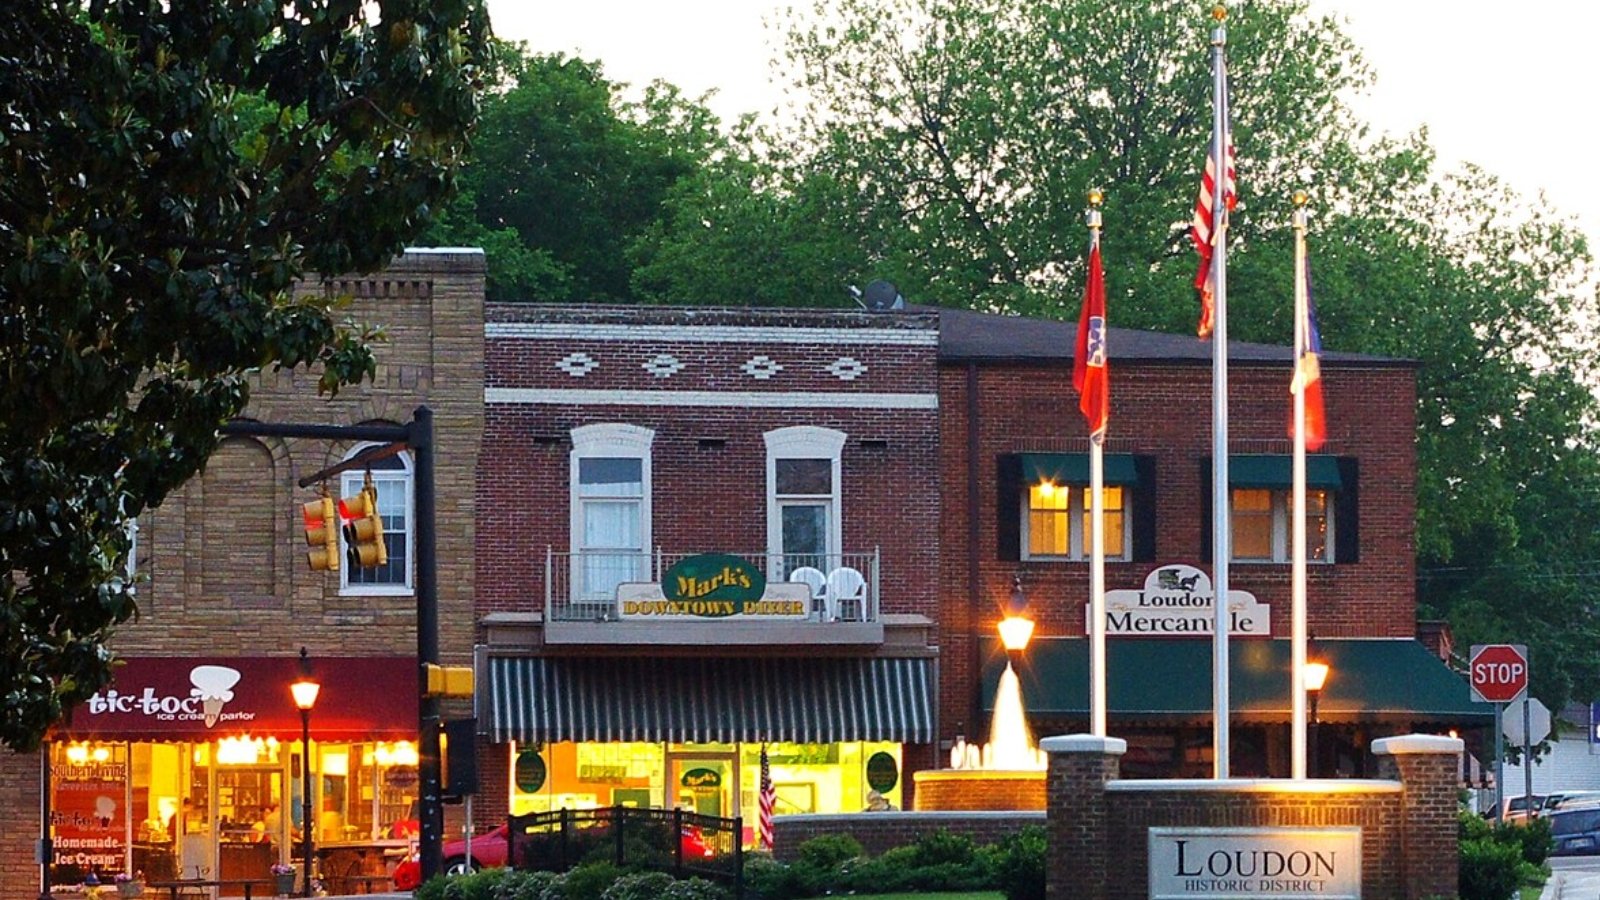
Located southwest of Knoxville, Loudon has drawn homebuyers thanks to its lakeside location and easy access to I-75. The town gained attention from retirees and out-of-state buyers seeking affordable property near water and mountains.
The surge in values from 2020 to 2022 reflects Loudon’s growing popularity, and while appreciation has slowed since then, the town’s amenities and scenic setting continue to support strong demand and price stability.
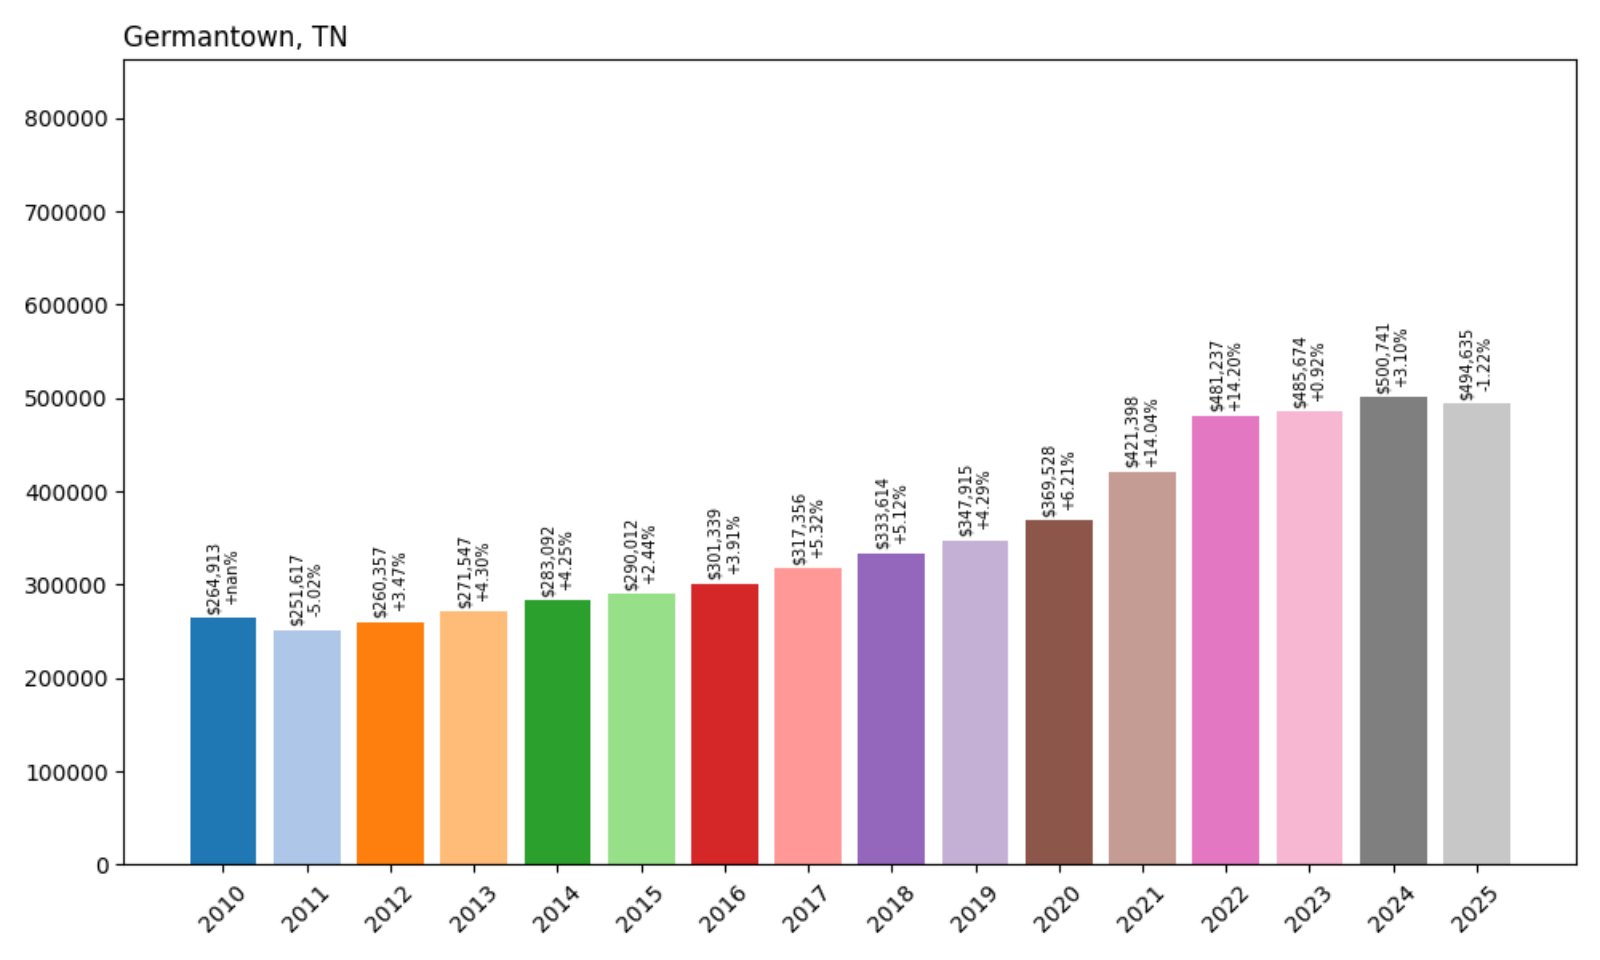
25. Germantown – 87% Home Price Increase Since 2010
- 2010: $264,913
- 2011: $251,617 (−$13,296, −5.02% from previous year)
- 2012: $260,357 (+$8,740, +3.47% from previous year)
- 2013: $271,547 (+$11,190, +4.30% from previous year)
- 2014: $283,092 (+$11,546, +4.25% from previous year)
- 2015: $290,012 (+$6,920, +2.44% from previous year)
- 2016: $301,339 (+$11,327, +3.91% from previous year)
- 2017: $317,356 (+$16,017, +5.32% from previous year)
- 2018: $333,614 (+$16,258, +5.12% from previous year)
- 2019: $347,915 (+$14,301, +4.29% from previous year)
- 2020: $369,528 (+$21,613, +6.21% from previous year)
- 2021: $421,398 (+$51,870, +14.04% from previous year)
- 2022: $481,237 (+$59,839, +14.20% from previous year)
- 2023: $485,674 (+$4,437, +0.92% from previous year)
- 2024: $500,741 (+$15,067, +3.10% from previous year)
- 2025: $494,635 (−$6,106, −1.22% from previous year)
Germantown’s home values increased from around $265K in 2010 to nearly $495K in 2025. Prices surged sharply between 2020 and 2022, followed by a slight retreat in 2025. Even with the recent dip, the town maintains one of the highest price points in the Memphis metro area.
Germantown – Strong Market With Recent Softening
One of the most affluent suburbs in the Memphis area, Germantown is known for its top-rated schools, walkable downtown, and well-maintained parks. These advantages made it a magnet for homebuyers during the post-2020 boom, pushing prices well past half a million in some areas.
While home values have softened slightly in 2025, the town remains a premium destination with strong fundamentals. Its location, amenities, and stability continue to make it one of the most desirable—and expensive—places to live in West Tennessee.
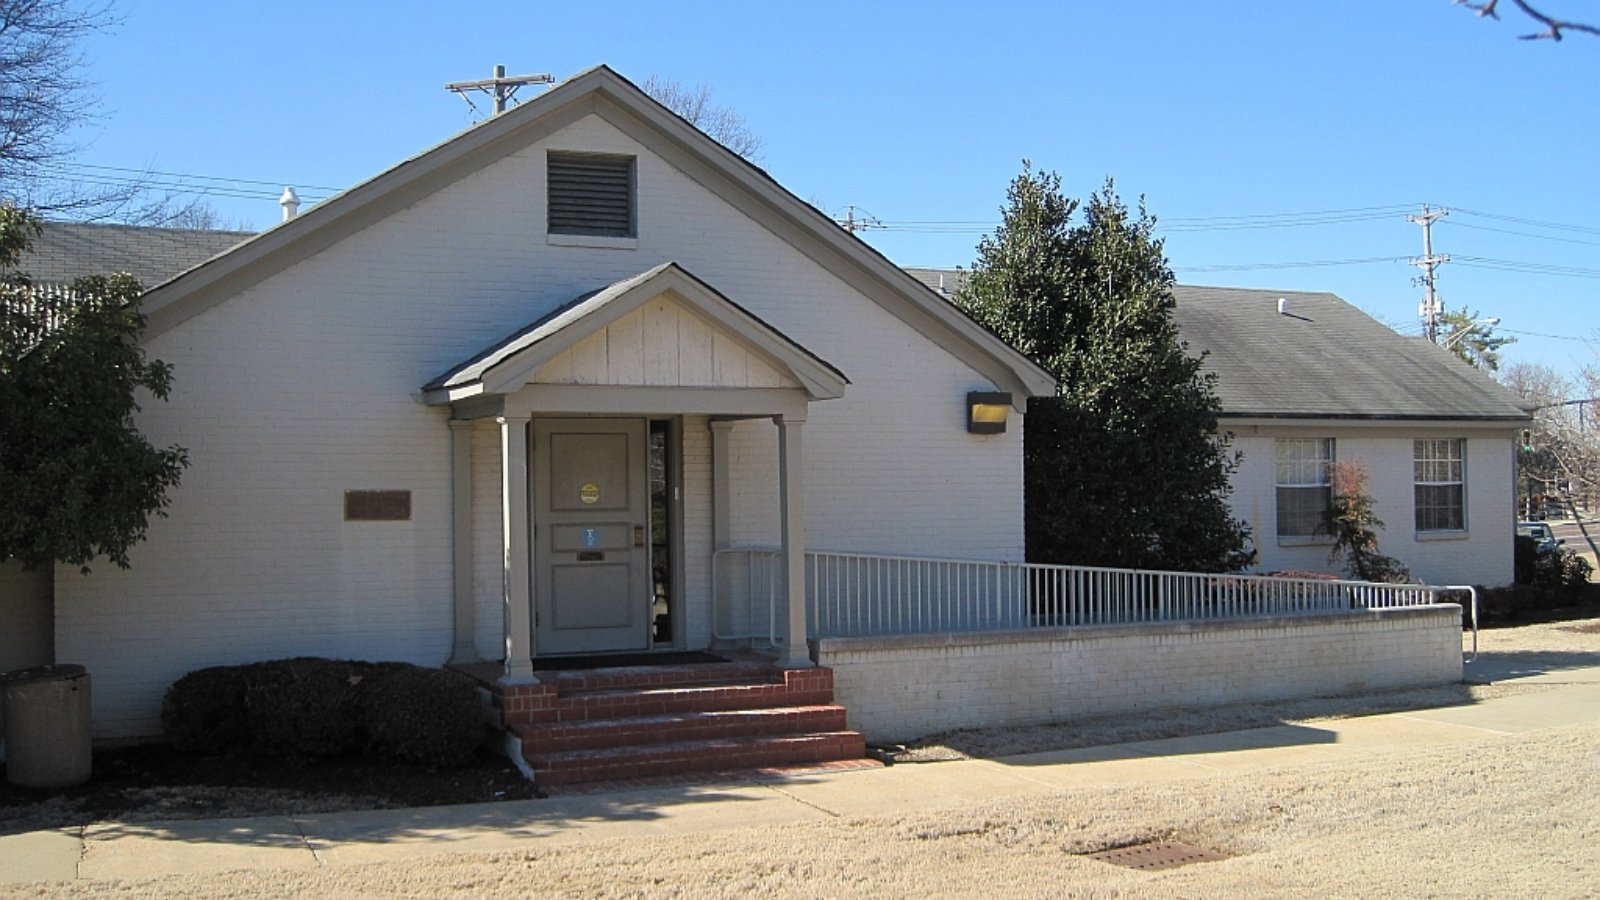
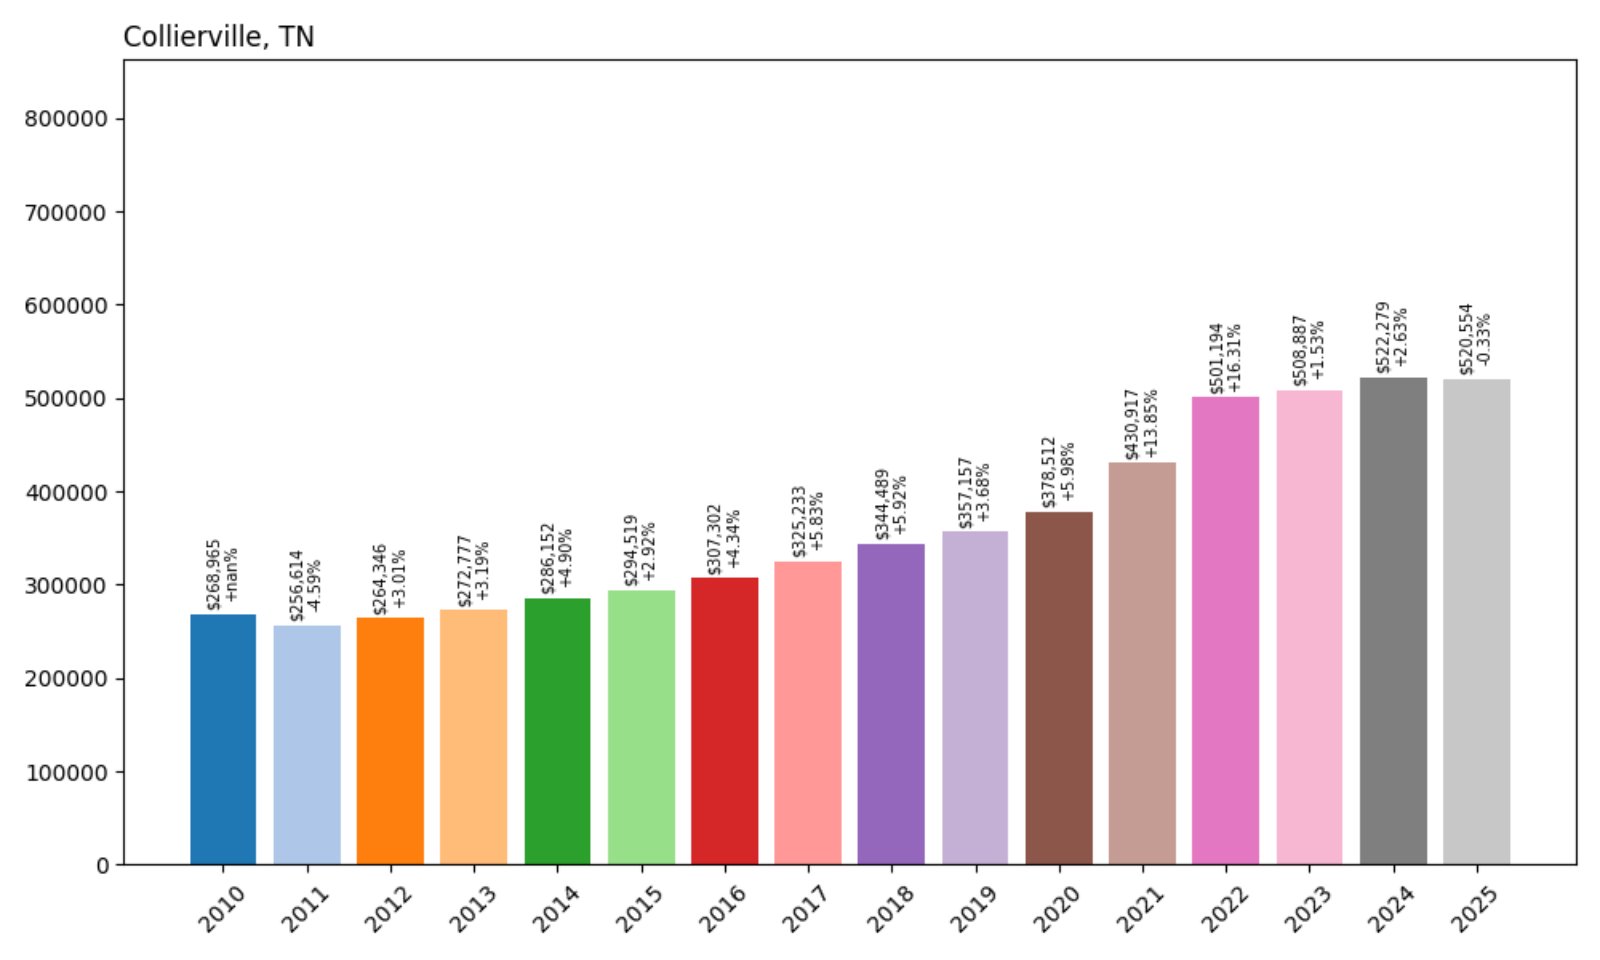
24. Collierville – 93% Home Price Increase Since 2010
- 2010: $268,965
- 2011: $256,614 (−$12,351, −4.59% from previous year)
- 2012: $264,346 (+$7,732, +3.01% from previous year)
- 2013: $272,777 (+$8,431, +3.19% from previous year)
- 2014: $286,152 (+$13,375, +4.90% from previous year)
- 2015: $294,519 (+$8,366, +2.92% from previous year)
- 2016: $307,302 (+$12,783, +4.34% from previous year)
- 2017: $325,233 (+$17,931, +5.83% from previous year)
- 2018: $344,489 (+$19,256, +5.92% from previous year)
- 2019: $357,157 (+$12,668, +3.68% from previous year)
- 2020: $378,512 (+$21,355, +5.98% from previous year)
- 2021: $430,917 (+$52,406, +13.85% from previous year)
- 2022: $501,194 (+$70,276, +16.31% from previous year)
- 2023: $508,887 (+$7,693, +1.53% from previous year)
- 2024: $522,279 (+$13,392, +2.63% from previous year)
- 2025: $520,554 (−$1,725, −0.33% from previous year)
Home prices in Collierville have risen nearly 93% since 2010. After a decade of steady growth, the biggest increases came in 2021 and 2022. Values flattened out in 2023–2025, signaling a more stable but still elevated market.
Collierville – Consistent Growth in a Family-Focused Suburb
Located east of Memphis, Collierville is a favorite among families for its top-rated schools, vibrant town square, and low crime rates. Its housing market grew at a consistent pace through the 2010s, before a steep uptick in 2021–2022.
Even with a slight dip in 2025, home values remain high, thanks to the town’s infrastructure, economic stability, and high quality of life. New construction in planned communities continues to bring in buyers from across the region.
23. Hendersonville – 135% Home Price Increase Since 2010
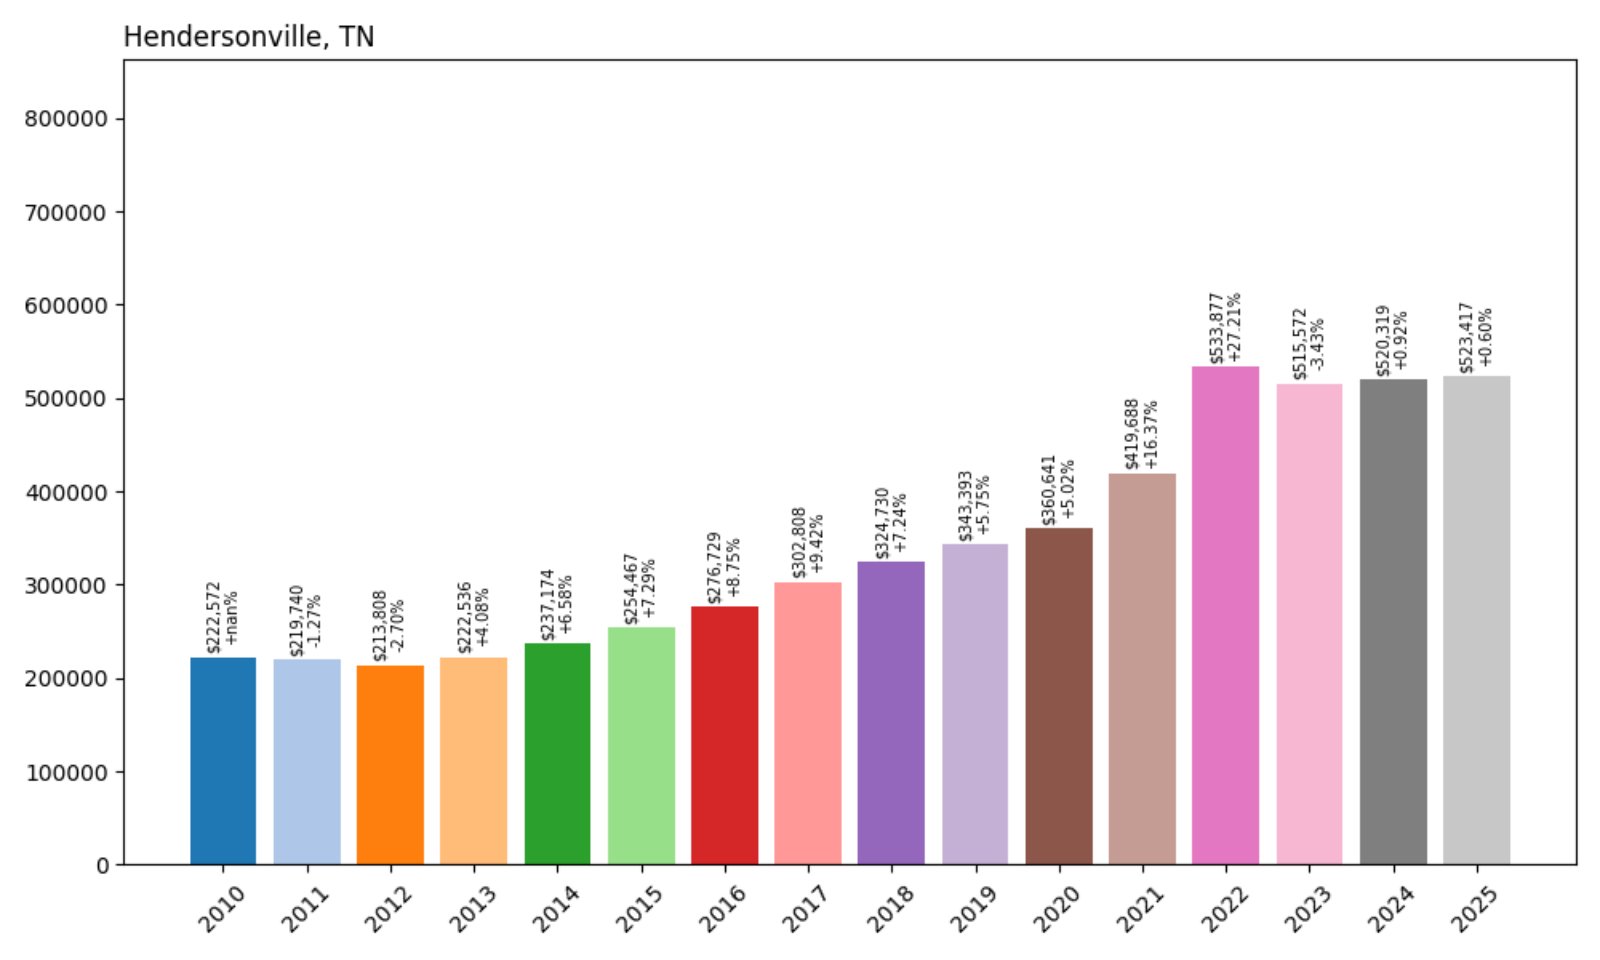
- 2010: $222,572
- 2011: $219,740 (−$2,832, −1.27% from previous year)
- 2012: $213,808 (−$5,932, −2.70% from previous year)
- 2013: $222,536 (+$8,728, +4.08% from previous year)
- 2014: $237,174 (+$14,638, +6.58% from previous year)
- 2015: $254,467 (+$17,294, +7.29% from previous year)
- 2016: $276,729 (+$22,262, +8.75% from previous year)
- 2017: $302,808 (+$26,080, +9.42% from previous year)
- 2018: $324,730 (+$21,922, +7.24% from previous year)
- 2019: $343,393 (+$18,663, +5.75% from previous year)
- 2020: $360,641 (+$17,248, +5.02% from previous year)
- 2021: $419,688 (+$59,047, +16.37% from previous year)
- 2022: $533,877 (+$114,189, +27.21% from previous year)
- 2023: $515,572 (−$18,305, −3.43% from previous year)
- 2024: $520,319 (+$4,747, +0.92% from previous year)
- 2025: $523,417 (+$3,098, +0.60% from previous year)
Hendersonville’s home values increased by over $300K since 2010. The market peaked sharply in 2022 and has seen only minor changes since, suggesting a stabilizing but still competitive market.
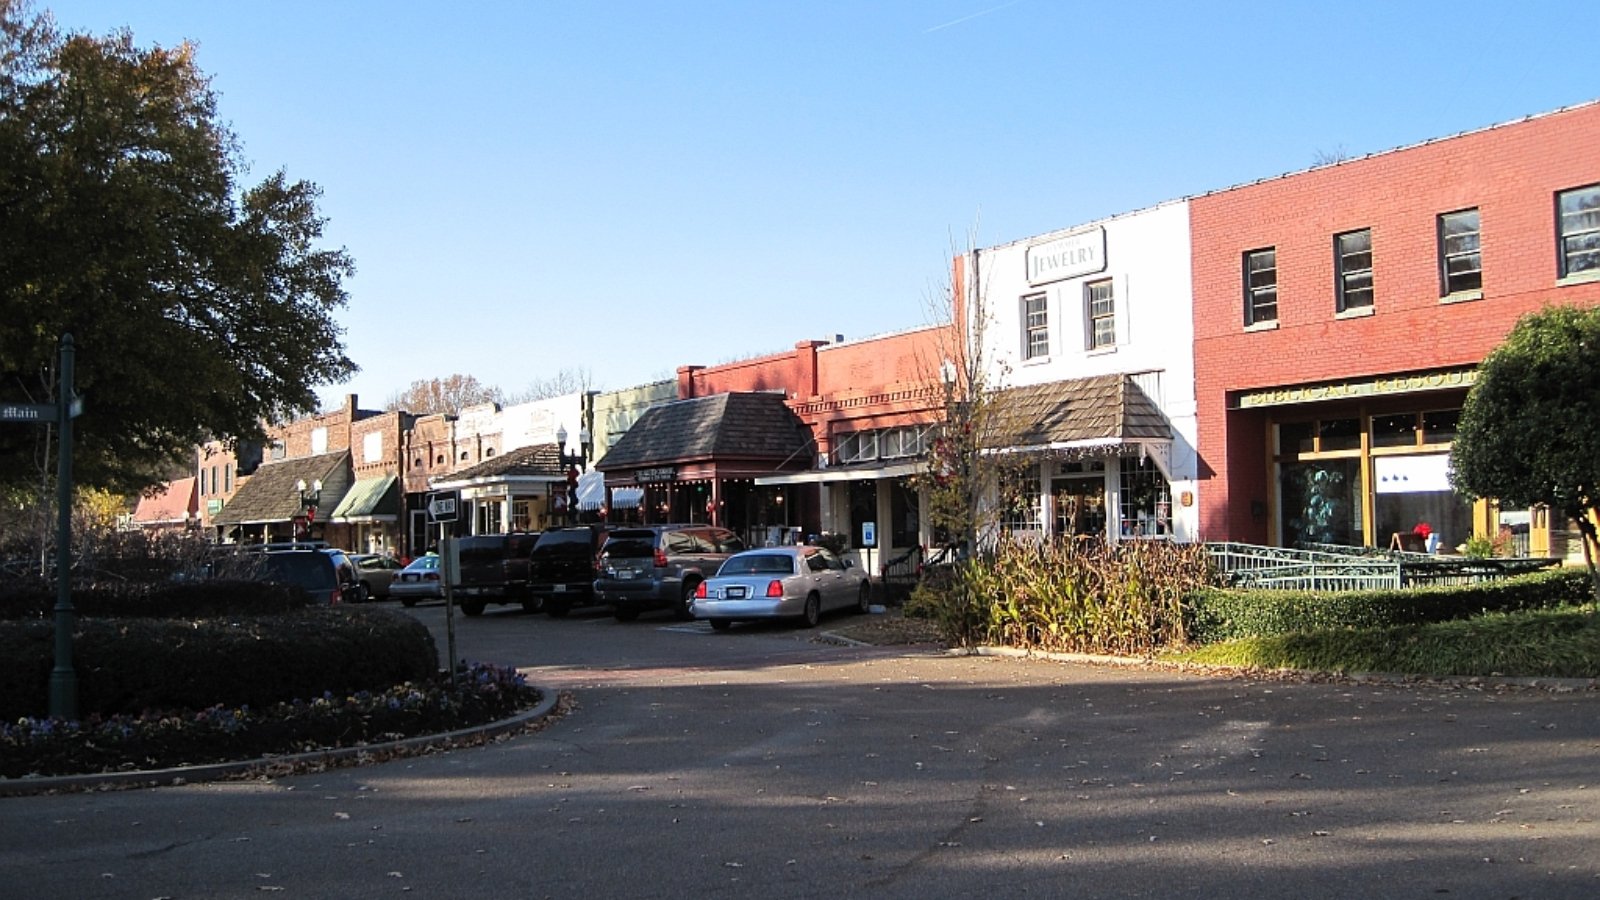
Hendersonville – Lakefront Living With Metro Access
Located northeast of Nashville along Old Hickory Lake, Hendersonville blends scenic lakefront properties with suburban convenience. Its access to major highways and growing retail sector have supported consistent housing demand.
The spike in values in 2021 and 2022 mirrored broader trends in the Nashville metro. Although prices have plateaued recently, the area’s mix of water recreation, school quality, and proximity to Nashville continues to attract homebuyers.
22. Eagleville – 203% Home Price Increase Since 2010
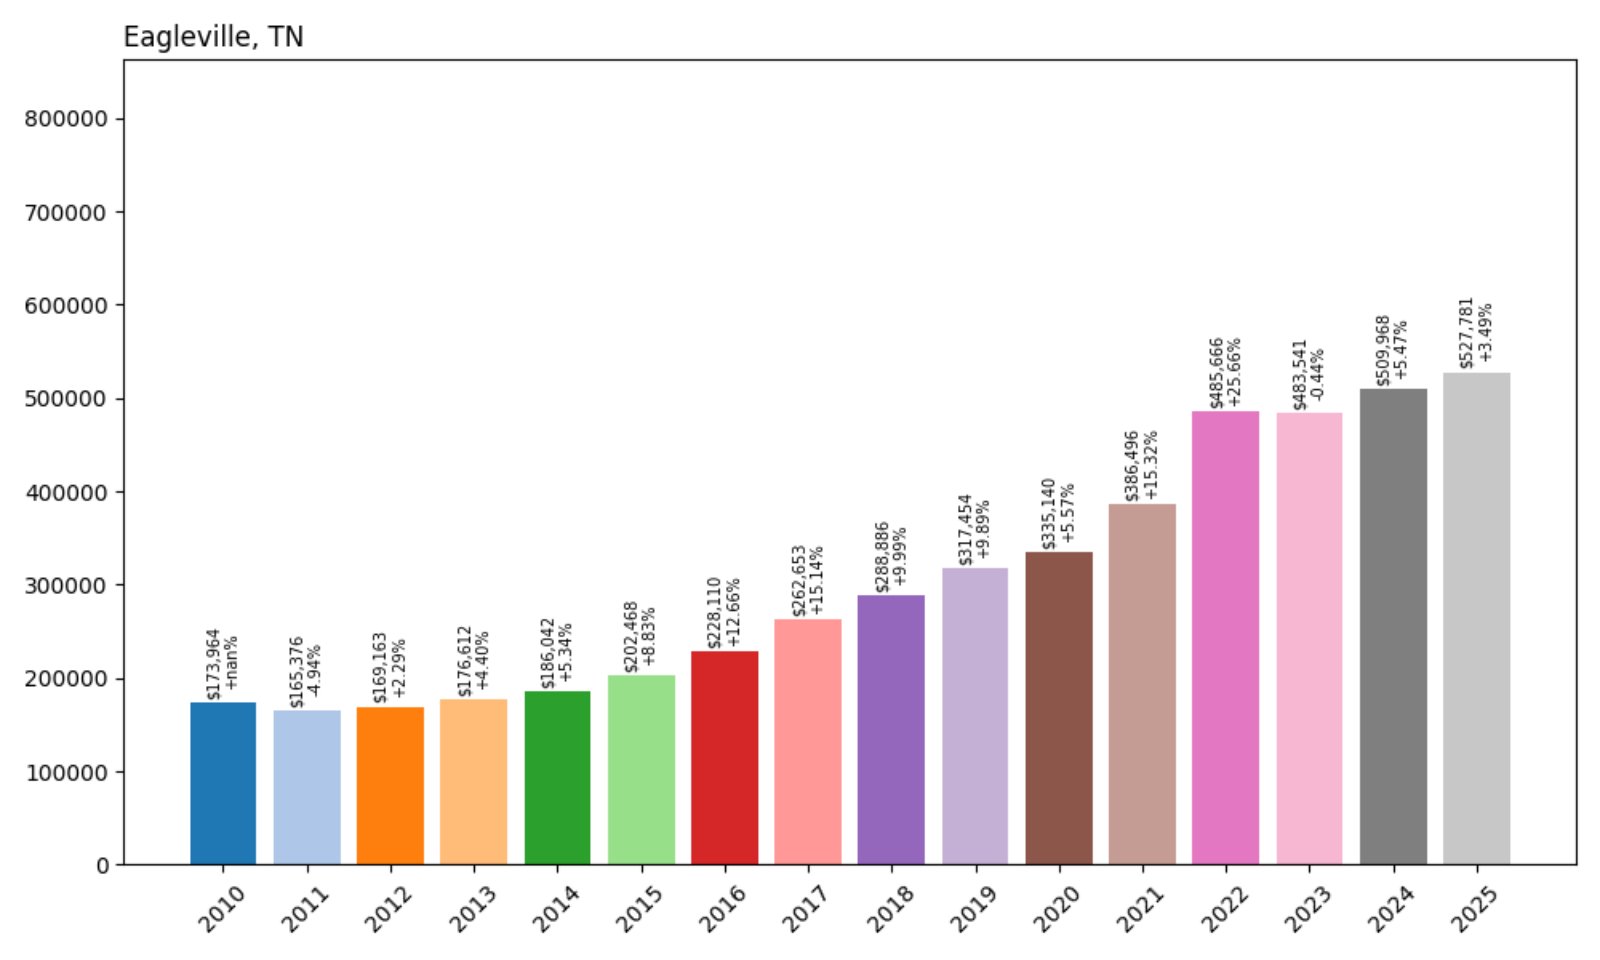
- 2010: $173,964
- 2011: $165,376 (−$8,588, −4.94% from previous year)
- 2012: $169,163 (+$3,786, +2.29% from previous year)
- 2013: $176,612 (+$7,449, +4.40% from previous year)
- 2014: $186,042 (+$9,430, +5.34% from previous year)
- 2015: $202,468 (+$16,425, +8.83% from previous year)
- 2016: $228,110 (+$25,642, +12.66% from previous year)
- 2017: $262,653 (+$34,543, +15.14% from previous year)
- 2018: $288,886 (+$26,233, +9.99% from previous year)
- 2019: $317,454 (+$28,568, +9.89% from previous year)
- 2020: $335,140 (+$17,686, +5.57% from previous year)
- 2021: $386,496 (+$51,356, +15.32% from previous year)
- 2022: $485,666 (+$99,169, +25.66% from previous year)
- 2023: $483,541 (−$2,125, −0.44% from previous year)
- 2024: $509,968 (+$26,428, +5.47% from previous year)
- 2025: $527,781 (+$17,813, +3.49% from previous year)
Home prices in Eagleville have more than tripled in 15 years, jumping from $174K to $528K. The biggest growth phase came during the post-2020 housing boom, though prices have continued climbing since.
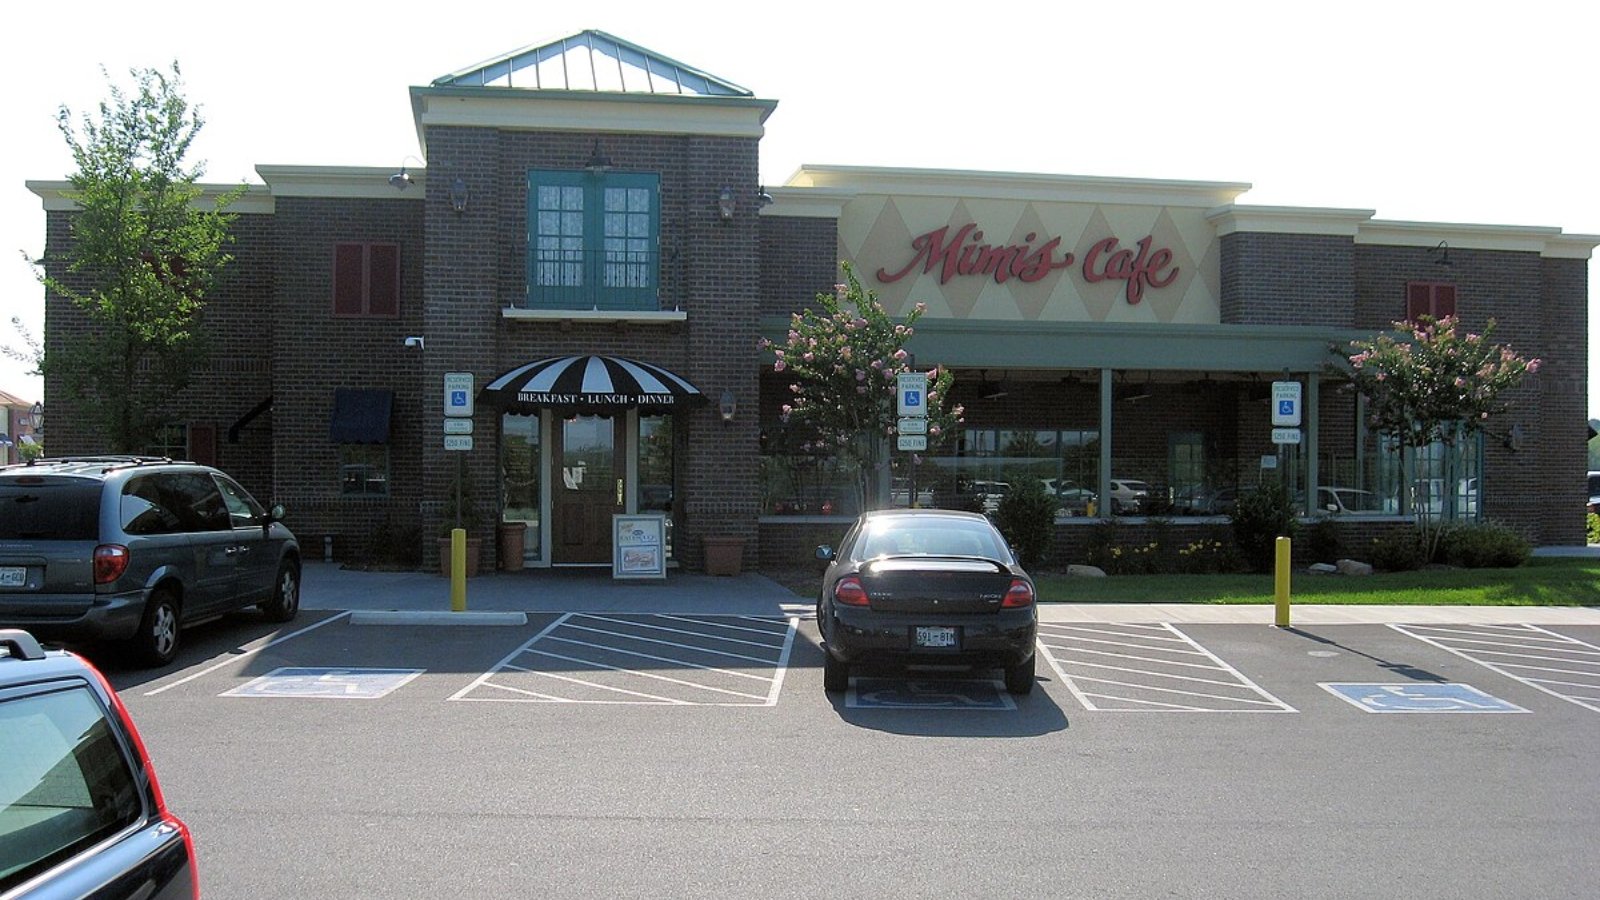
Eagleville – Small Town, Big Appreciation
Tucked in the southwest corner of Rutherford County, Eagleville has turned heads with its fast-rising home values. What was once an overlooked small town has become a draw for those seeking rural charm within reach of Murfreesboro and Franklin.
With new housing developments and strong school ratings, the town has retained buyer interest even as market conditions cool. Low inventory and growing interest in smaller communities continue to put upward pressure on prices.
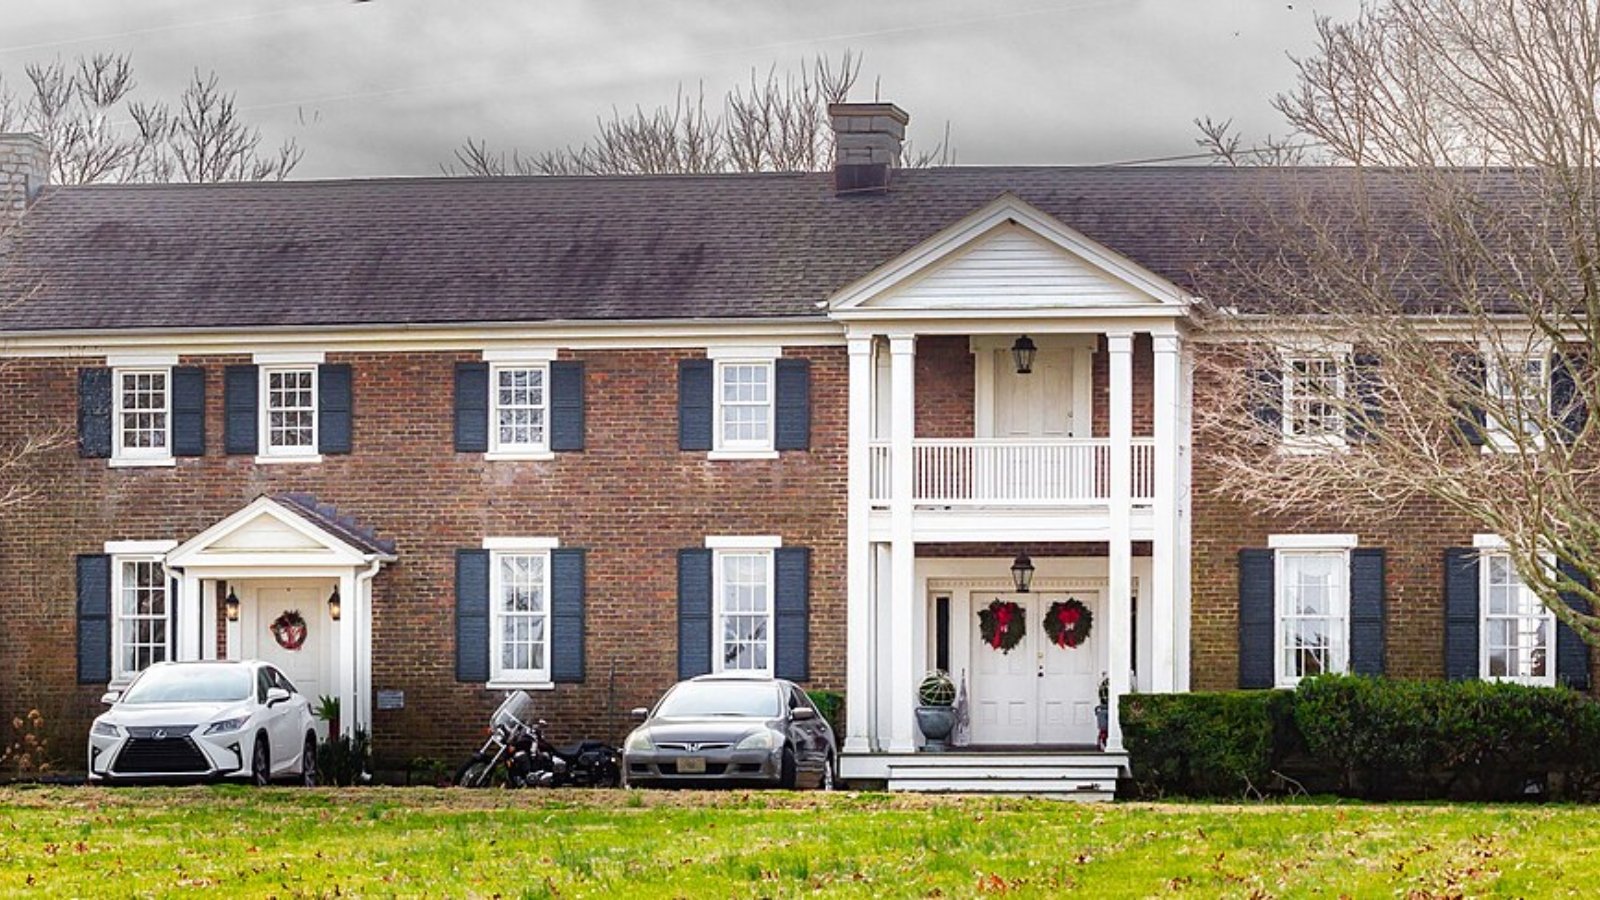
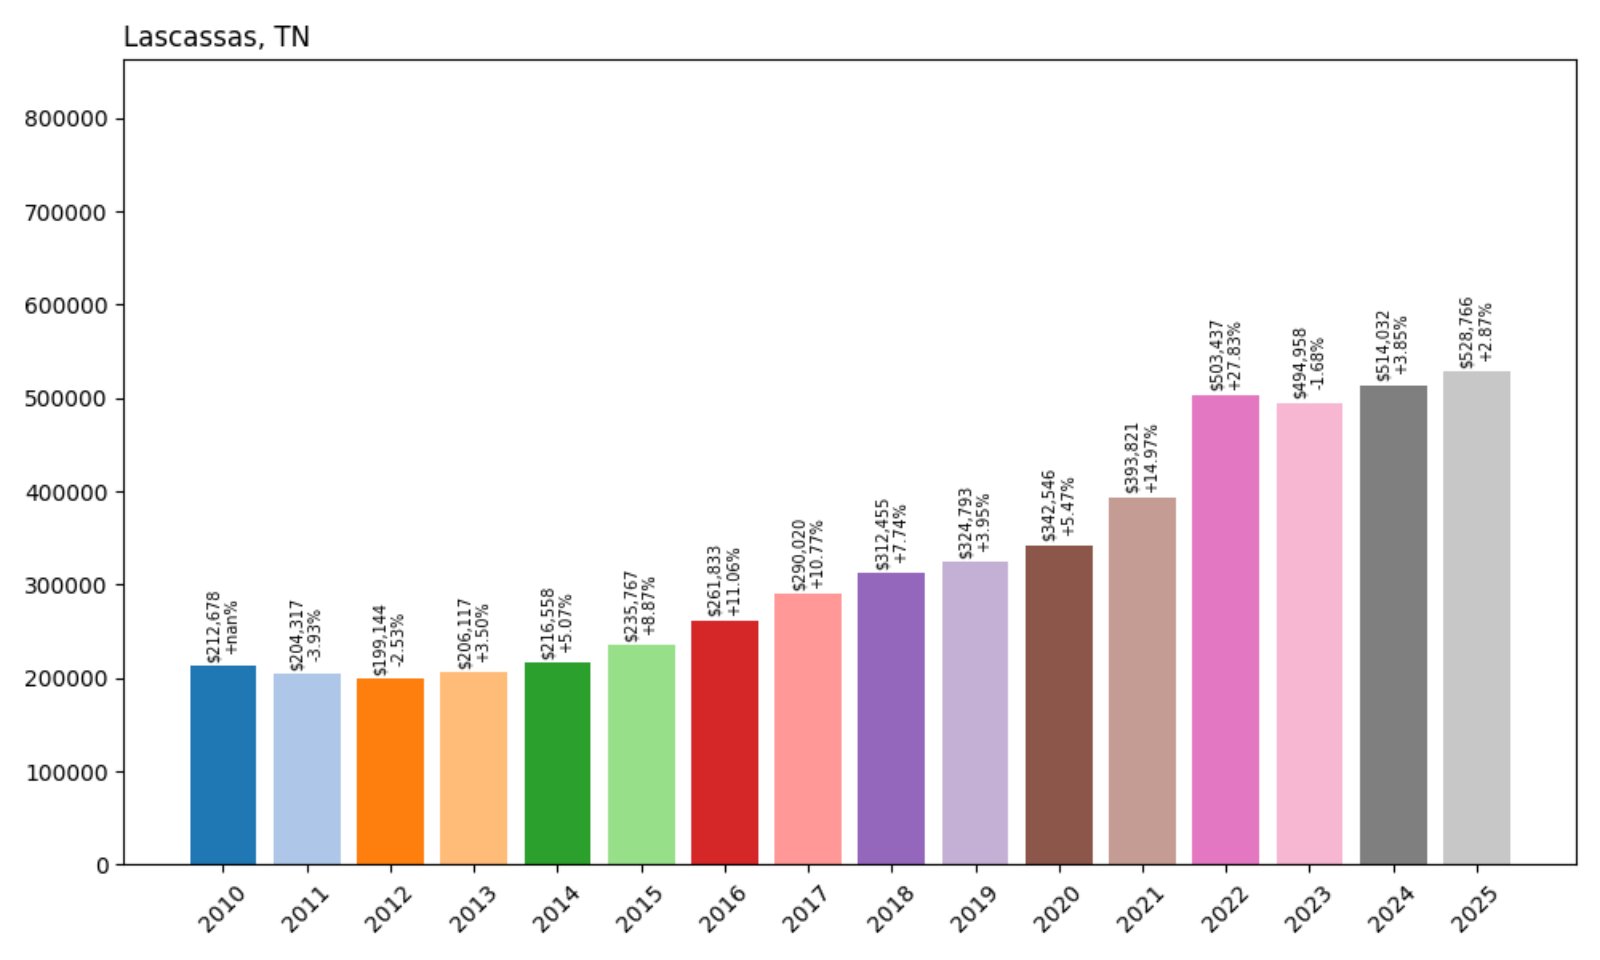
21. Lascassas – 149% Home Price Increase Since 2010
🔥 Would you like to save this?
- 2010: $212,678
- 2011: $204,317 (−$8,361, −3.93% from previous year)
- 2012: $199,144 (−$5,173, −2.53% from previous year)
- 2013: $206,117 (+$6,973, +3.50% from previous year)
- 2014: $216,558 (+$10,440, +5.07% from previous year)
- 2015: $235,767 (+$19,209, +8.87% from previous year)
- 2016: $261,833 (+$26,066, +11.06% from previous year)
- 2017: $290,020 (+$28,187, +10.77% from previous year)
- 2018: $312,455 (+$22,435, +7.74% from previous year)
- 2019: $324,793 (+$12,338, +3.95% from previous year)
- 2020: $342,546 (+$17,753, +5.47% from previous year)
- 2021: $393,821 (+$51,275, +14.97% from previous year)
- 2022: $503,437 (+$109,617, +27.83% from previous year)
- 2023: $494,958 (−$8,480, −1.68% from previous year)
- 2024: $514,032 (+$19,074, +3.85% from previous year)
- 2025: $528,766 (+$14,734, +2.87% from previous year)
Lascassas home prices surged from $213K in 2010 to nearly $529K in 2025. Growth was steady throughout the 2010s, with an explosive increase in 2022. Prices dipped slightly after but have since resumed a modest upward trend.
Lascassas – Rural Growth Driven by Proximity to Murfreesboro
Located just northeast of Murfreesboro, Lascassas blends countryside living with convenient metro access. Long appreciated for its quiet atmosphere, the area saw renewed attention from families and professionals after 2020.
The massive jump in 2022 likely reflects this shift in buyer demand. Though the growth rate has tapered, Lascassas remains a desirable place to settle in Rutherford County, especially for those looking for land and newer builds.
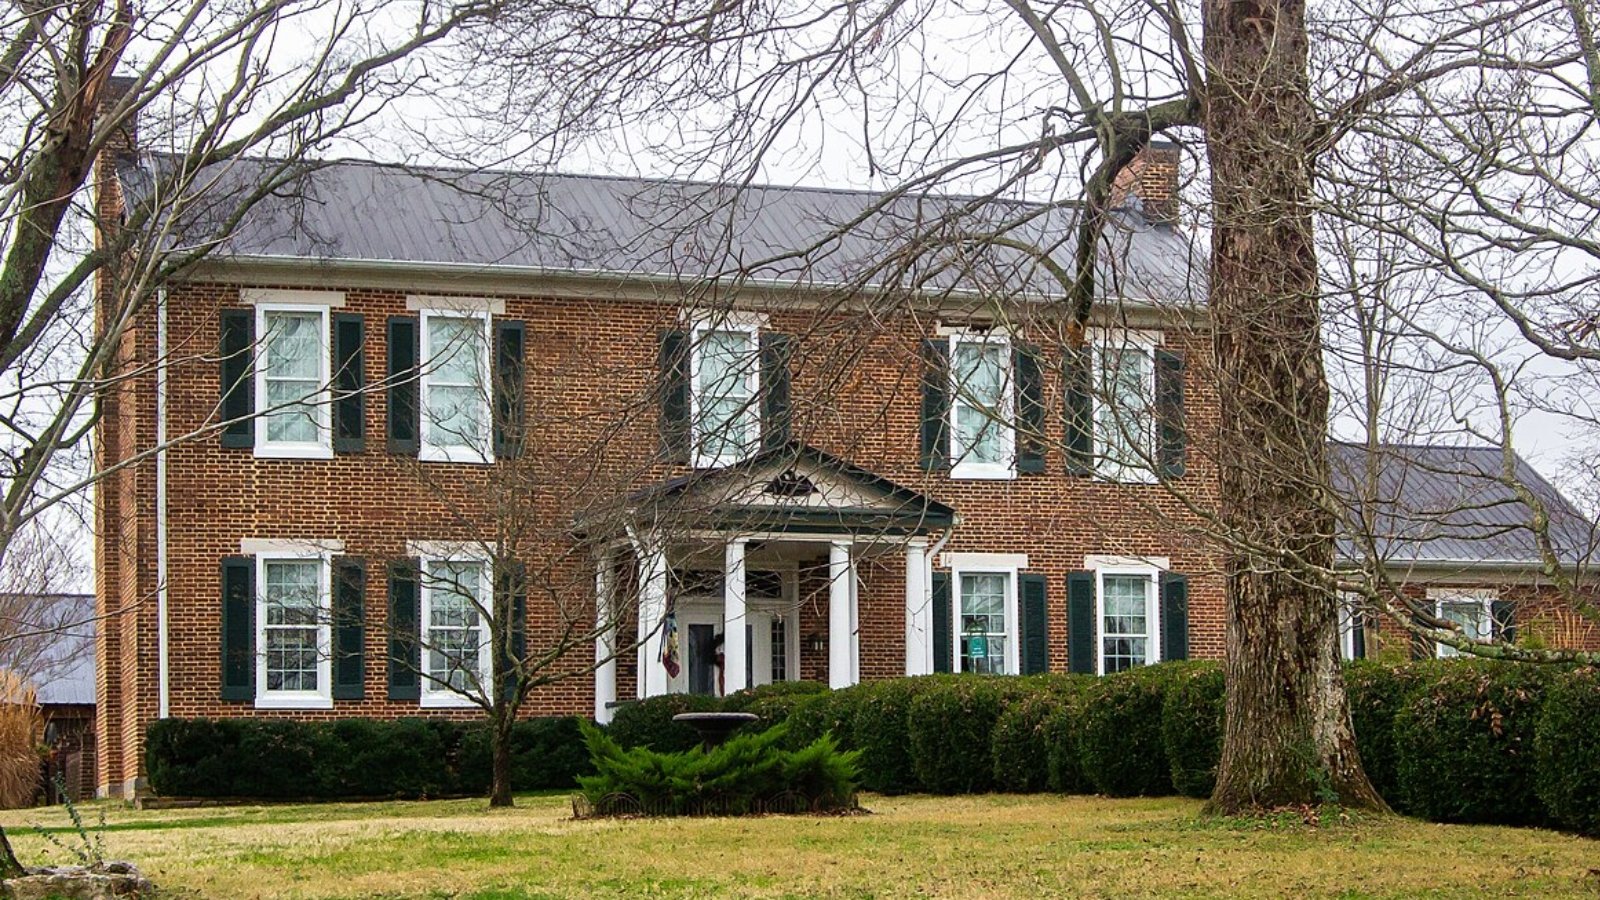
20. Spring Hill – 157% Home Price Increase Since 2010
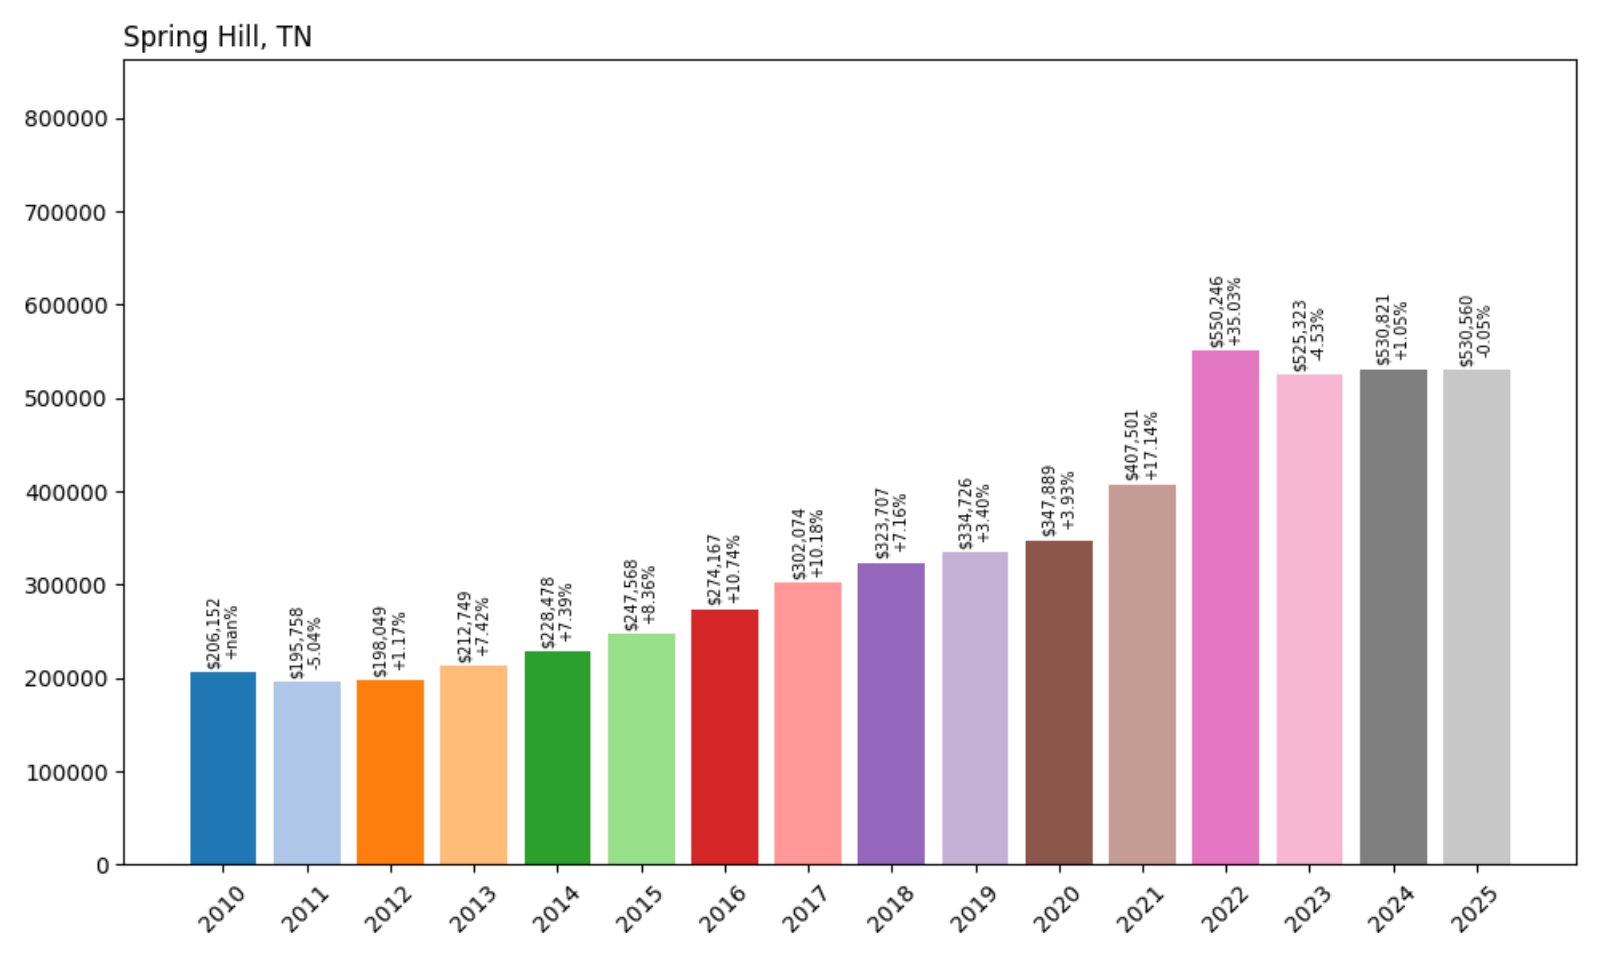
- 2010: $206,152
- 2011: $195,758 (−$10,394, −5.04% from previous year)
- 2012: $198,049 (+$2,291, +1.17% from previous year)
- 2013: $212,749 (+$14,700, +7.42% from previous year)
- 2014: $228,478 (+$15,728, +7.39% from previous year)
- 2015: $247,568 (+$19,090, +8.36% from previous year)
- 2016: $274,167 (+$26,599, +10.74% from previous year)
- 2017: $302,074 (+$27,907, +10.18% from previous year)
- 2018: $323,707 (+$21,632, +7.16% from previous year)
- 2019: $334,726 (+$11,019, +3.40% from previous year)
- 2020: $347,889 (+$13,163, +3.93% from previous year)
- 2021: $407,501 (+$59,612, +17.14% from previous year)
- 2022: $550,246 (+$142,745, +35.03% from previous year)
- 2023: $525,323 (−$24,922, −4.53% from previous year)
- 2024: $530,821 (+$5,497, +1.05% from previous year)
- 2025: $530,560 (−$261, −0.05% from previous year)
Spring Hill’s home values more than doubled over the past 15 years, starting at just over $206K in 2010 and reaching $530K in 2025. Much of that increase came during the rapid rise of 2021–2022, though prices have flattened more recently.
Spring Hill – Explosive Growth With Nashville Spillover
Straddling both Williamson and Maury counties, Spring Hill has seen enormous residential and commercial expansion. As Nashville grew more expensive, Spring Hill became a hotspot for buyers looking for newer homes, good schools, and commuting options via I-65.
Home prices peaked in 2022, followed by a brief dip and then a leveling off through 2025. Though price gains have cooled, the city remains one of the state’s fastest-growing and continues to attract builders, families, and professionals.
19. Fairview – 192% Home Price Increase Since 2010
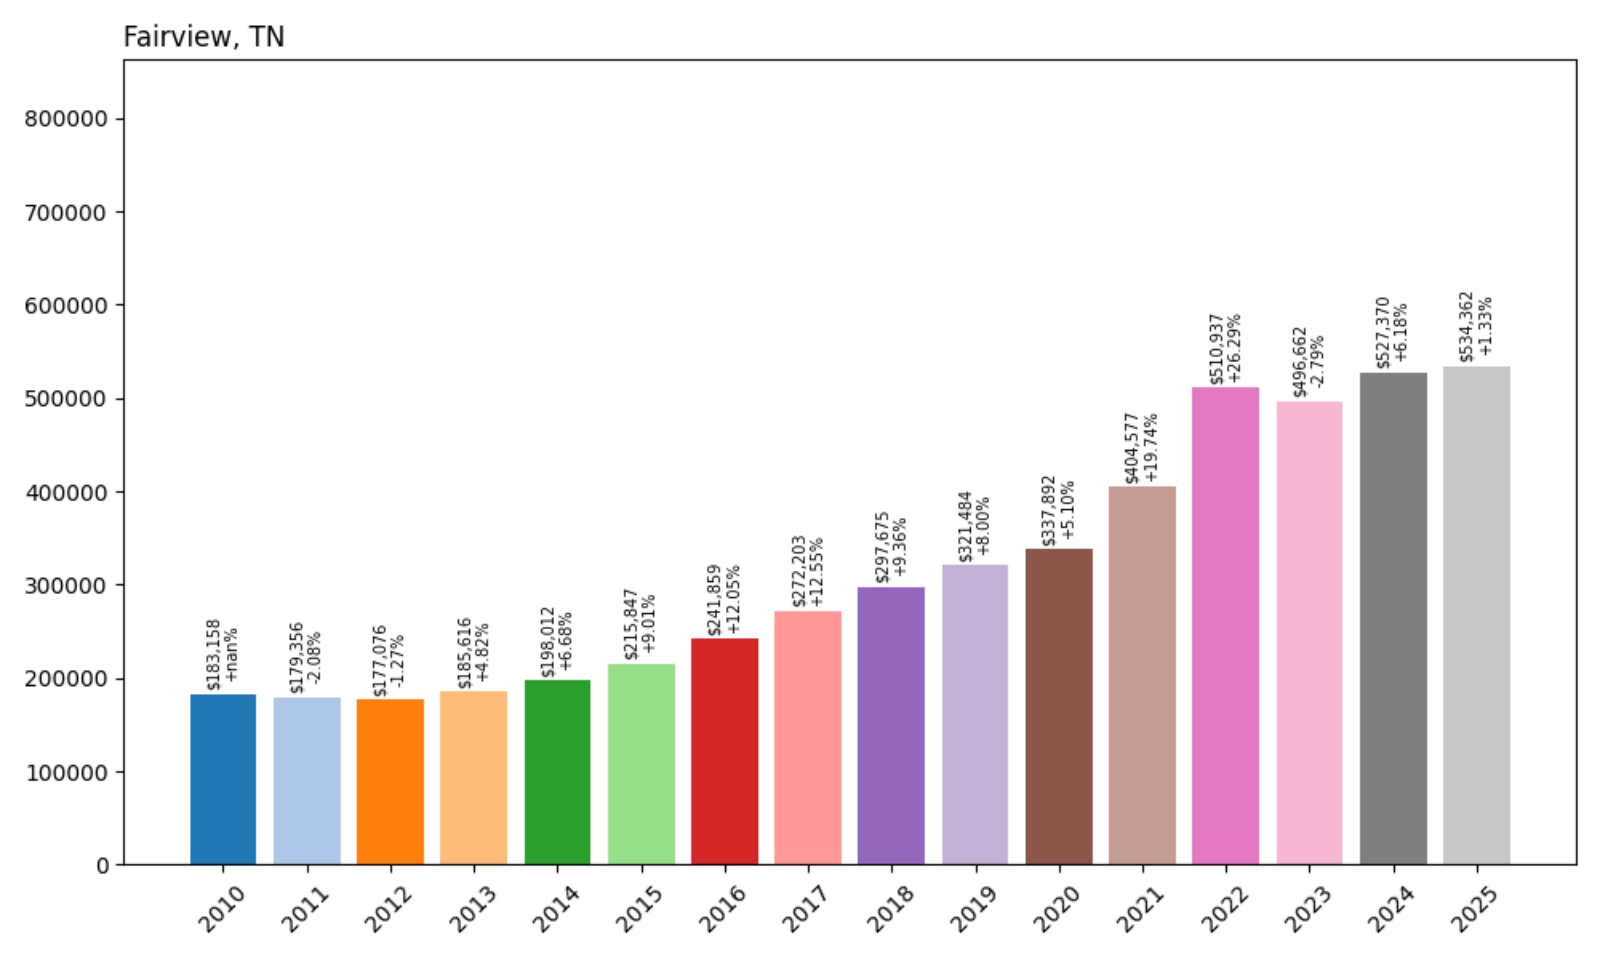
- 2010: $183,158
- 2011: $179,356 (−$3,802, −2.08% from previous year)
- 2012: $177,076 (−$2,280, −1.27% from previous year)
- 2013: $185,616 (+$8,539, +4.82% from previous year)
- 2014: $198,012 (+$12,396, +6.68% from previous year)
- 2015: $215,847 (+$17,835, +9.01% from previous year)
- 2016: $241,859 (+$26,013, +12.05% from previous year)
- 2017: $272,203 (+$30,344, +12.55% from previous year)
- 2018: $297,675 (+$25,471, +9.36% from previous year)
- 2019: $321,484 (+$23,809, +8.00% from previous year)
- 2020: $337,892 (+$16,408, +5.10% from previous year)
- 2021: $404,577 (+$66,685, +19.74% from previous year)
- 2022: $510,937 (+$106,360, +26.29% from previous year)
- 2023: $496,662 (−$14,274, −2.79% from previous year)
- 2024: $527,370 (+$30,708, +6.18% from previous year)
- 2025: $534,362 (+$6,992, +1.33% from previous year)
Fairview home values have jumped from $183K in 2010 to over $534K in 2025. Most of the growth occurred between 2015 and 2022. After a dip in 2023, prices resumed a modest upward trend.
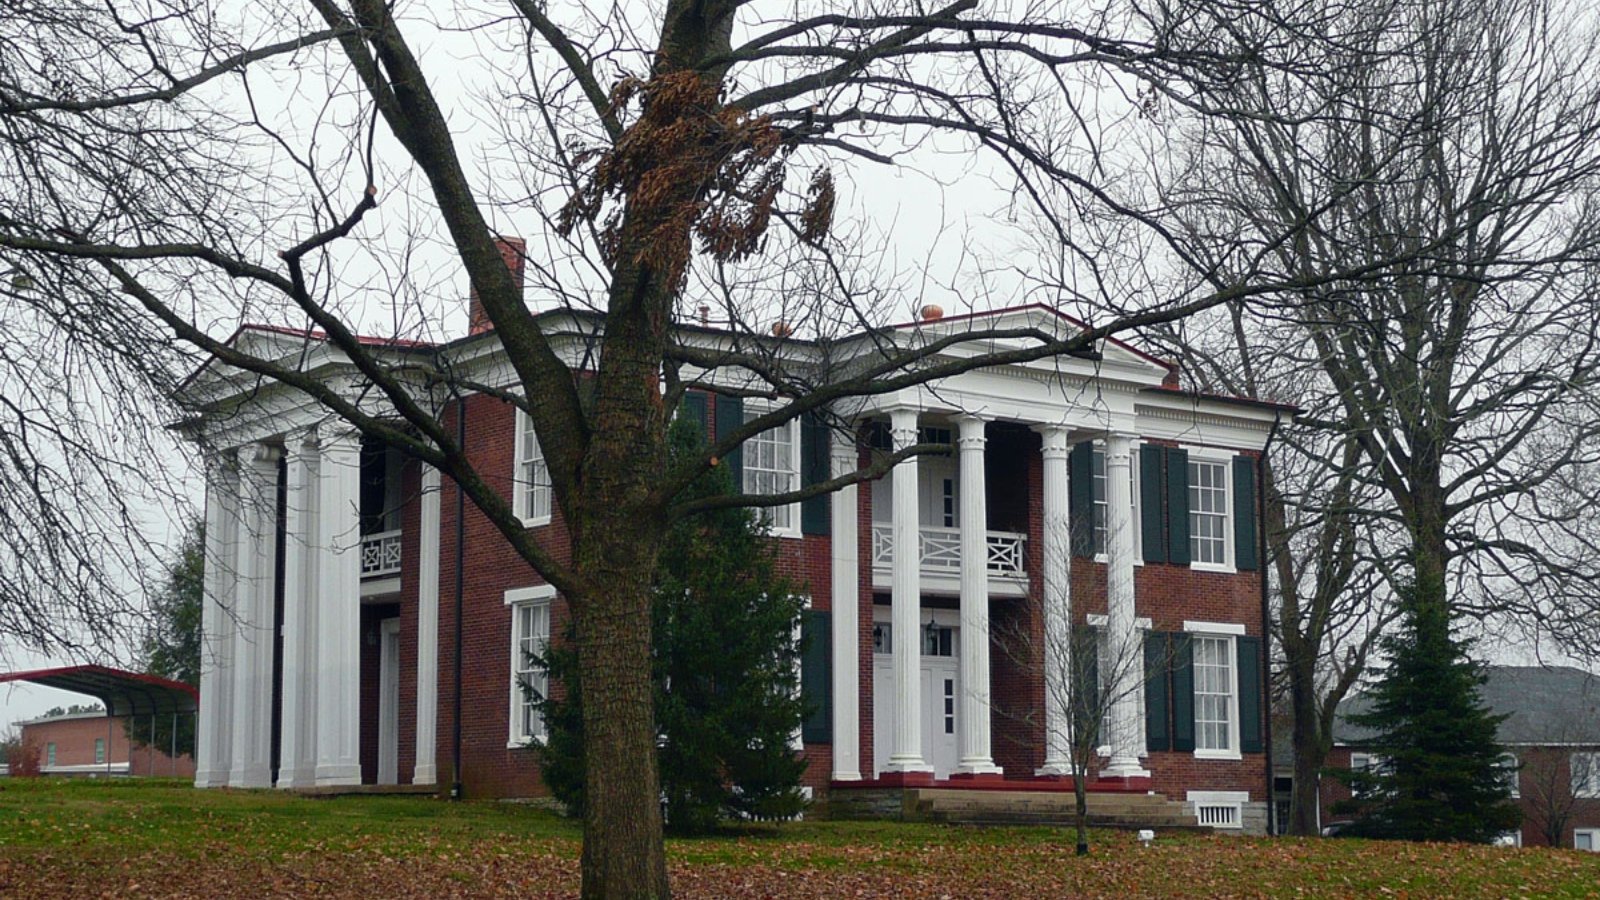
Fairview – Rapid Rise Near the Western Edge of Nashville
Fairview’s proximity to Franklin and west Nashville has transformed it from a quiet outpost into a rapidly developing suburban option. With access to Bowie Nature Park and competitive schools, it has become increasingly appealing to families and retirees alike.
Prices have surged since the mid-2010s, and while growth has slowed, the area remains one of Williamson County’s more accessible markets. Its mix of affordability and proximity keeps it a strong option for new buyers.
18. Rossville – 99% Home Price Increase Since 2010
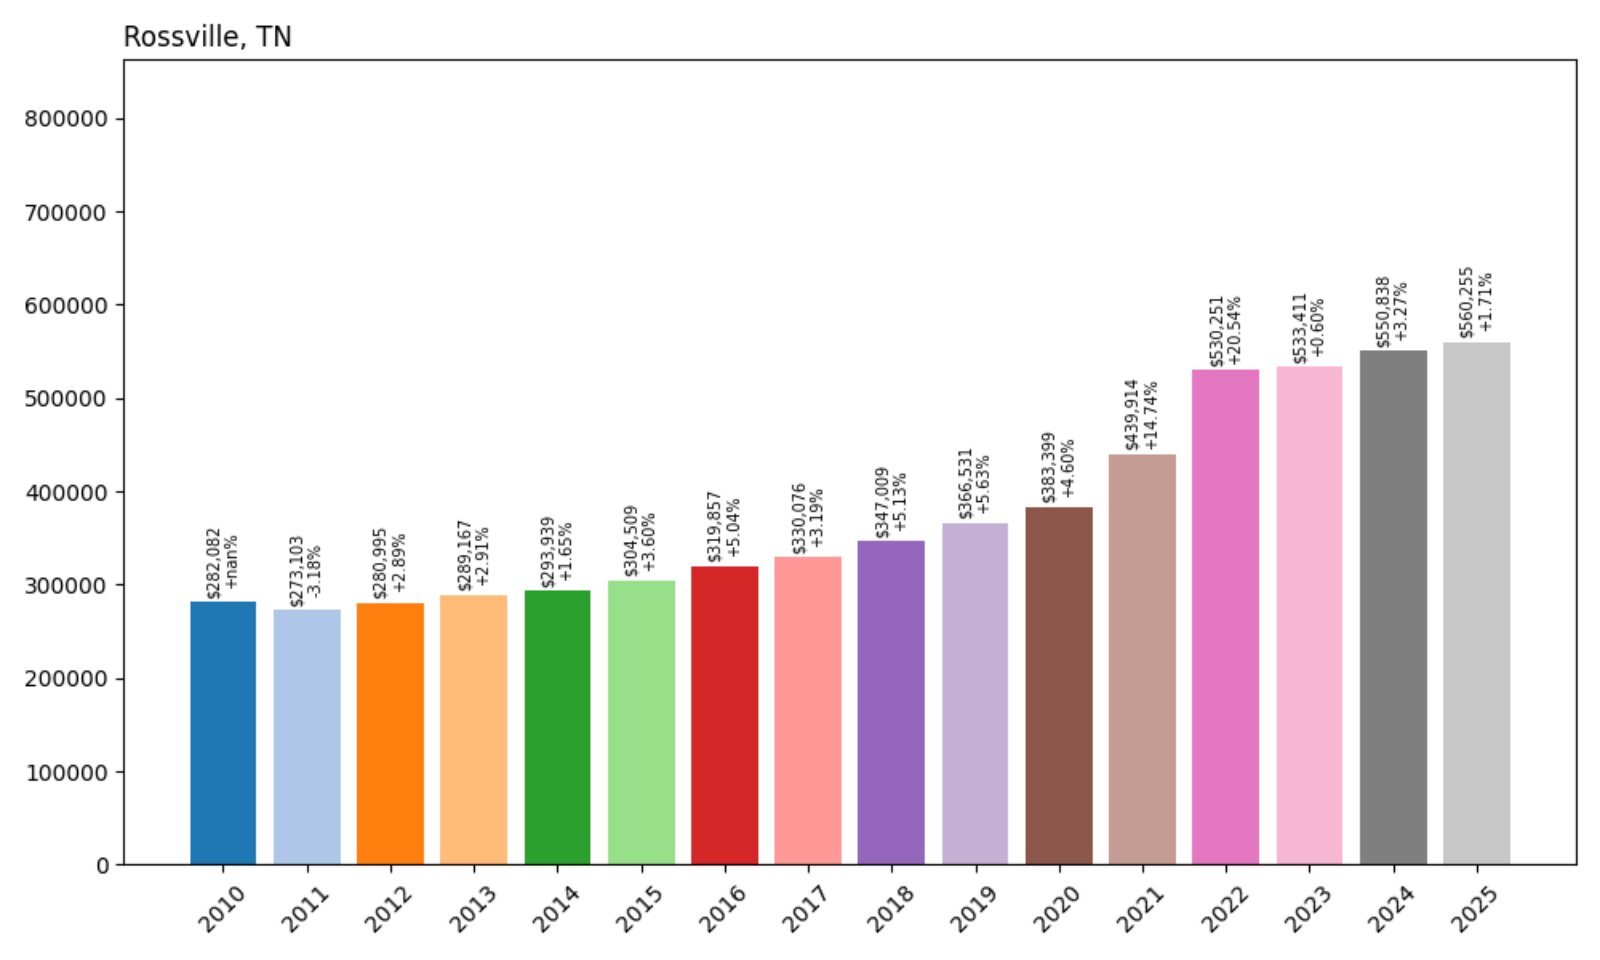
- 2010: $282,082
- 2011: $273,103 (−$8,979, −3.18% from previous year)
- 2012: $280,995 (+$7,891, +2.89% from previous year)
- 2013: $289,167 (+$8,172, +2.91% from previous year)
- 2014: $293,939 (+$4,772, +1.65% from previous year)
- 2015: $304,509 (+$10,570, +3.60% from previous year)
- 2016: $319,857 (+$15,348, +5.04% from previous year)
- 2017: $330,076 (+$10,219, +3.19% from previous year)
- 2018: $347,009 (+$16,933, +5.13% from previous year)
- 2019: $366,531 (+$19,522, +5.63% from previous year)
- 2020: $383,399 (+$16,867, +4.60% from previous year)
- 2021: $439,914 (+$56,516, +14.74% from previous year)
- 2022: $530,251 (+$90,337, +20.54% from previous year)
- 2023: $533,411 (+$3,160, +0.60% from previous year)
- 2024: $550,838 (+$17,427, +3.27% from previous year)
- 2025: $560,255 (+$9,417, +1.71% from previous year)
Rossville’s prices have nearly doubled since 2010, with steady growth every year and strong spikes between 2020 and 2022. The market remains stable, with moderate gains in the past two years.
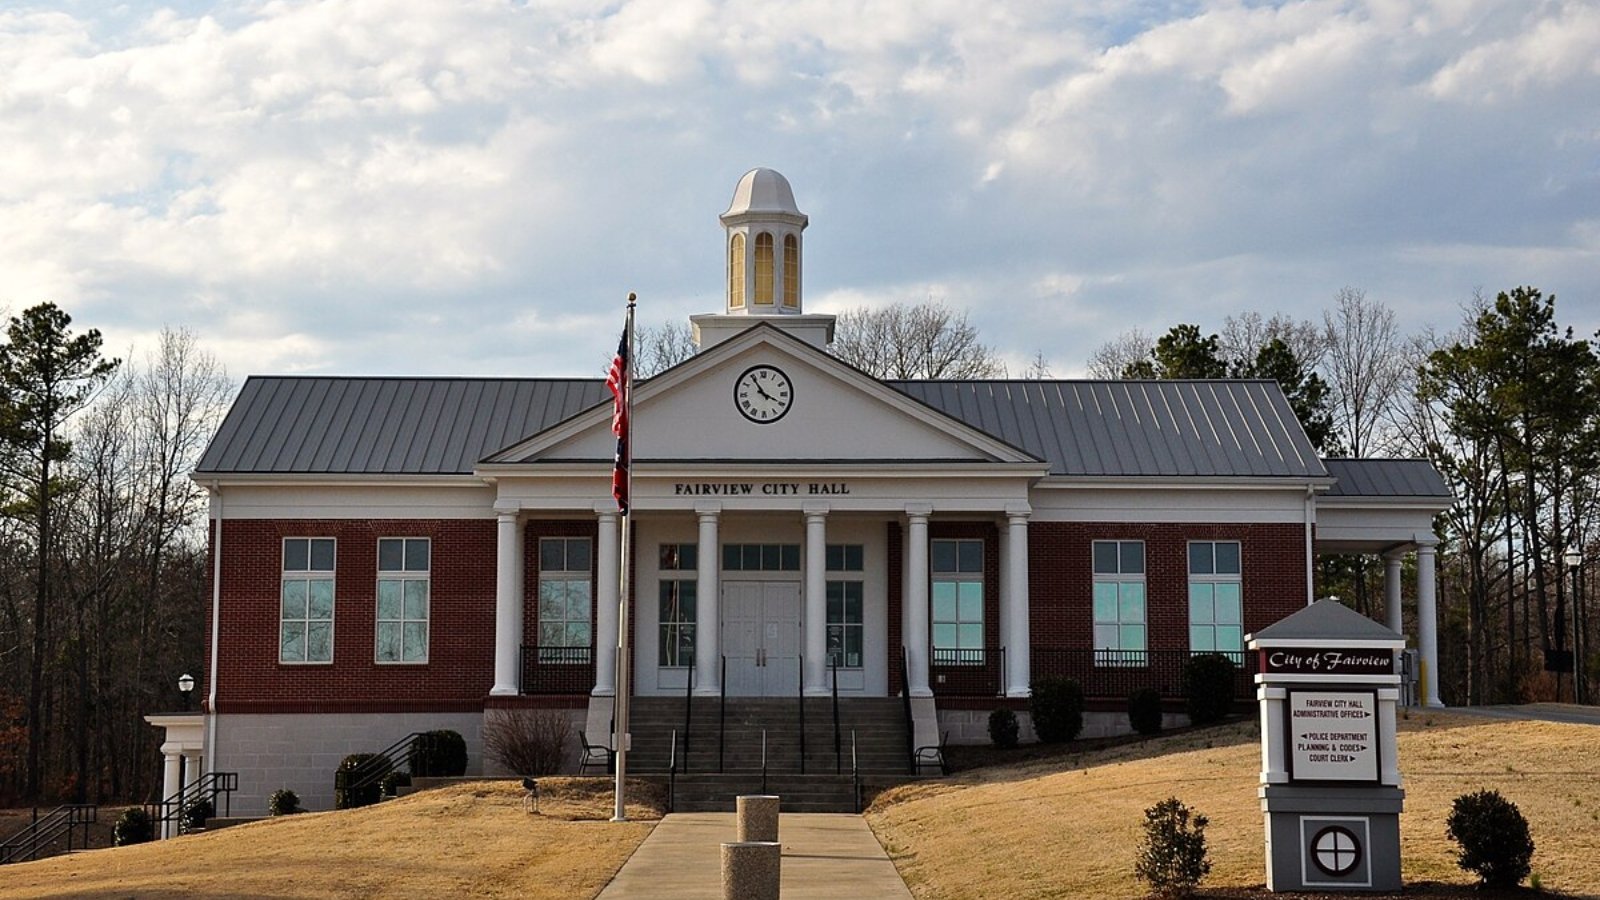
Rossville – Growth Fueled by Memphis Metro Expansion
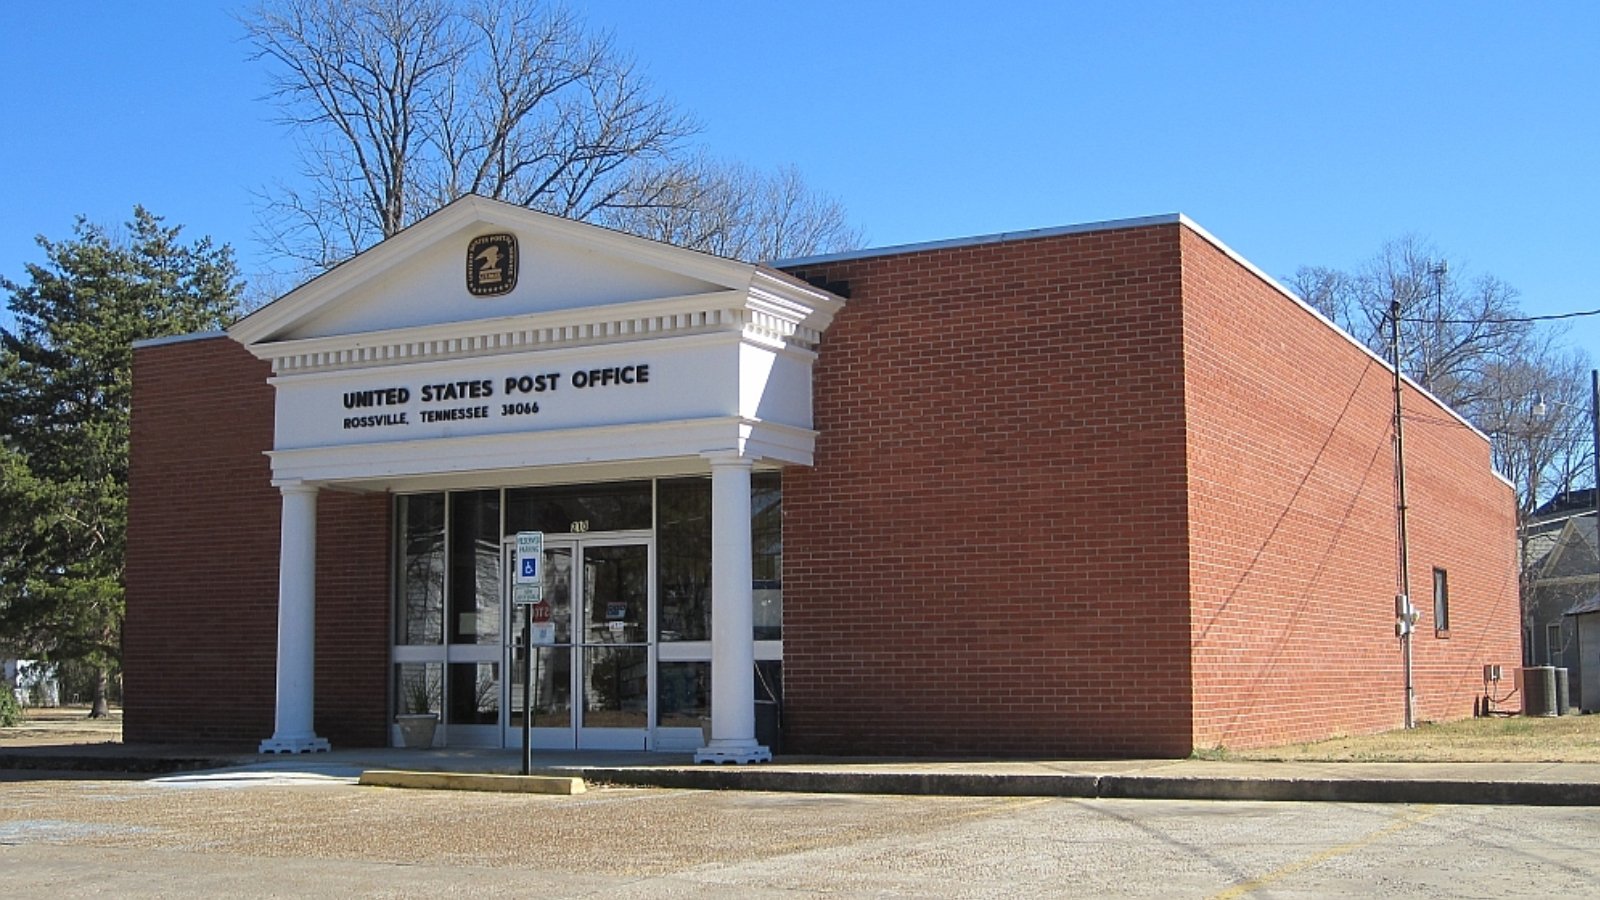
Rossville, in Fayette County just outside the Memphis suburbs, has attracted homebuyers seeking larger lots and newer construction without straying too far from city amenities. This demand has kept prices rising steadily for over a decade.
Home values climbed sharply in 2021 and 2022 and have remained high, showing that Rossville is transitioning from rural to suburban. Infrastructure improvements and residential developments have made it one of West Tennessee’s fastest-rising housing markets.
17. Ridgeside – 4% Home Price Increase Since 2024
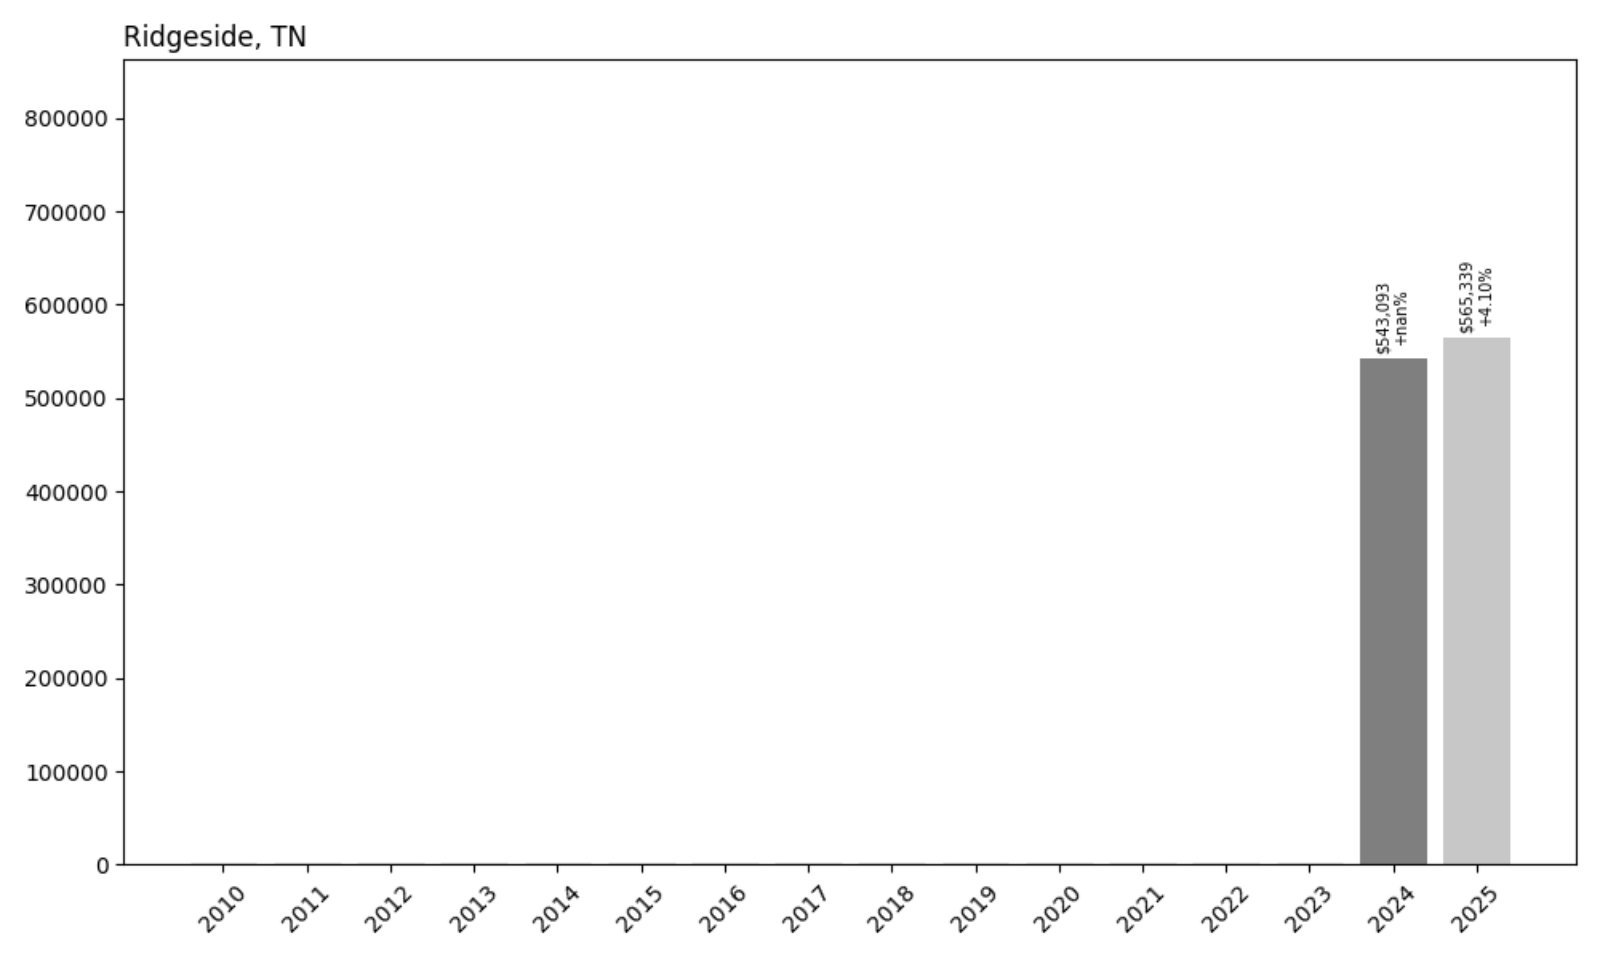
- 2024: $543,093
- 2025: $565,339 (+$22,246, +4.10% from previous year)
With available data only from 2024, Ridgeside shows a 4% increase year-over-year to reach $565K. Its limited size and availability likely keep prices high, with small annual fluctuations due to market dynamics.
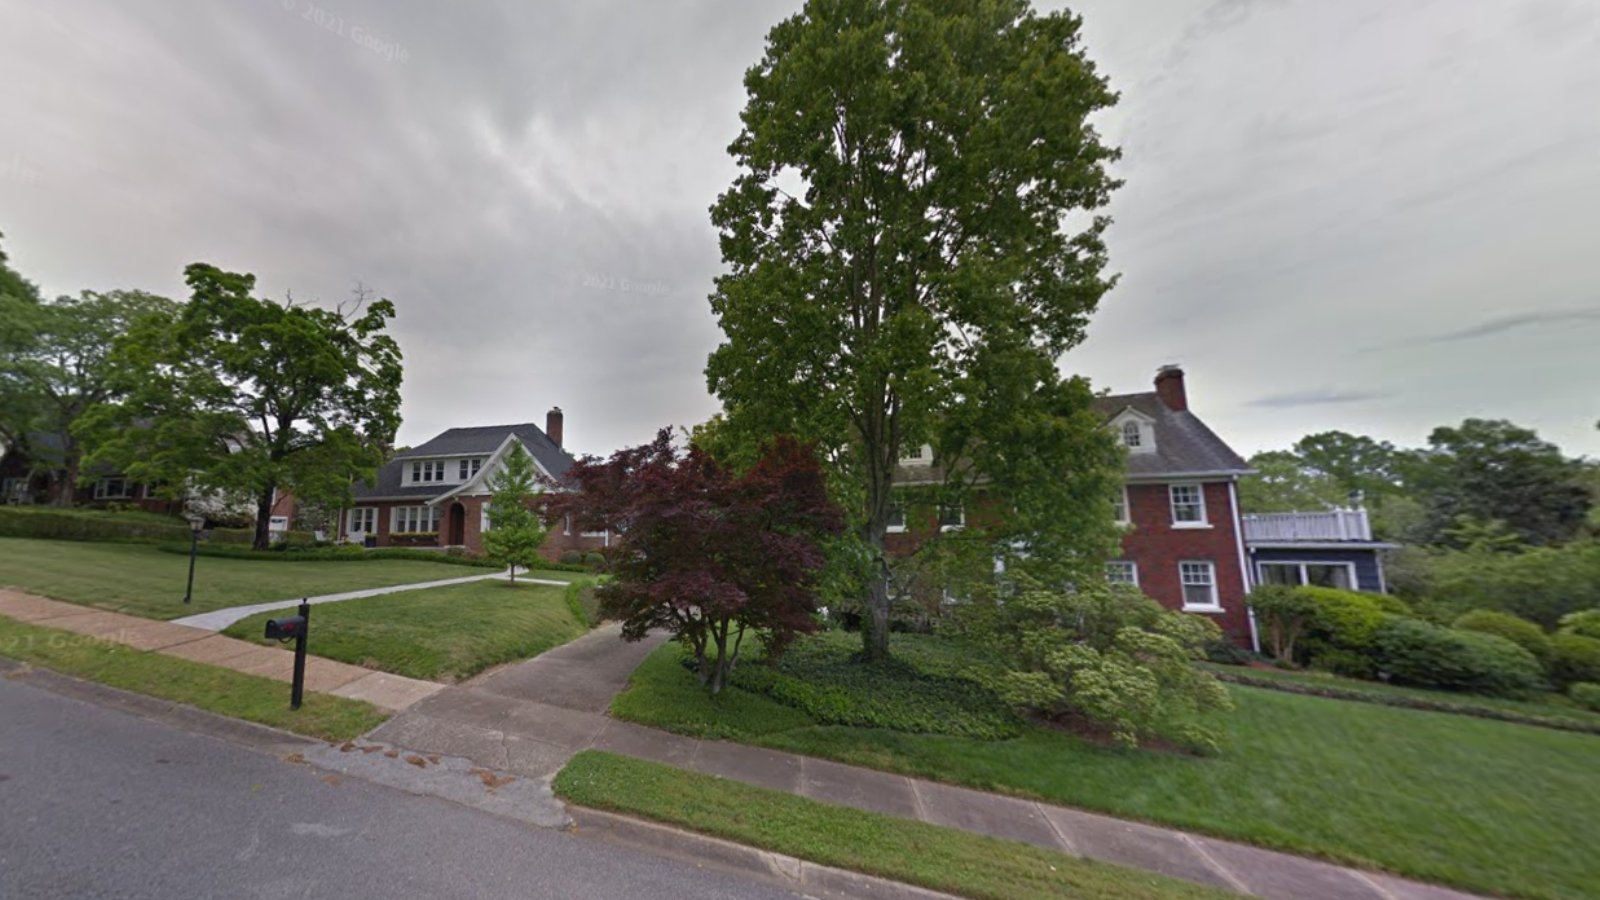
Ridgeside – Tiny but Tightly Held Near Chattanooga
🔥 Would you like to save this?
Ridgeside is one of the smallest incorporated towns in Tennessee, nestled within Chattanooga’s metro area. With its close-knit layout, limited turnover, and hillside charm, prices tend to stay elevated due to supply constraints.
The town’s exclusivity means that even small changes in demand can shift prices. The data shows modest appreciation from 2024 to 2025, reflecting stability in this low-inventory market just minutes from downtown Chattanooga.
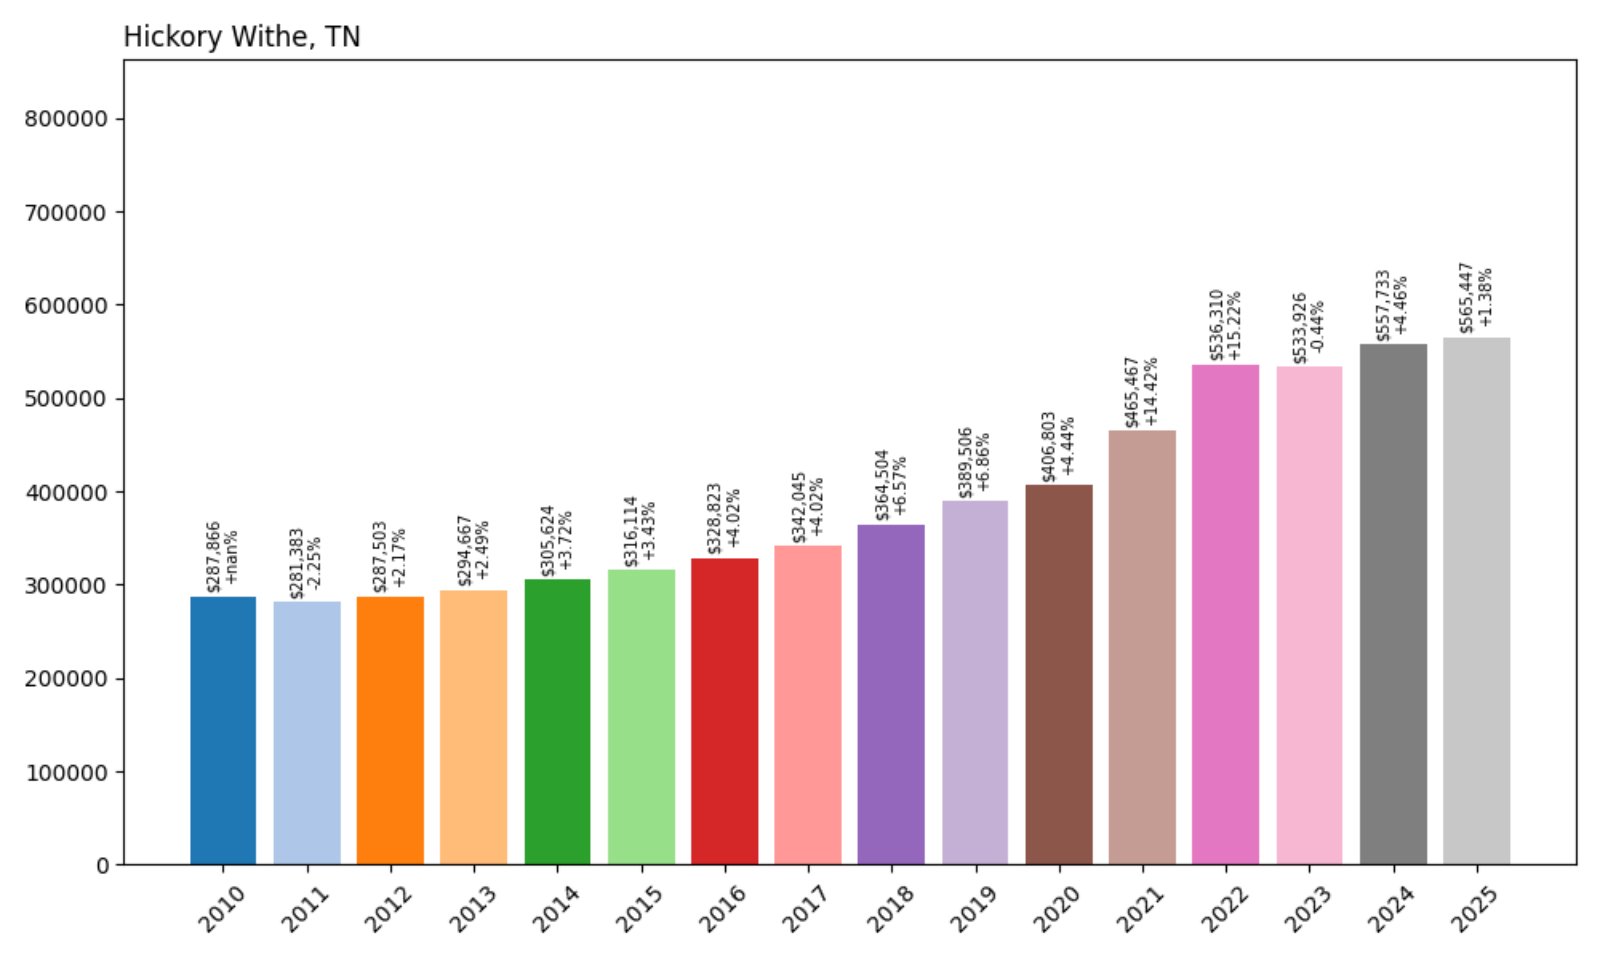
16. Hickory Withe – 96% Home Price Increase Since 2010
- 2010: $287,866
- 2011: $281,383 (−$6,483, −2.25% from previous year)
- 2012: $287,503 (+$6,120, +2.17% from previous year)
- 2013: $294,667 (+$7,163, +2.49% from previous year)
- 2014: $305,624 (+$10,958, +3.72% from previous year)
- 2015: $316,114 (+$10,489, +3.43% from previous year)
- 2016: $328,823 (+$12,709, +4.02% from previous year)
- 2017: $342,045 (+$13,222, +4.02% from previous year)
- 2018: $364,504 (+$22,459, +6.57% from previous year)
- 2019: $389,506 (+$25,002, +6.86% from previous year)
- 2020: $406,803 (+$17,297, +4.44% from previous year)
- 2021: $465,467 (+$58,664, +14.42% from previous year)
- 2022: $536,310 (+$70,843, +15.22% from previous year)
- 2023: $533,926 (−$2,384, −0.44% from previous year)
- 2024: $557,733 (+$23,807, +4.46% from previous year)
- 2025: $565,447 (+$7,714, +1.38% from previous year)
Hickory Withe’s home values rose steadily from under $288K in 2010 to $565K in 2025. The strongest gains came in the early 2020s, with moderate appreciation continuing into the present year.
Hickory Withe – A Quiet Market With Persistent Growth
Located in Fayette County, Hickory Withe offers larger homes and rural appeal just outside of Memphis. Its rising popularity, especially post-2020, helped drive strong price gains fueled by limited development and sustained demand for space and privacy.
While 2023 saw a brief dip, the rebound over the following two years points to a healthy market. The area remains popular among families and retirees looking for upscale living away from urban congestion.
15. Mount Juliet – 144% Home Price Increase Since 2010
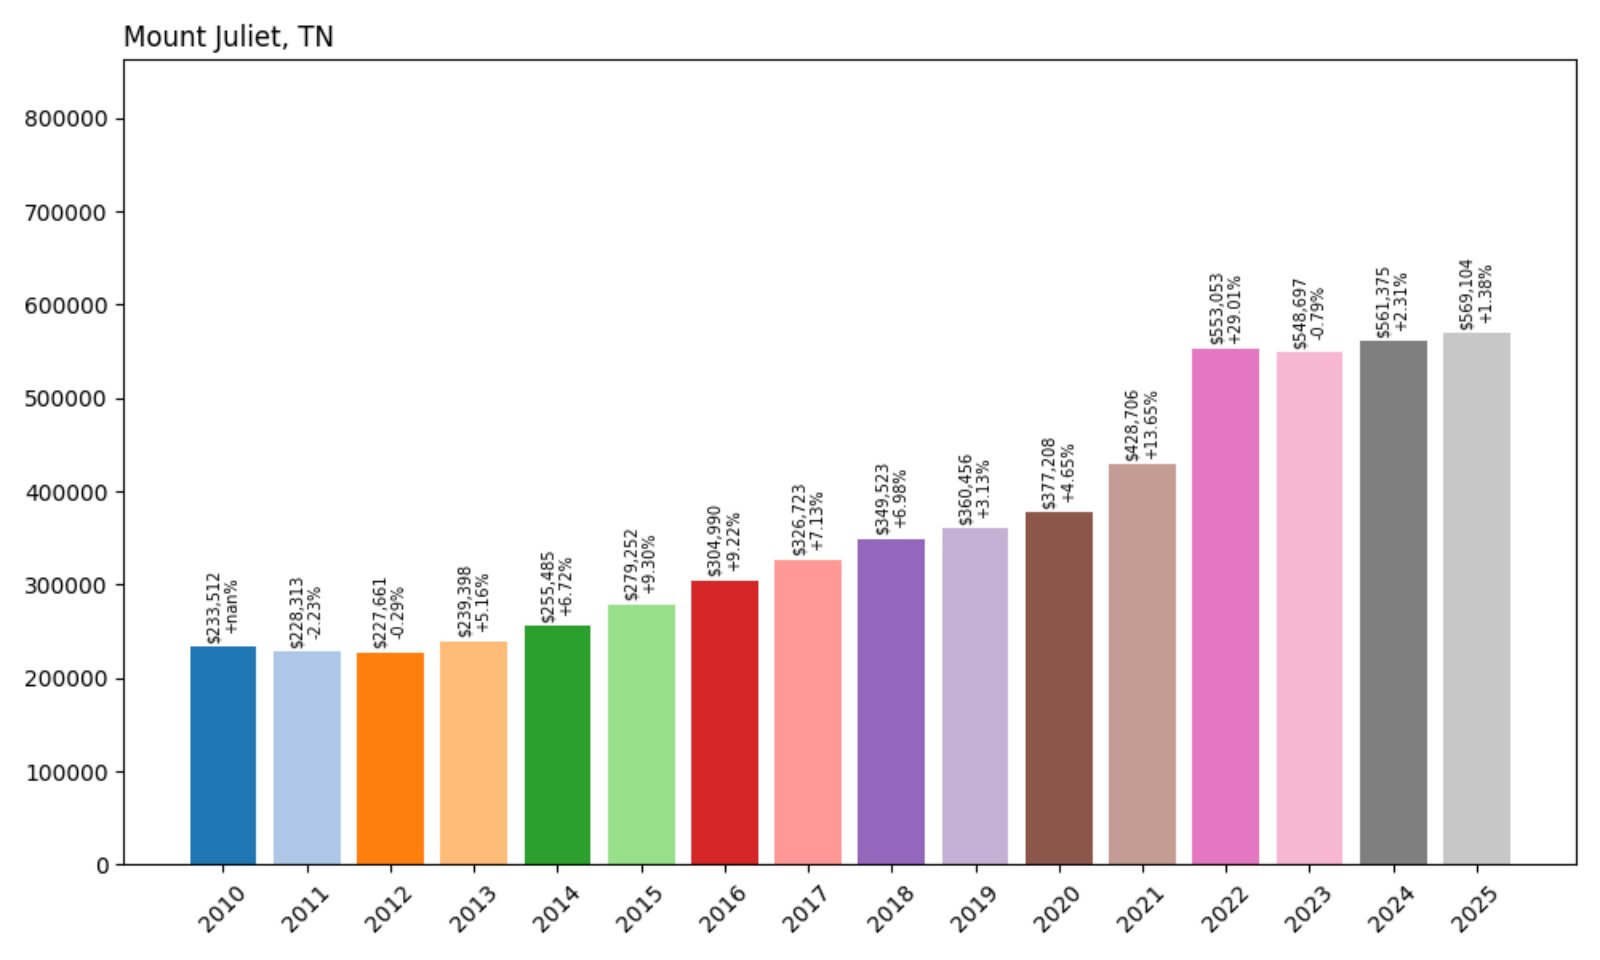
- 2010: $233,512
- 2011: $228,313 (−$5,199, −2.23% from previous year)
- 2012: $227,661 (−$652, −0.29% from previous year)
- 2013: $239,398 (+$11,737, +5.16% from previous year)
- 2014: $255,485 (+$16,087, +6.72% from previous year)
- 2015: $279,252 (+$23,768, +9.30% from previous year)
- 2016: $304,990 (+$25,737, +9.22% from previous year)
- 2017: $326,723 (+$21,734, +7.13% from previous year)
- 2018: $349,523 (+$22,800, +6.98% from previous year)
- 2019: $360,456 (+$10,933, +3.13% from previous year)
- 2020: $377,208 (+$16,751, +4.65% from previous year)
- 2021: $428,706 (+$51,498, +13.65% from previous year)
- 2022: $553,053 (+$124,347, +29.01% from previous year)
- 2023: $548,697 (−$4,356, −0.79% from previous year)
- 2024: $561,375 (+$12,678, +2.31% from previous year)
- 2025: $569,104 (+$7,730, +1.38% from previous year)
Mount Juliet’s housing market has grown steadily for over a decade, increasing from $233K in 2010 to over $569K in 2025. After a massive 29% surge in 2022, prices have remained relatively stable and continue inching upward.
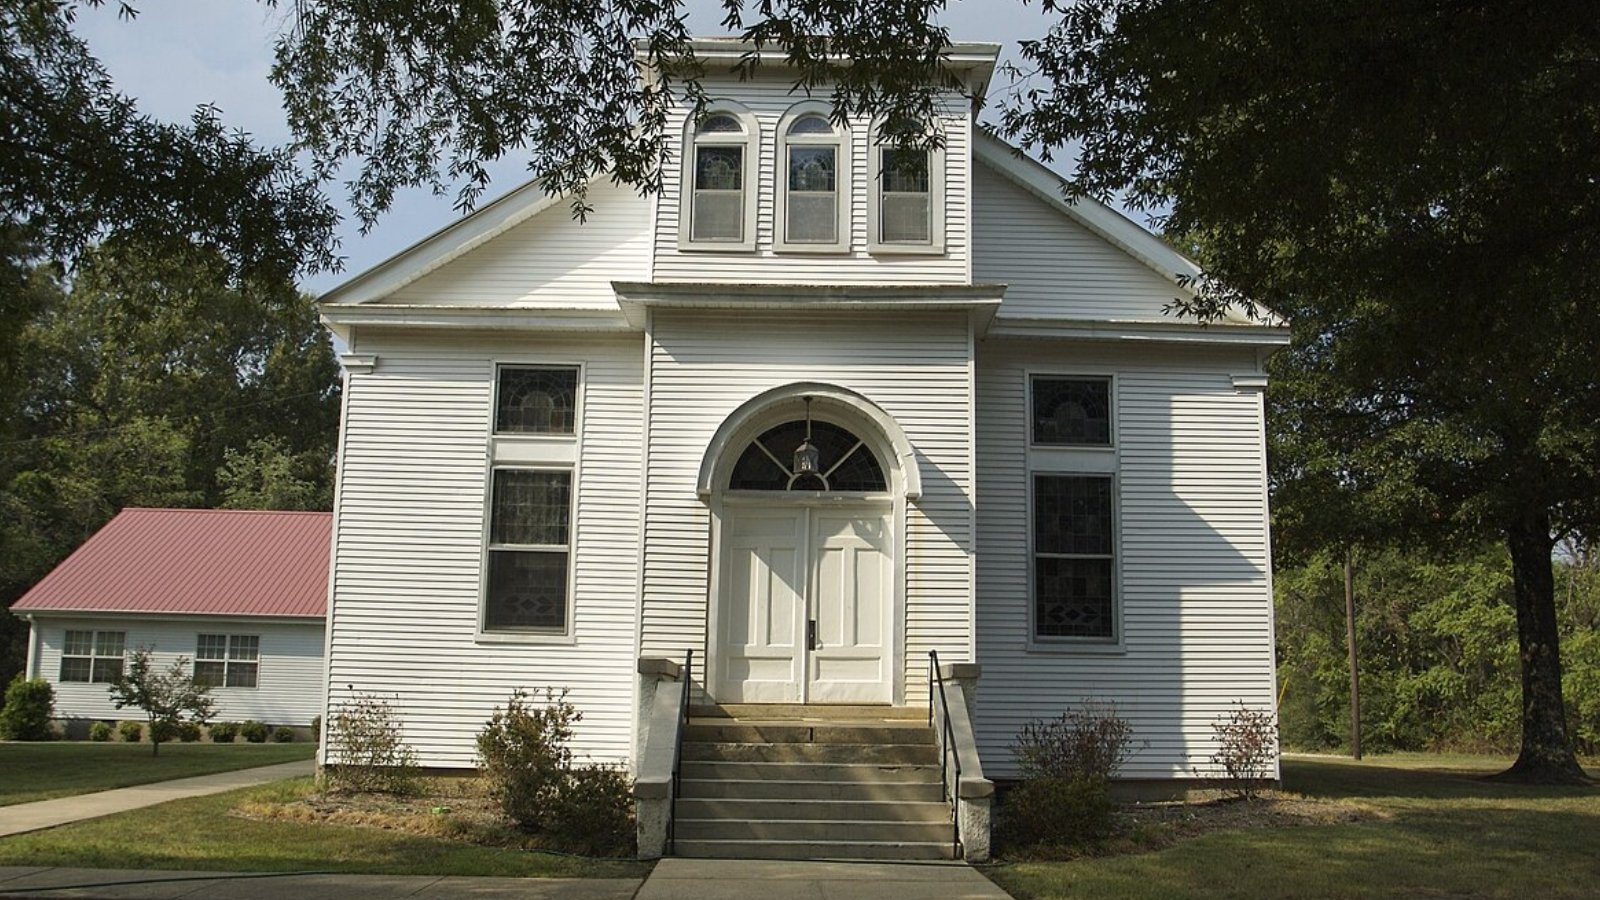
Mount Juliet – A Retail and Commuter Hub
Located just east of Nashville in Wilson County, Mount Juliet has experienced sustained growth due to its convenient location along I-40, strong school system, and rapid retail expansion. It’s also home to one of the region’s largest shopping destinations, Providence Marketplace.
With continued investment in infrastructure and residential development, Mount Juliet has maintained its spot among Tennessee’s most expensive towns. Though recent growth has slowed, the community remains highly sought-after among families and professionals alike.
14. Primm Springs – 237% Home Price Increase Since 2010
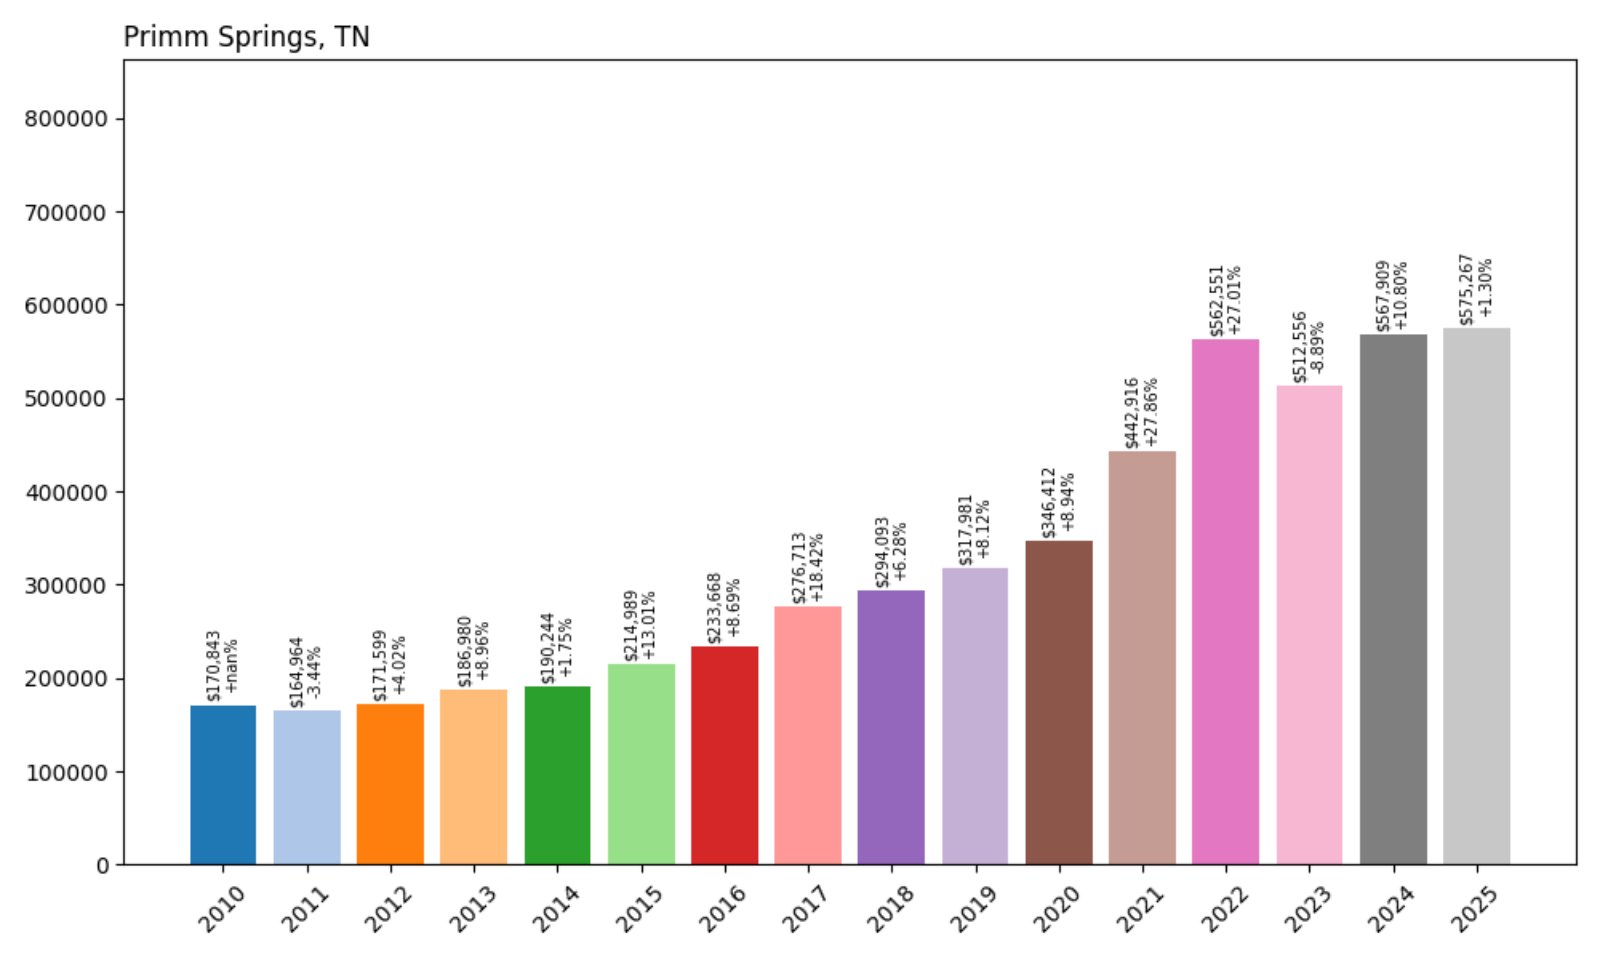
- 2010: $170,843
- 2011: $164,964 (−$5,879, −3.44% from previous year)
- 2012: $171,599 (+$6,635, +4.02% from previous year)
- 2013: $186,980 (+$15,381, +8.96% from previous year)
- 2014: $190,244 (+$3,264, +1.75% from previous year)
- 2015: $214,989 (+$24,745, +13.01% from previous year)
- 2016: $233,668 (+$18,678, +8.69% from previous year)
- 2017: $276,713 (+$43,045, +18.42% from previous year)
- 2018: $294,093 (+$17,380, +6.28% from previous year)
- 2019: $317,981 (+$23,888, +8.12% from previous year)
- 2020: $346,412 (+$28,431, +8.94% from previous year)
- 2021: $442,916 (+$96,504, +27.86% from previous year)
- 2022: $562,551 (+$119,635, +27.01% from previous year)
- 2023: $512,556 (−$49,995, −8.89% from previous year)
- 2024: $567,909 (+$55,353, +10.80% from previous year)
- 2025: $575,267 (+$7,358, +1.30% from previous year)
Home prices in Primm Springs have soared over 237% since 2010, with the biggest jumps occurring after 2020. Despite a drop in 2023, the market quickly rebounded and continues to climb in 2025.
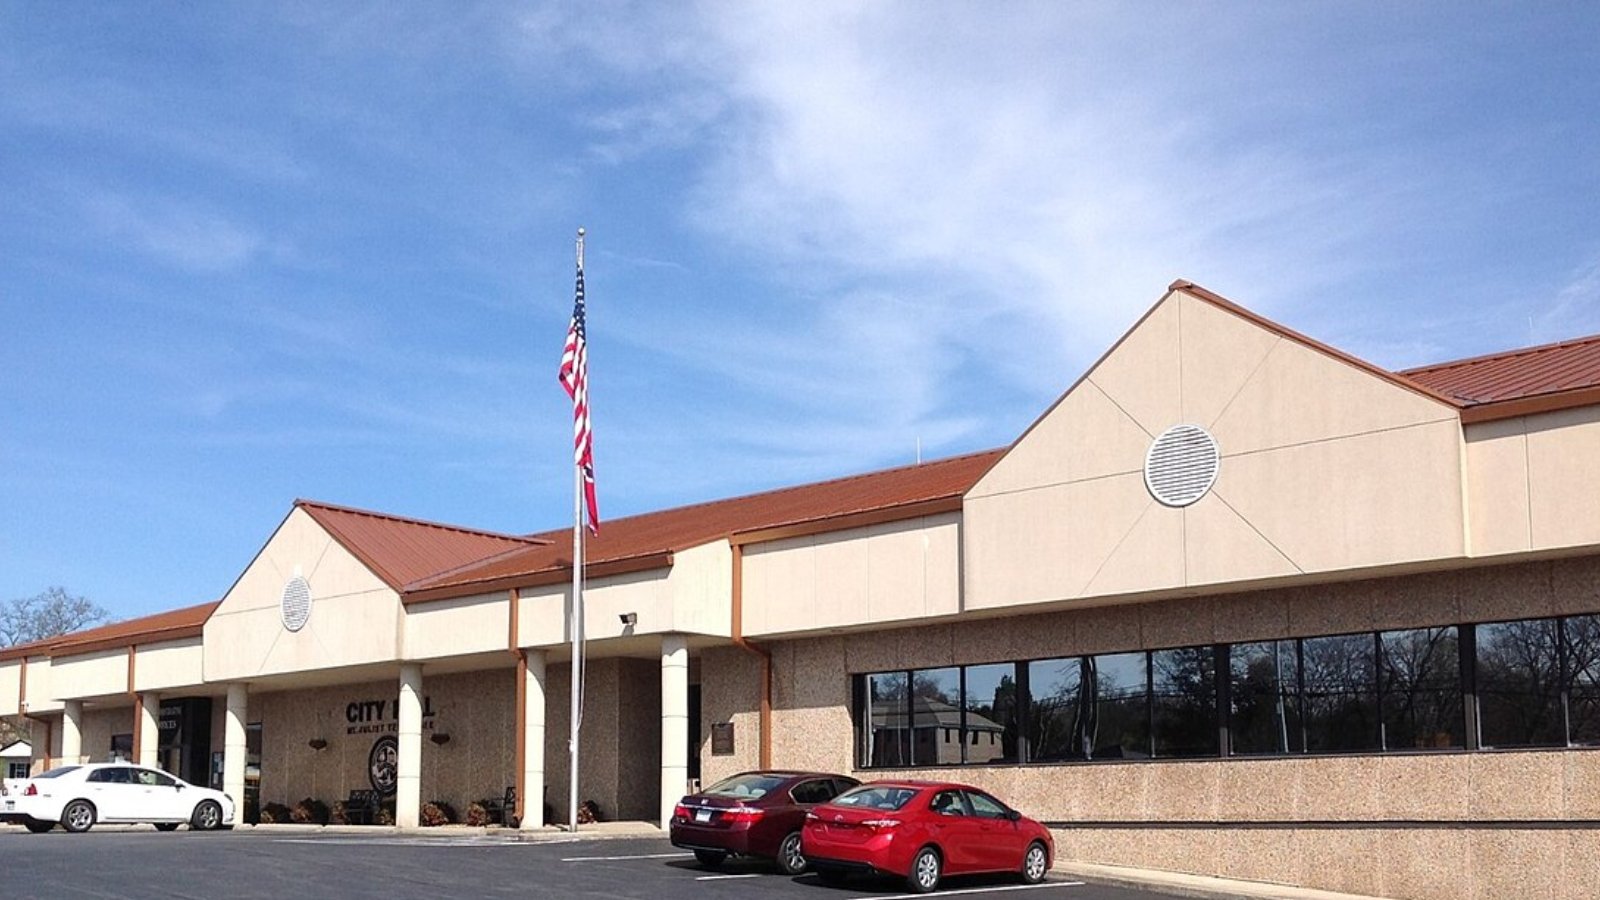
Primm Springs – High Growth in a Scenic, Rural Setting
Located in Hickman County, Primm Springs is a quiet, rural community that has gained attention for its large properties, open spaces, and relatively close access to Nashville. As buyers sought peace and privacy during the pandemic, interest in the area exploded.
With limited inventory and high acreage homes, prices surged—especially in 2021 and 2022. Although 2023 brought a temporary correction, the following rebound demonstrates that demand for rural luxury and land remains strong in this part of Tennessee.
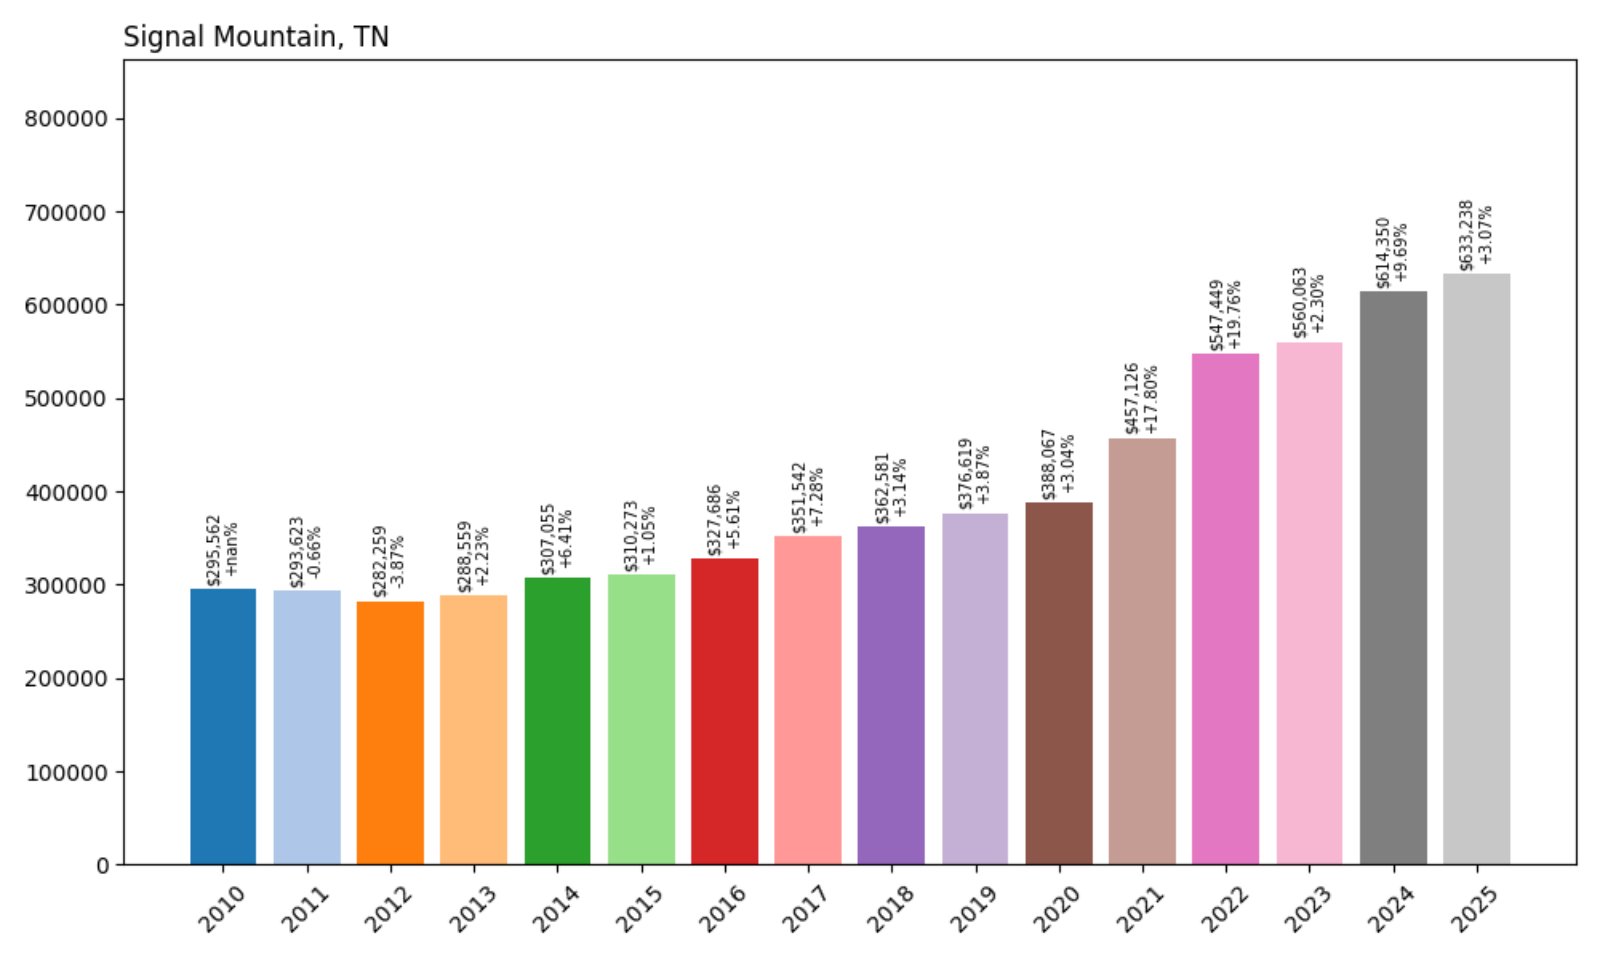
13. Signal Mountain – 114% Home Price Increase Since 2010
- 2010: $295,562
- 2011: $293,623 (−$1,939, −0.66% from previous year)
- 2012: $282,259 (−$11,364, −3.87% from previous year)
- 2013: $288,559 (+$6,300, +2.23% from previous year)
- 2014: $307,055 (+$18,497, +6.41% from previous year)
- 2015: $310,273 (+$3,218, +1.05% from previous year)
- 2016: $327,686 (+$17,413, +5.61% from previous year)
- 2017: $351,542 (+$23,855, +7.28% from previous year)
- 2018: $362,581 (+$11,039, +3.14% from previous year)
- 2019: $376,619 (+$14,038, +3.87% from previous year)
- 2020: $388,067 (+$11,448, +3.04% from previous year)
- 2021: $457,126 (+$69,059, +17.80% from previous year)
- 2022: $547,449 (+$90,323, +19.76% from previous year)
- 2023: $560,063 (+$12,614, +2.30% from previous year)
- 2024: $614,350 (+$54,287, +9.69% from previous year)
- 2025: $633,238 (+$18,888, +3.07% from previous year)
Signal Mountain’s home values have climbed from $296K in 2010 to $633K in 2025—more than doubling in 15 years. Notable spikes occurred after 2020, with consistent gains continuing into the current year.
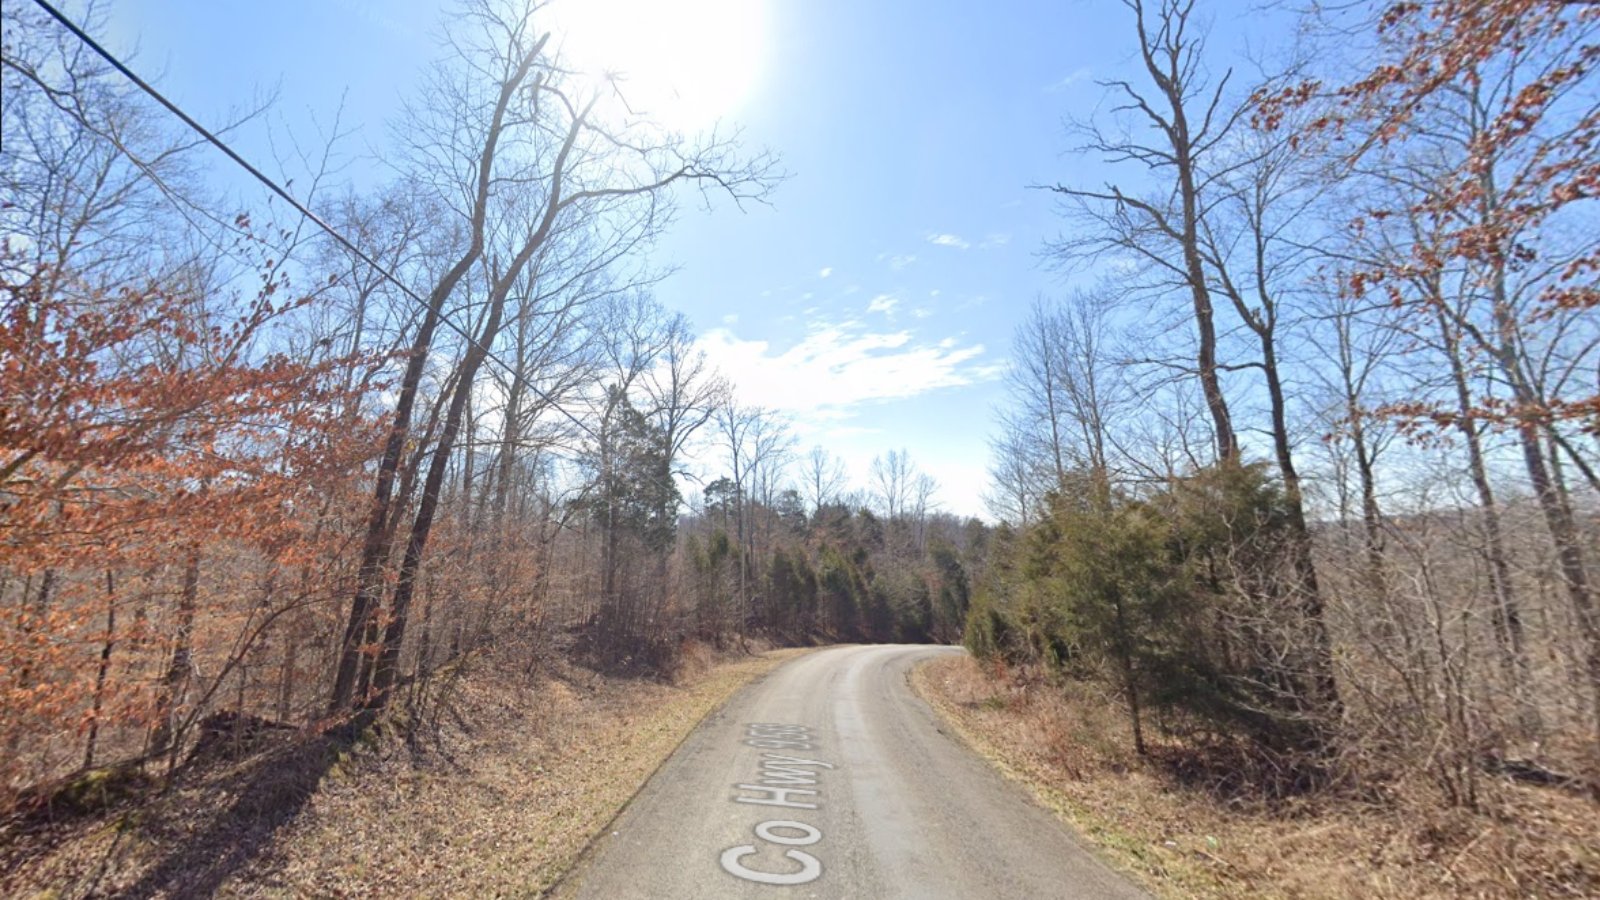
Signal Mountain – High Demand in Greater Chattanooga
Perched on a scenic ridge northwest of Chattanooga, Signal Mountain has long been known for its sweeping views, top-tier schools, and close-knit community. These features have kept demand strong for decades, especially among professionals and retirees relocating from out of state.
Between 2020 and 2022, the market saw substantial appreciation. And with ongoing improvements in amenities and infrastructure, the town remains one of the most expensive—and desirable—locations in the Chattanooga area.
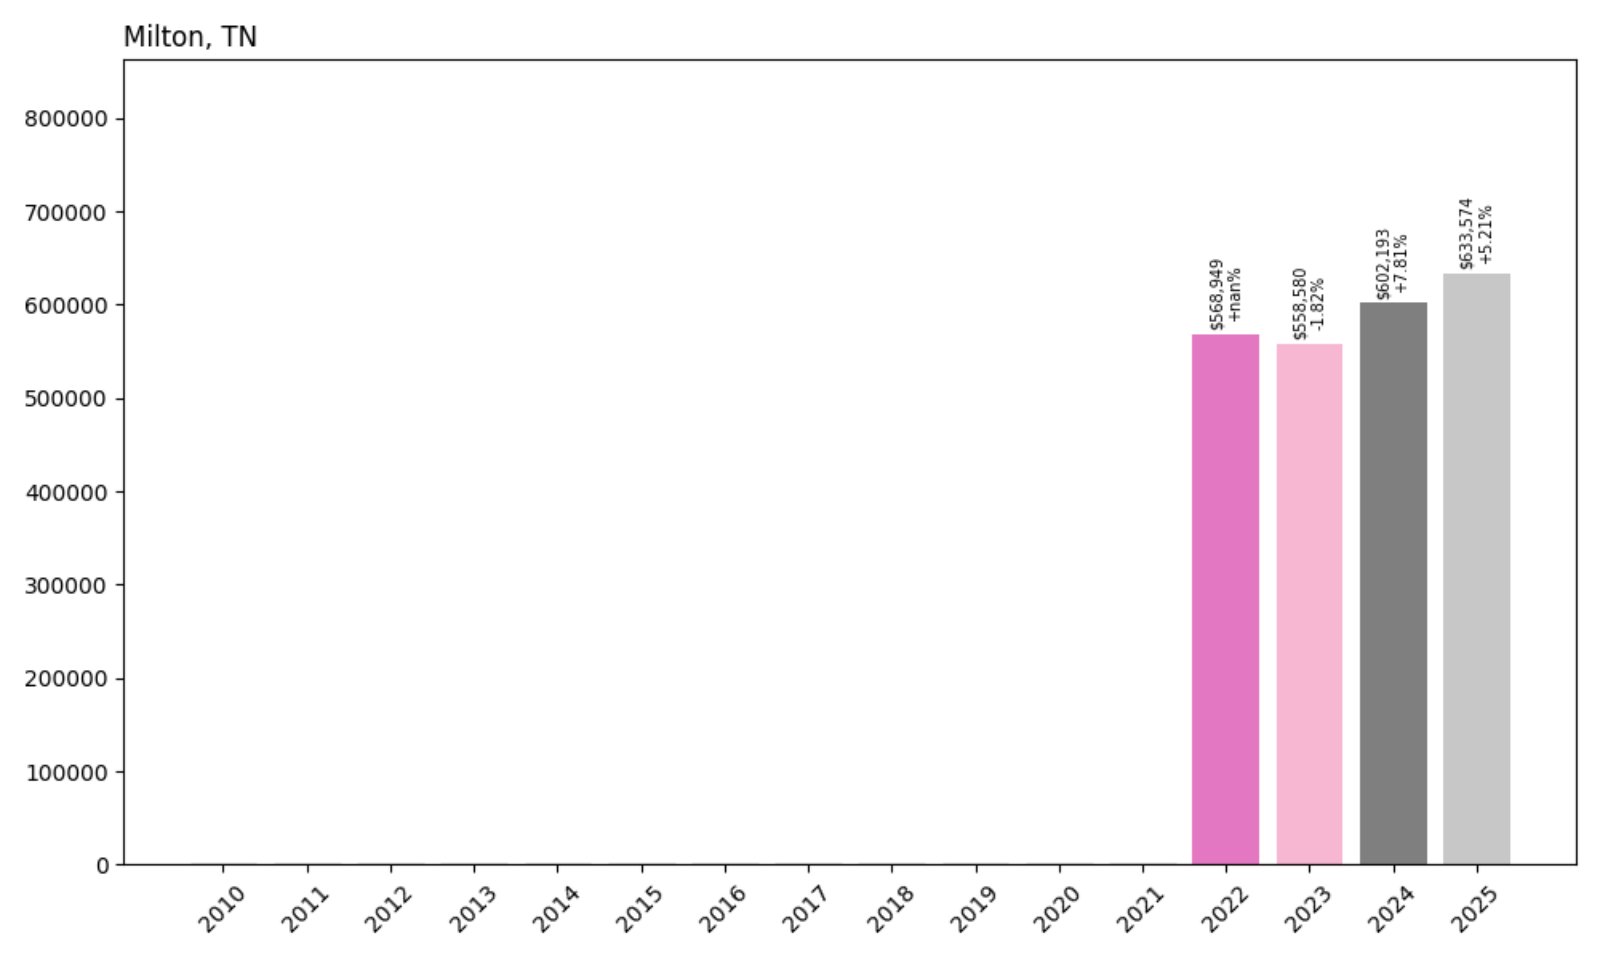
12. Milton – 11% Home Price Increase Since 2022
- 2022: $568,949
- 2023: $558,580 (−$10,370, −1.82% from previous year)
- 2024: $602,193 (+$43,613, +7.81% from previous year)
- 2025: $633,574 (+$31,381, +5.21% from previous year)
Milton’s prices increased by more than 11% since 2022, rising to over $633K in 2025. After a slight dip in 2023, the market rebounded strongly, with solid growth continuing into this year.
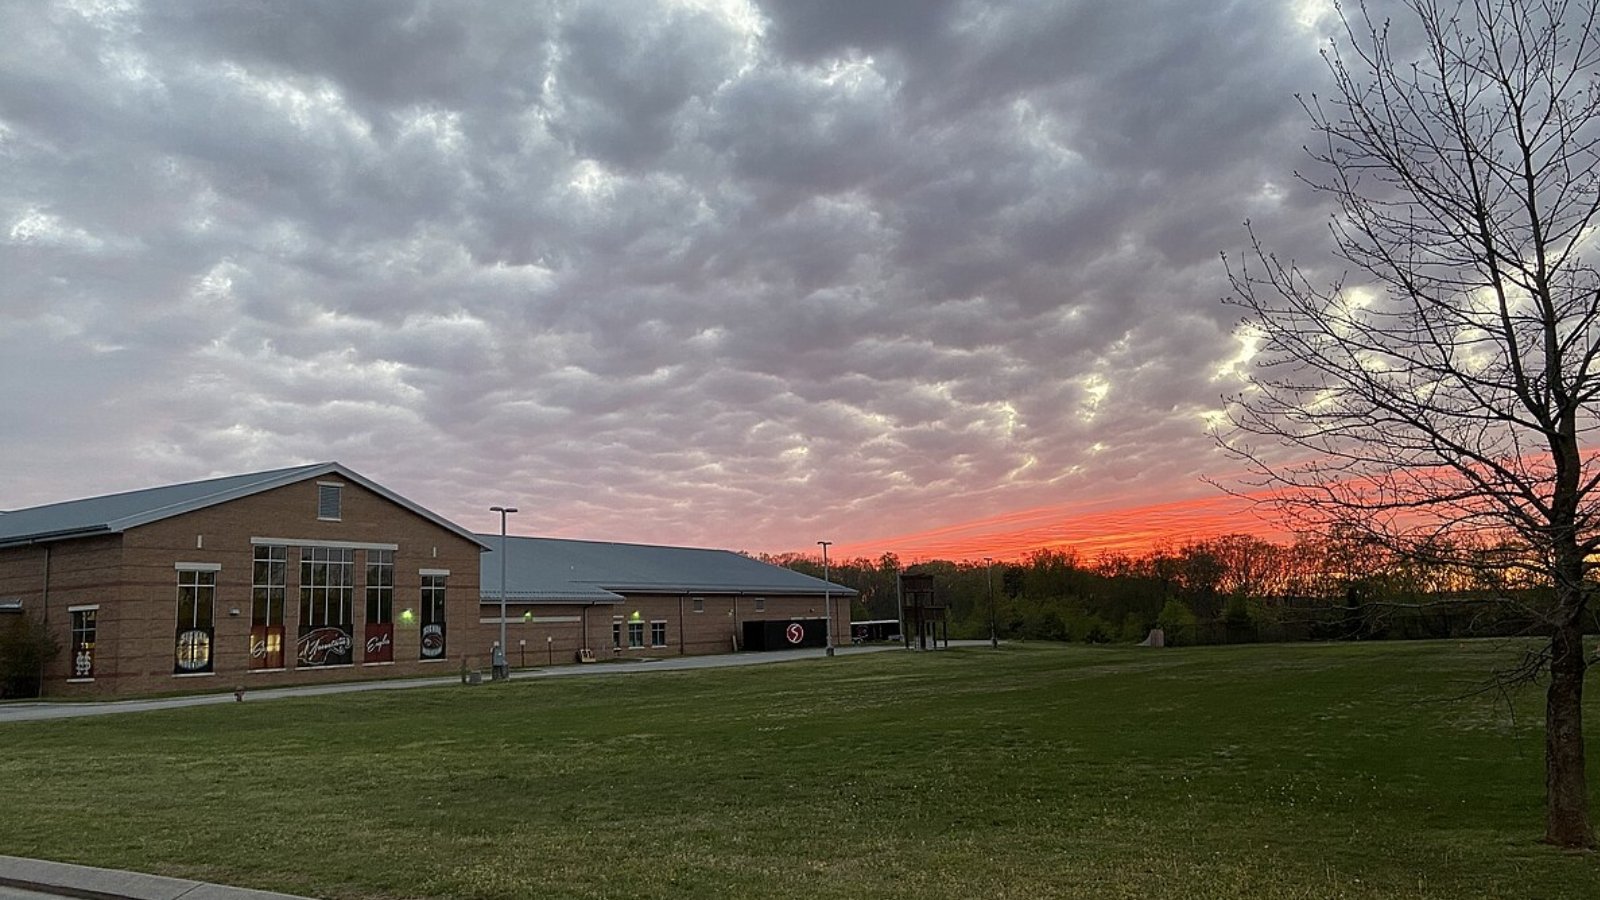
Milton – A Rising Star in Rutherford County
Milton is a small but increasingly upscale rural area in Rutherford County. Though not widely known, it has become attractive for high-end custom homes on large parcels of land, particularly for buyers seeking privacy and space.
The rebound in 2024 and 2025 reflects ongoing demand from wealthy buyers and the influence of nearby Murfreesboro’s rapid expansion. With low inventory and increasing development interest, Milton is quietly making its way up the price ladder.
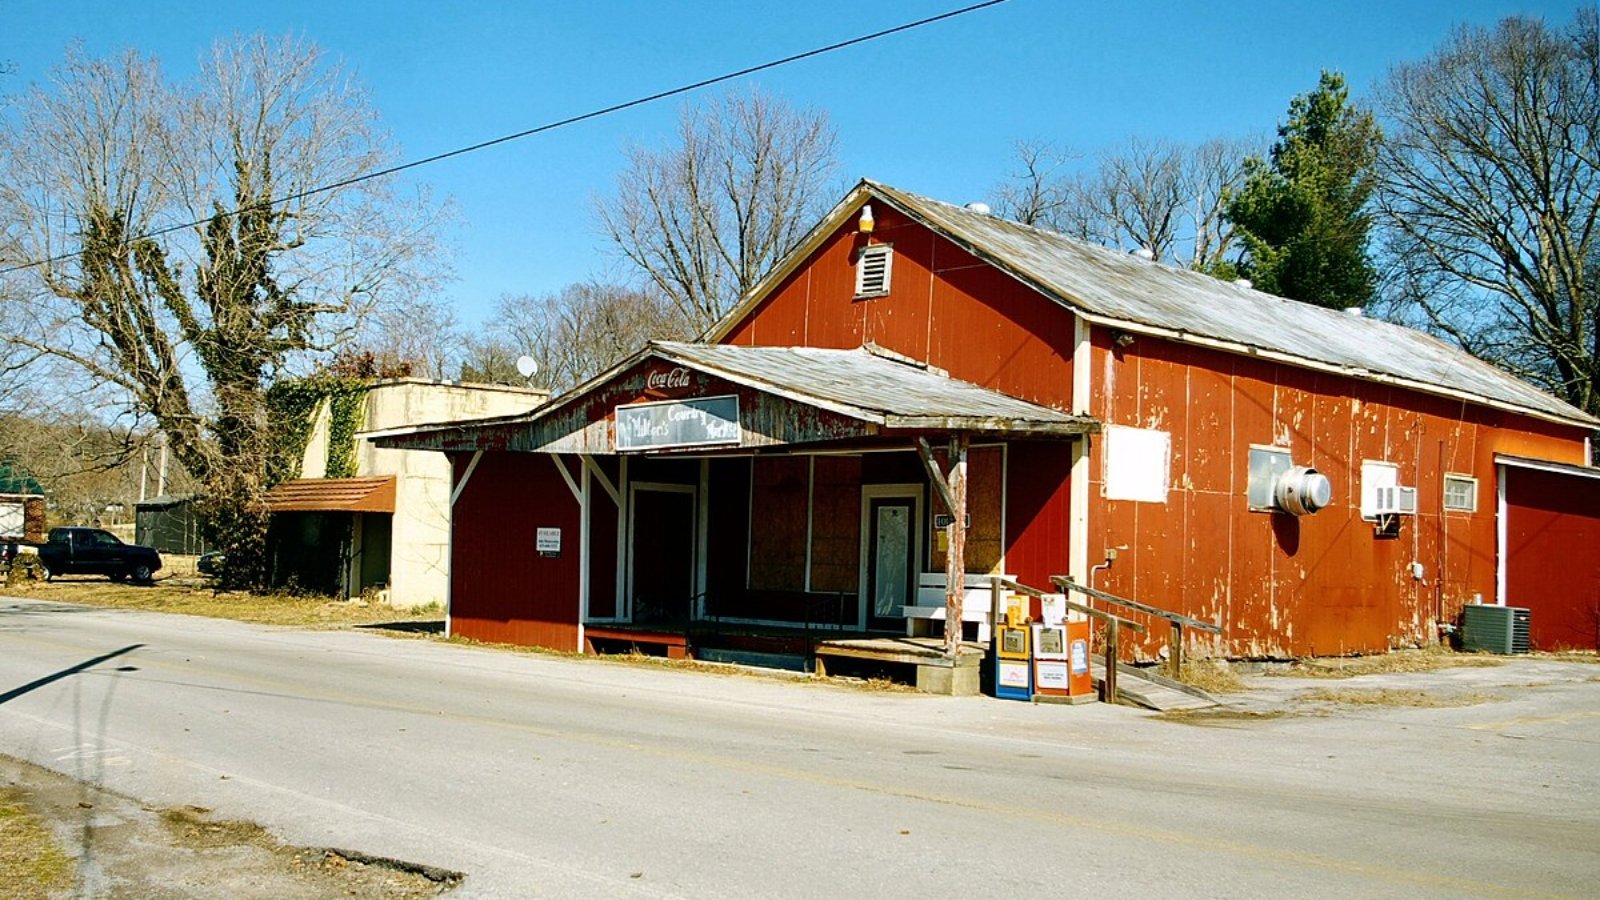
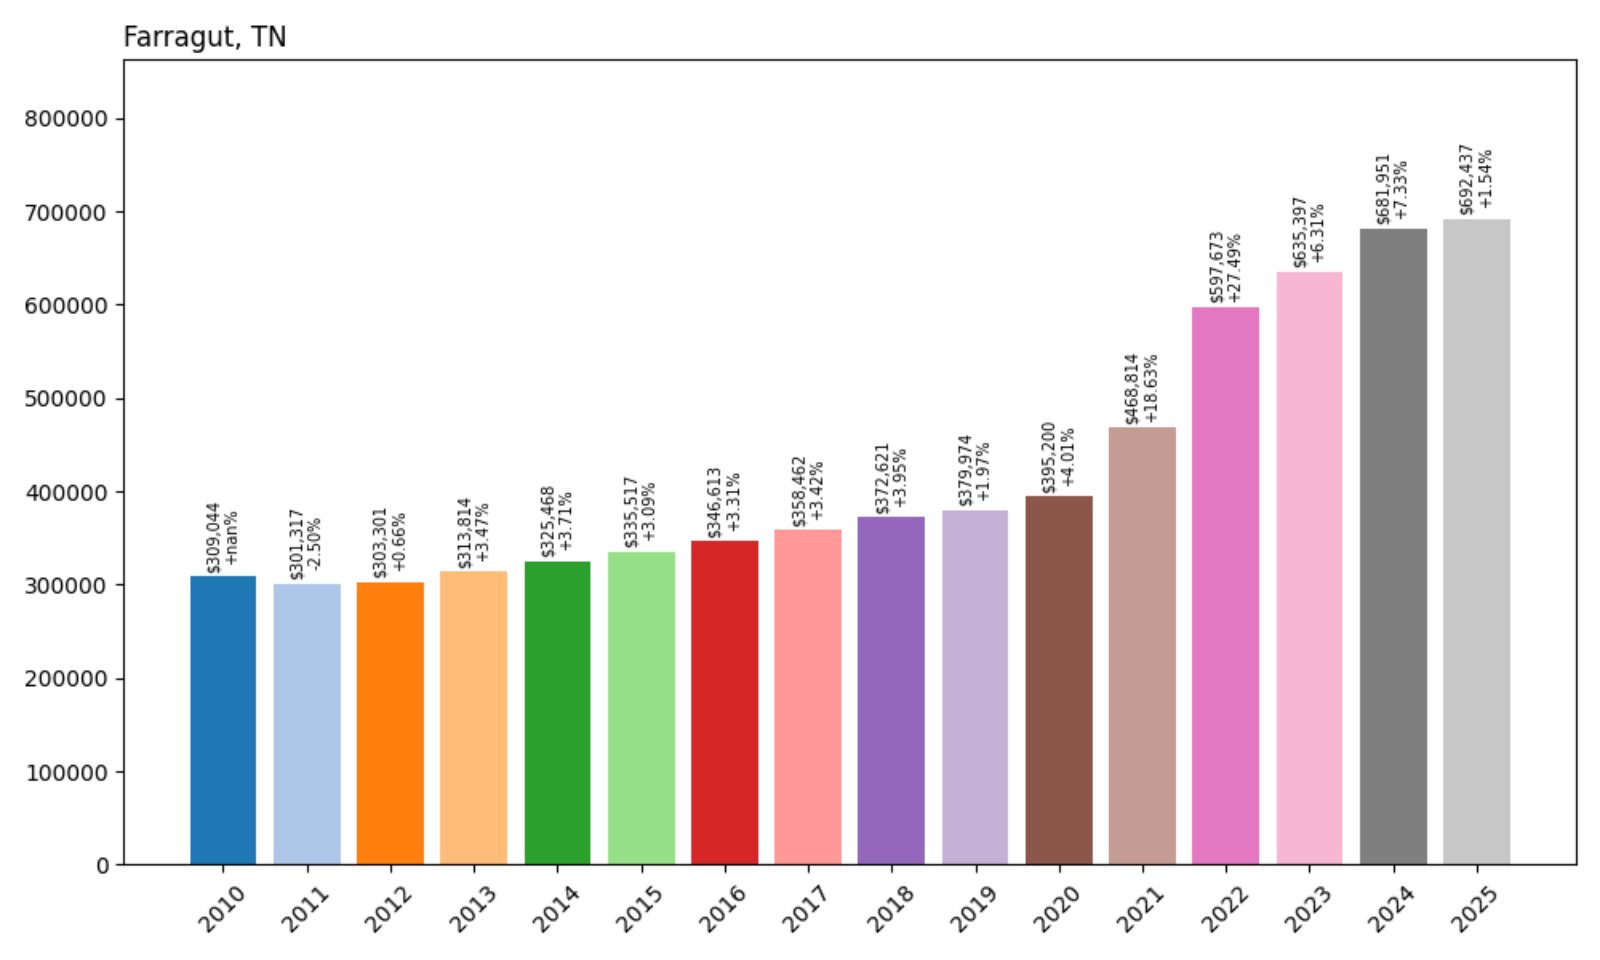
11. Farragut – 124% Home Price Increase Since 2010
- 2010: $309,044
- 2011: $301,317 (−$7,727, −2.50% from previous year)
- 2012: $303,301 (+$1,984, +0.66% from previous year)
- 2013: $313,814 (+$10,512, +3.47% from previous year)
- 2014: $325,468 (+$11,655, +3.71% from previous year)
- 2015: $335,517 (+$10,049, +3.09% from previous year)
- 2016: $346,613 (+$11,096, +3.31% from previous year)
- 2017: $358,462 (+$11,849, +3.42% from previous year)
- 2018: $372,621 (+$14,159, +3.95% from previous year)
- 2019: $379,974 (+$7,353, +1.97% from previous year)
- 2020: $395,200 (+$15,226, +4.01% from previous year)
- 2021: $468,814 (+$73,614, +18.63% from previous year)
- 2022: $597,673 (+$128,859, +27.49% from previous year)
- 2023: $635,397 (+$37,724, +6.31% from previous year)
- 2024: $681,951 (+$46,554, +7.33% from previous year)
- 2025: $692,437 (+$10,486, +1.54% from previous year)
Farragut’s home prices have more than doubled since 2010, climbing from $309K to over $692K in 2025. The largest gains came after 2020, especially in 2022, followed by steady appreciation.
Farragut – Affluent Growth in the Knoxville Metro
Farragut is one of the most affluent communities in the Knoxville area, offering excellent schools, upscale shopping, and lakefront access. Its housing market has been among the region’s most competitive, especially since 2020.
While price growth has slowed somewhat in the last year, demand remains strong due to its prime location, low crime, and established neighborhoods. Farragut continues to command some of the highest price tags in East Tennessee.
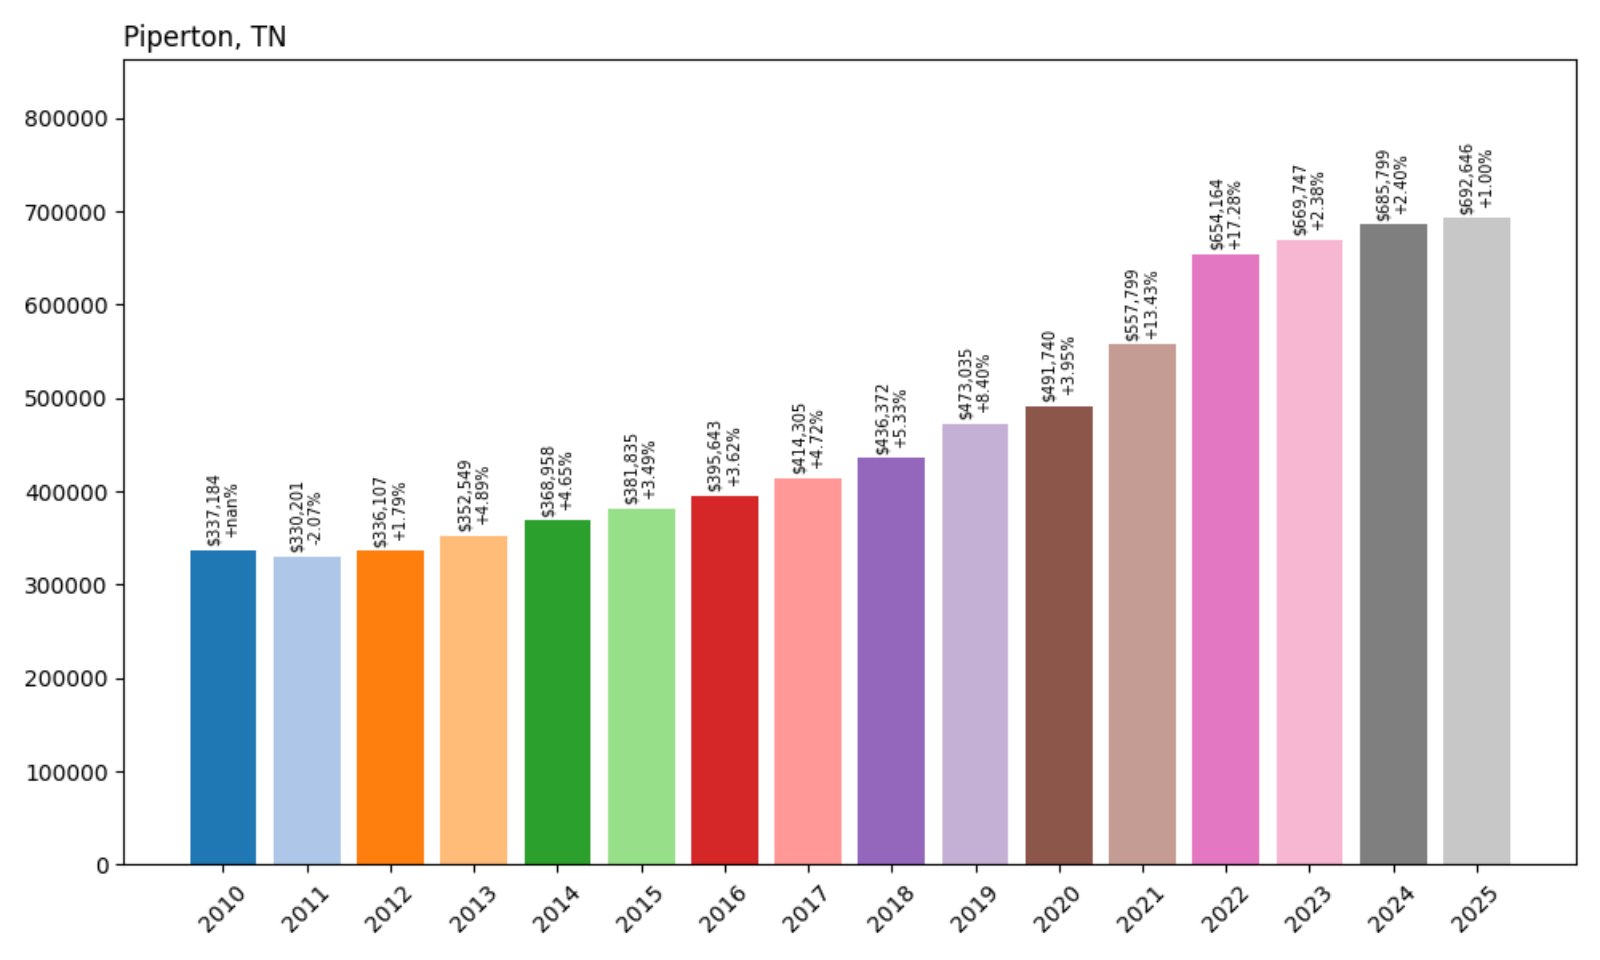
10. Piperton – 105% Home Price Increase Since 2010
- 2010: $337,184
- 2011: $330,201 (−$6,983, −2.07% from previous year)
- 2012: $336,107 (+$5,906, +1.79% from previous year)
- 2013: $352,549 (+$16,442, +4.89% from previous year)
- 2014: $368,958 (+$16,409, +4.65% from previous year)
- 2015: $381,835 (+$12,877, +3.49% from previous year)
- 2016: $395,643 (+$13,808, +3.62% from previous year)
- 2017: $414,305 (+$18,663, +4.72% from previous year)
- 2018: $436,372 (+$22,066, +5.33% from previous year)
- 2019: $473,035 (+$36,663, +8.40% from previous year)
- 2020: $491,740 (+$18,706, +3.95% from previous year)
- 2021: $557,799 (+$66,058, +13.43% from previous year)
- 2022: $654,164 (+$96,365, +17.28% from previous year)
- 2023: $669,747 (+$15,583, +2.38% from previous year)
- 2024: $685,799 (+$16,052, +2.40% from previous year)
- 2025: $692,646 (+$6,847, +1.00% from previous year)
Piperton’s home values have surged over the past 15 years, with prices climbing from $337K in 2010 to nearly $693K in 2025. The town saw its steepest gains in 2021 and 2022, where annual increases hit double digits. While growth has slowed in recent years, the overall upward trend underscores steady demand in this corner of Fayette County.
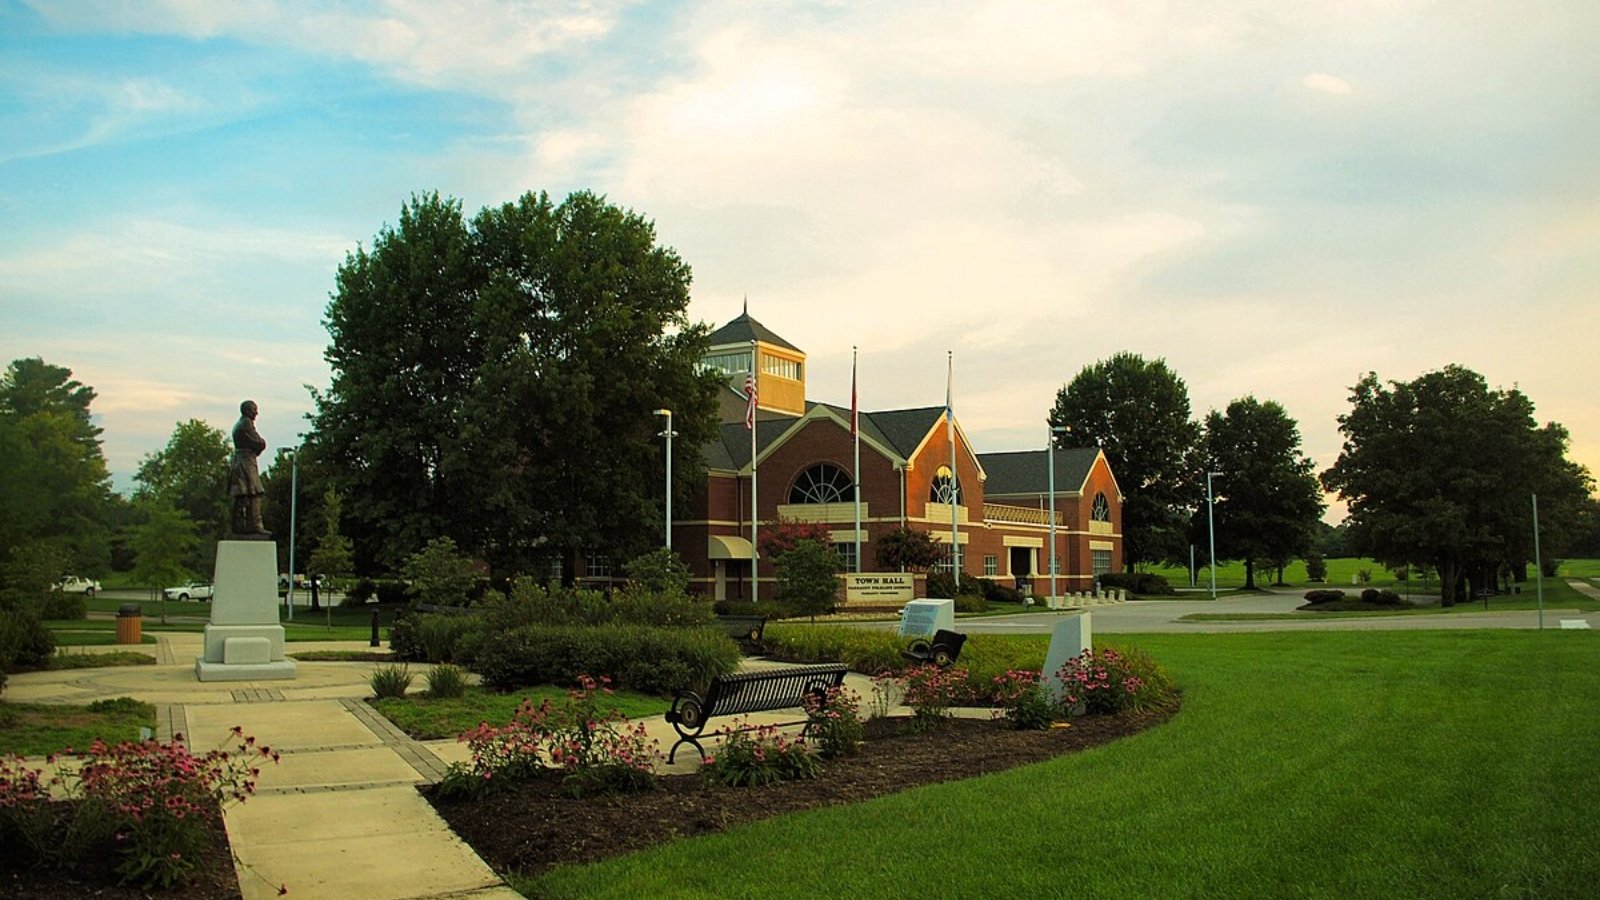
Piperton – Steady Climb in a Rural-Chic Setting
Located just east of the Memphis metro area near the Mississippi border, Piperton blends wide-open rural charm with convenient access to the city. Its high property values reflect low density, privacy, and an influx of affluent buyers looking for custom builds on larger lots. The town has strict zoning and infrastructure controls that limit overdevelopment, helping preserve its character and desirability.
In 2025, homes in Piperton average over $690,000—up more than 100% from 2010. Recent annual growth has tapered to under 3%, mirroring broader market conditions in West Tennessee. Still, new construction and proximity to Collierville’s retail hubs continue to support values. It’s a favorite for homeowners who want space, peace, and investment stability.
9. Eads – 1% Home Price Increase Since 2024
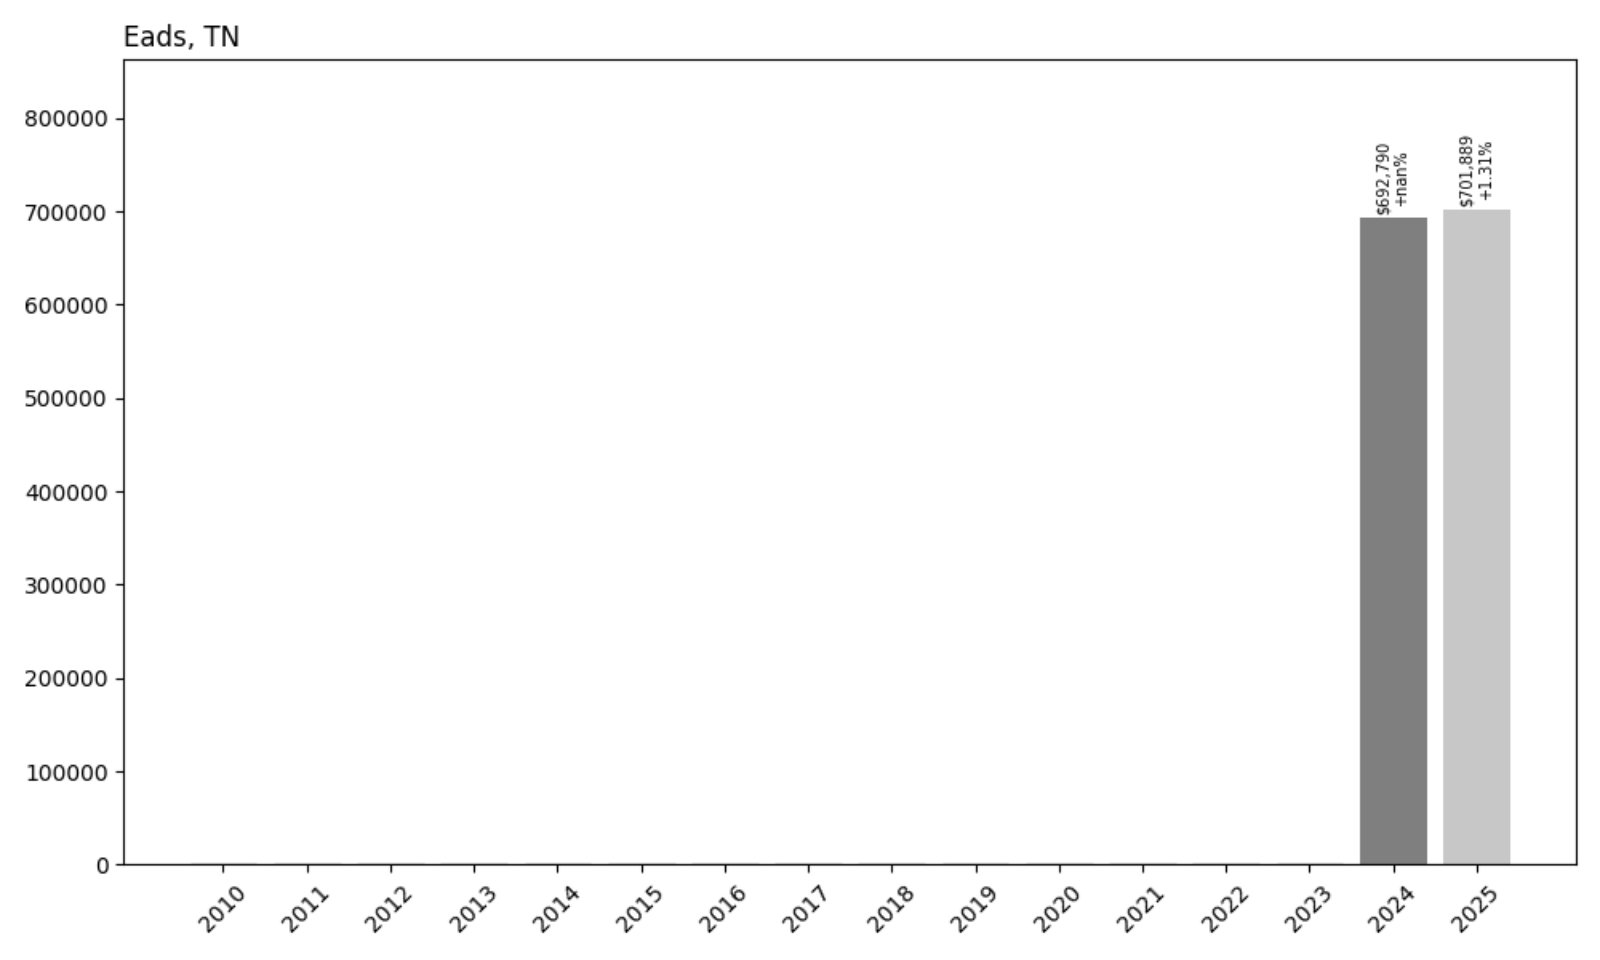
- 2024: $692,790
- 2025: $701,889 (+$9,099, +1.31% from previous year)
Eads has limited historical data available in the Zillow Home Value Index, but the figures that do exist indicate stability. Between 2024 and 2025, average home values increased by roughly $9,000. That modest bump signals a quiet but consistent market in this upscale rural community.
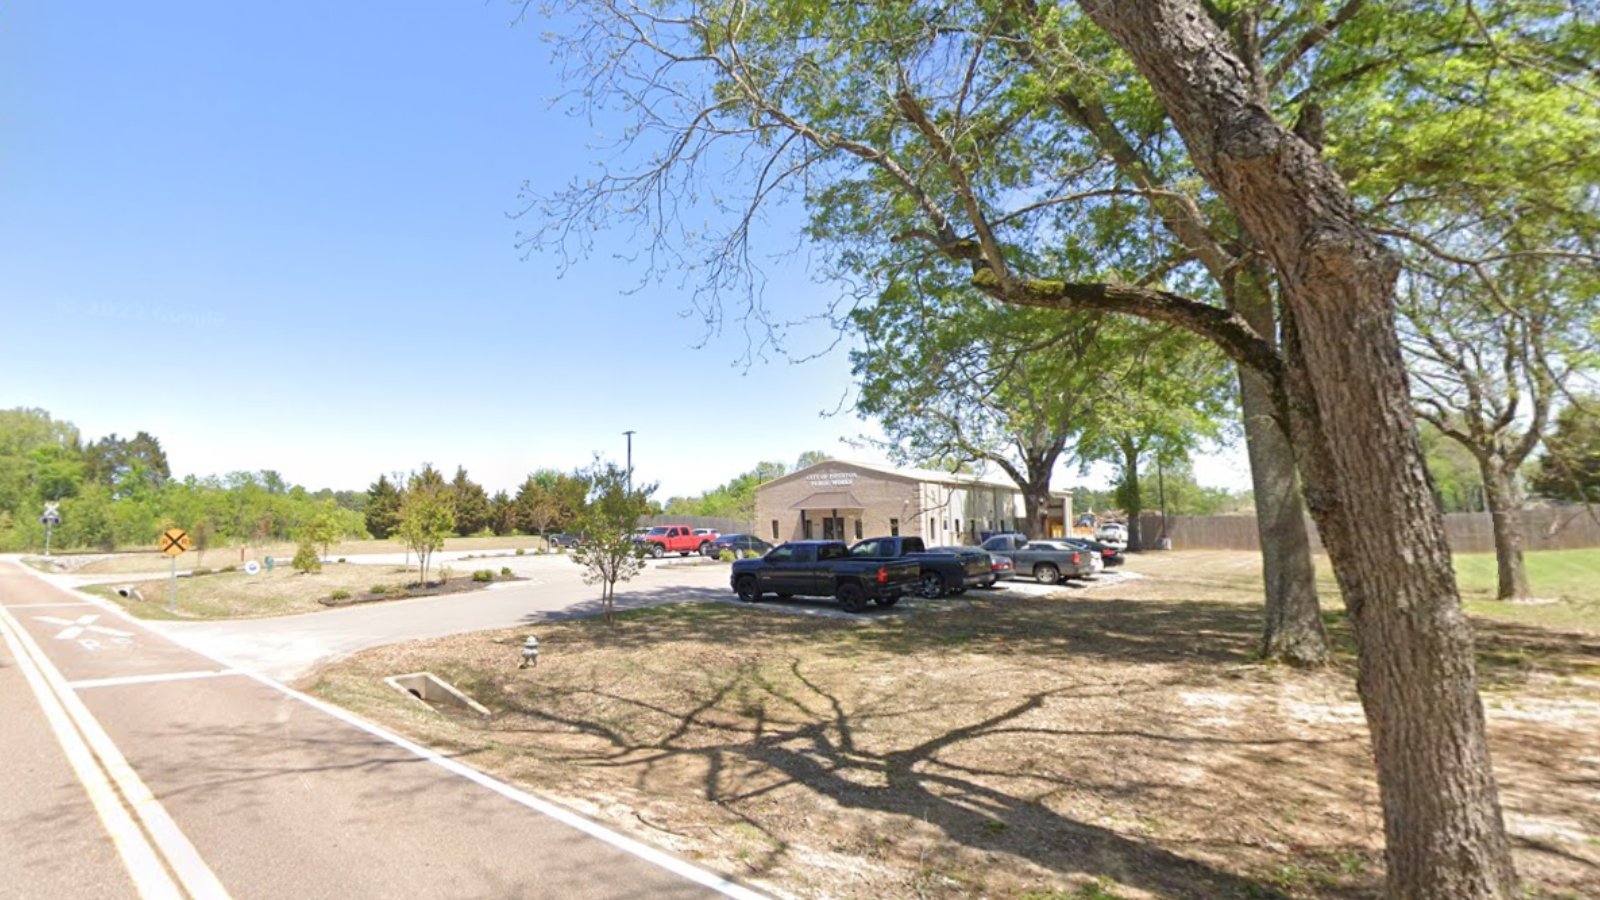
Eads – Exclusive Living Without the Noise
Eads straddles both Shelby and Fayette counties and has long appealed to high-income buyers seeking large properties and quiet surroundings. Despite its proximity to Memphis, Eads maintains a distinct rural identity, with custom estates, wooded lots, and horse-friendly zoning.
The town’s lack of dense development may explain the slow but stable price increases observed in recent data. While we don’t have a long-term Zillow trendline, the most recent values place Eads firmly among the top tier in Tennessee housing costs, thanks to its luxury acreage and enduring appeal.
8. Walden – 115% Home Price Increase Since 2010
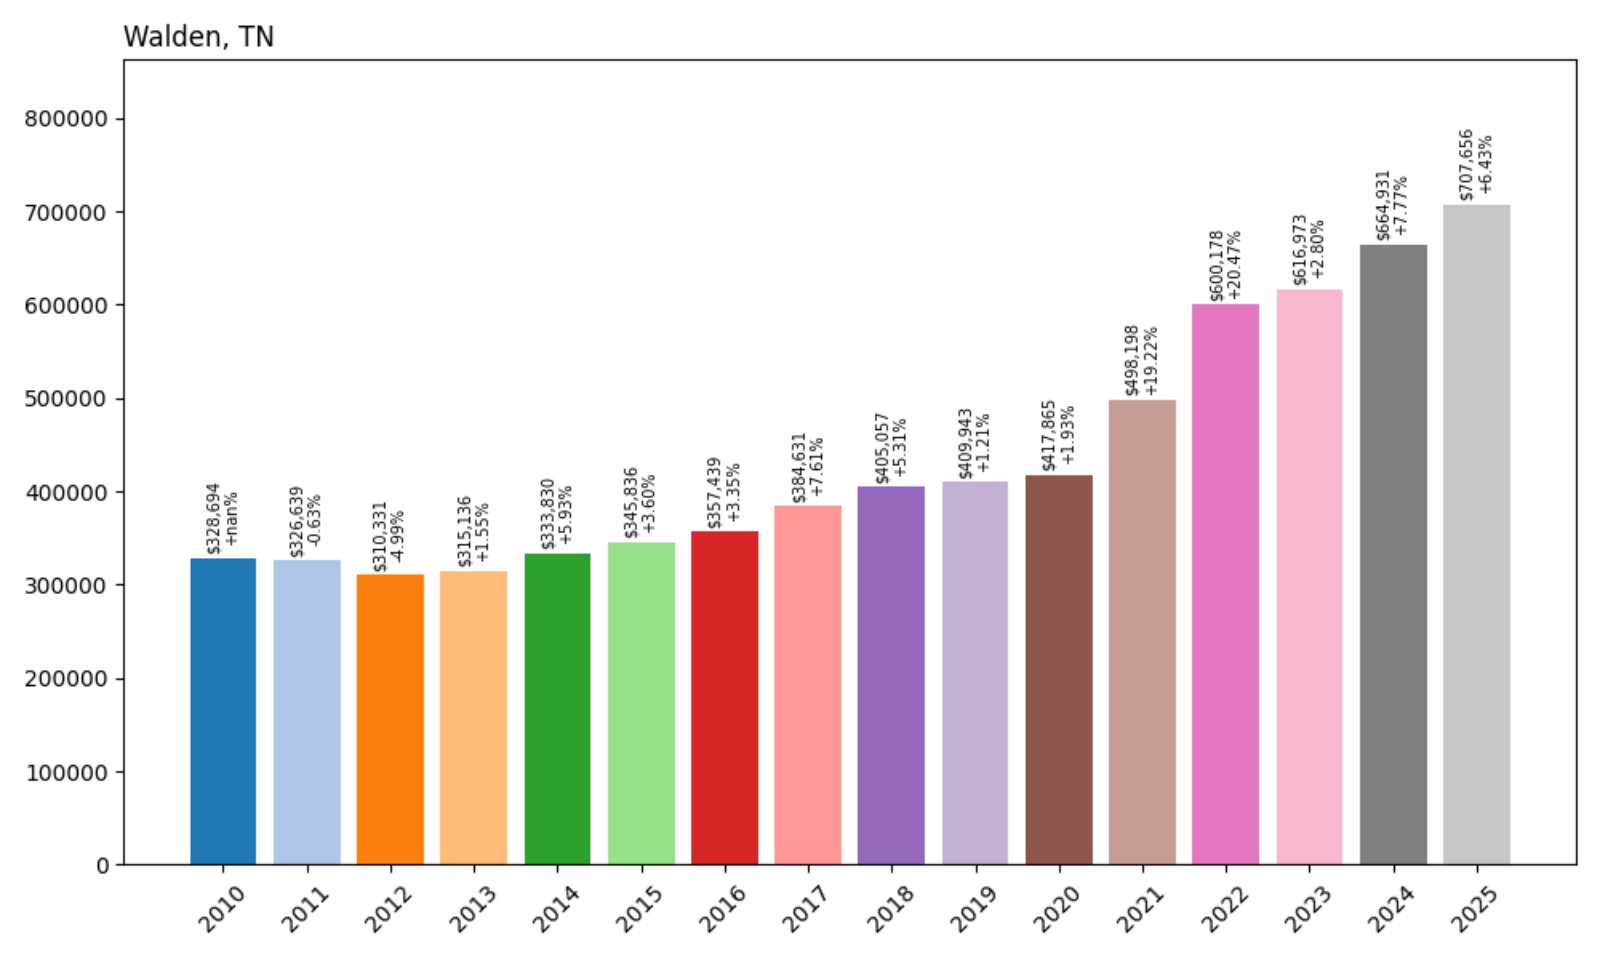
- 2010: $328,694
- 2011: $326,639 (−$2,055, −0.63% from previous year)
- 2012: $310,331 (−$16,309, −4.99% from previous year)
- 2013: $315,136 (+$4,805, +1.55% from previous year)
- 2014: $333,830 (+$18,694, +5.93% from previous year)
- 2015: $345,836 (+$12,005, +3.60% from previous year)
- 2016: $357,439 (+$11,603, +3.35% from previous year)
- 2017: $384,631 (+$27,193, +7.61% from previous year)
- 2018: $405,057 (+$20,426, +5.31% from previous year)
- 2019: $409,943 (+$4,886, +1.21% from previous year)
- 2020: $417,865 (+$7,921, +1.93% from previous year)
- 2021: $498,198 (+$80,333, +19.22% from previous year)
- 2022: $600,178 (+$101,980, +20.47% from previous year)
- 2023: $616,973 (+$16,795, +2.80% from previous year)
- 2024: $664,931 (+$47,958, +7.77% from previous year)
- 2025: $707,656 (+$42,725, +6.43% from previous year)
From just over $328K in 2010 to more than $707K in 2025, home values in Walden have more than doubled. The town saw especially strong momentum during the pandemic housing boom, with back-to-back 20%+ annual jumps in 2021 and 2022. While that pace has eased, growth remains positive and above average statewide.
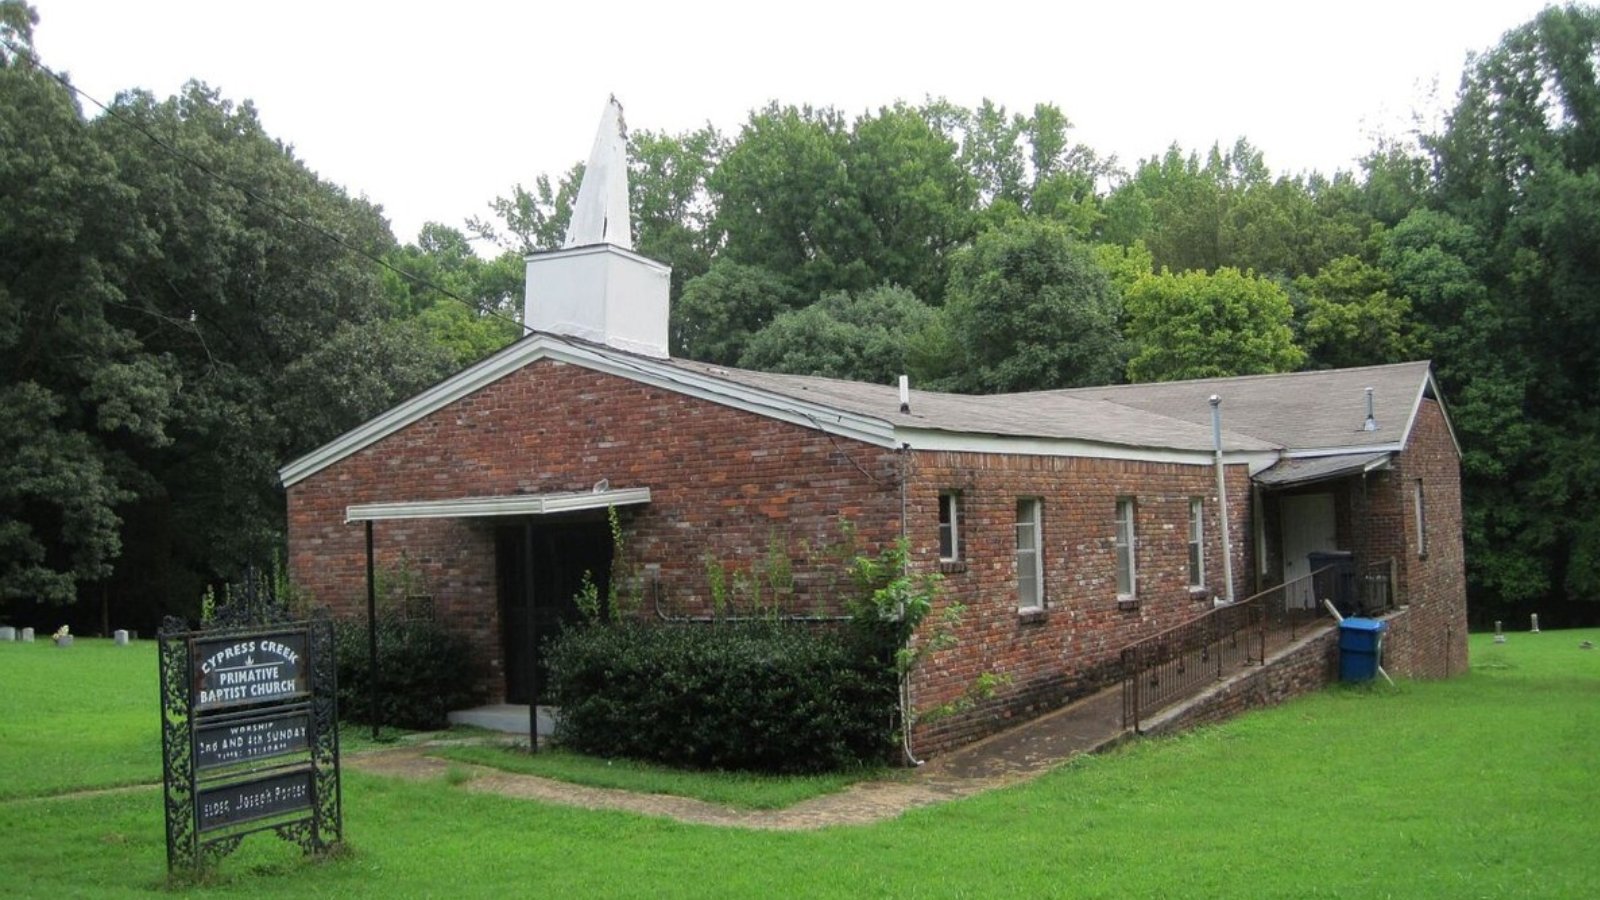
Walden – Scenic, Private, and High in Value
Tucked on Signal Mountain just outside Chattanooga, Walden is known for its elevation, forested lots, and affluent households. It’s a sought-after address for families and retirees alike, offering peace and proximity to nature with fast access to city amenities.
Its strong 2025 valuation is partly driven by limited housing stock and zoning regulations that prevent sprawl. Views, trails, and a strong school system continue to attract high-earning professionals and second-home buyers. Even in slower years, prices in Walden have shown consistent resilience.
7. Thompsons Station – 181% Home Price Increase Since 2010
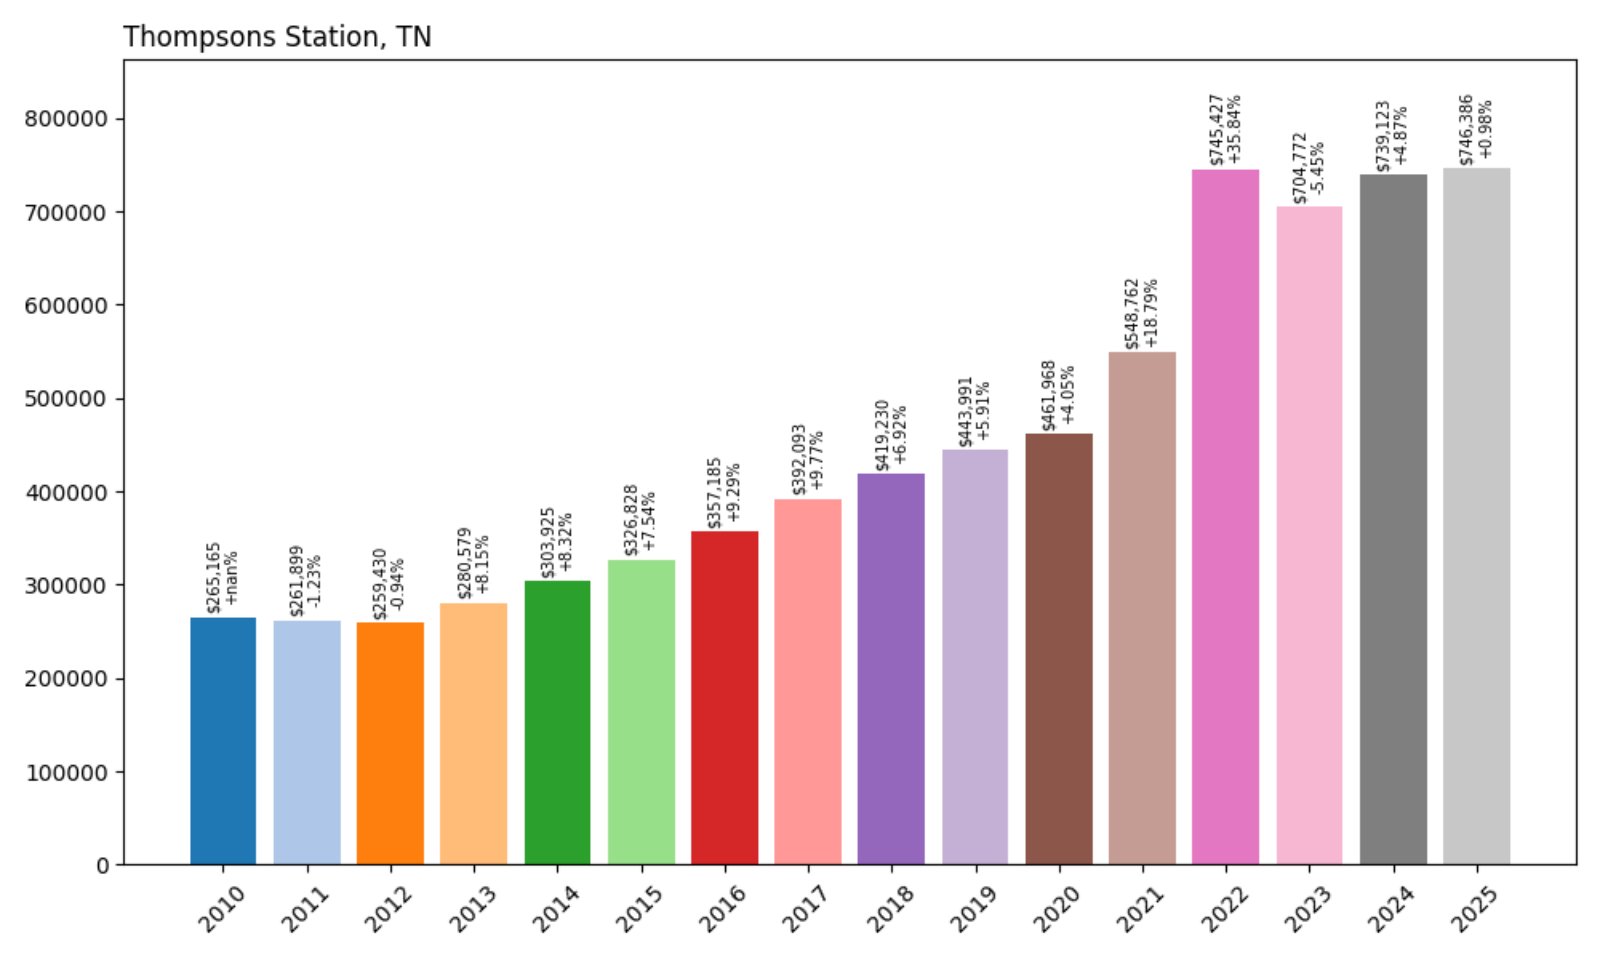
- 2010: $265,165
- 2011: $261,899 (−$3,266, −1.23% from previous year)
- 2012: $259,430 (−$2,469, −0.94% from previous year)
- 2013: $280,579 (+$21,149, +8.15% from previous year)
- 2014: $303,925 (+$23,345, +8.32% from previous year)
- 2015: $326,828 (+$22,903, +7.54% from previous year)
- 2016: $357,185 (+$30,357, +9.29% from previous year)
- 2017: $392,093 (+$34,908, +9.77% from previous year)
- 2018: $419,230 (+$27,137, +6.92% from previous year)
- 2019: $443,991 (+$24,761, +5.91% from previous year)
- 2020: $461,968 (+$17,977, +4.05% from previous year)
- 2021: $548,762 (+$86,794, +18.79% from previous year)
- 2022: $745,427 (+$196,666, +35.84% from previous year)
- 2023: $704,772 (−$40,656, −5.45% from previous year)
- 2024: $739,123 (+$34,351, +4.87% from previous year)
- 2025: $746,386 (+$7,263, +0.98% from previous year)
Thompsons Station’s home values have nearly tripled since 2010, with the biggest jump coming in 2022. Though values dipped in 2023, they’ve regained ground, reflecting a maturing but still strong market in Williamson County. In 2025, average home values sit around $746K.
Thompsons Station – Growth Fueled by Location
Nestled between Franklin and Spring Hill, Thompsons Station is one of the Nashville area’s fastest-growing commuter towns. New neighborhoods, good schools, and proximity to I-840 have made it popular with families and telecommuters seeking newer homes in a semi-rural setting.
That demand has pushed prices steadily upward, particularly during the pandemic when large homes and space became top priorities. With housing starts now moderating and interest rates affecting affordability, price growth is easing. Still, the town remains among the most desirable and expensive in Middle Tennessee.
6. Nolensville – 152% Home Price Increase Since 2010
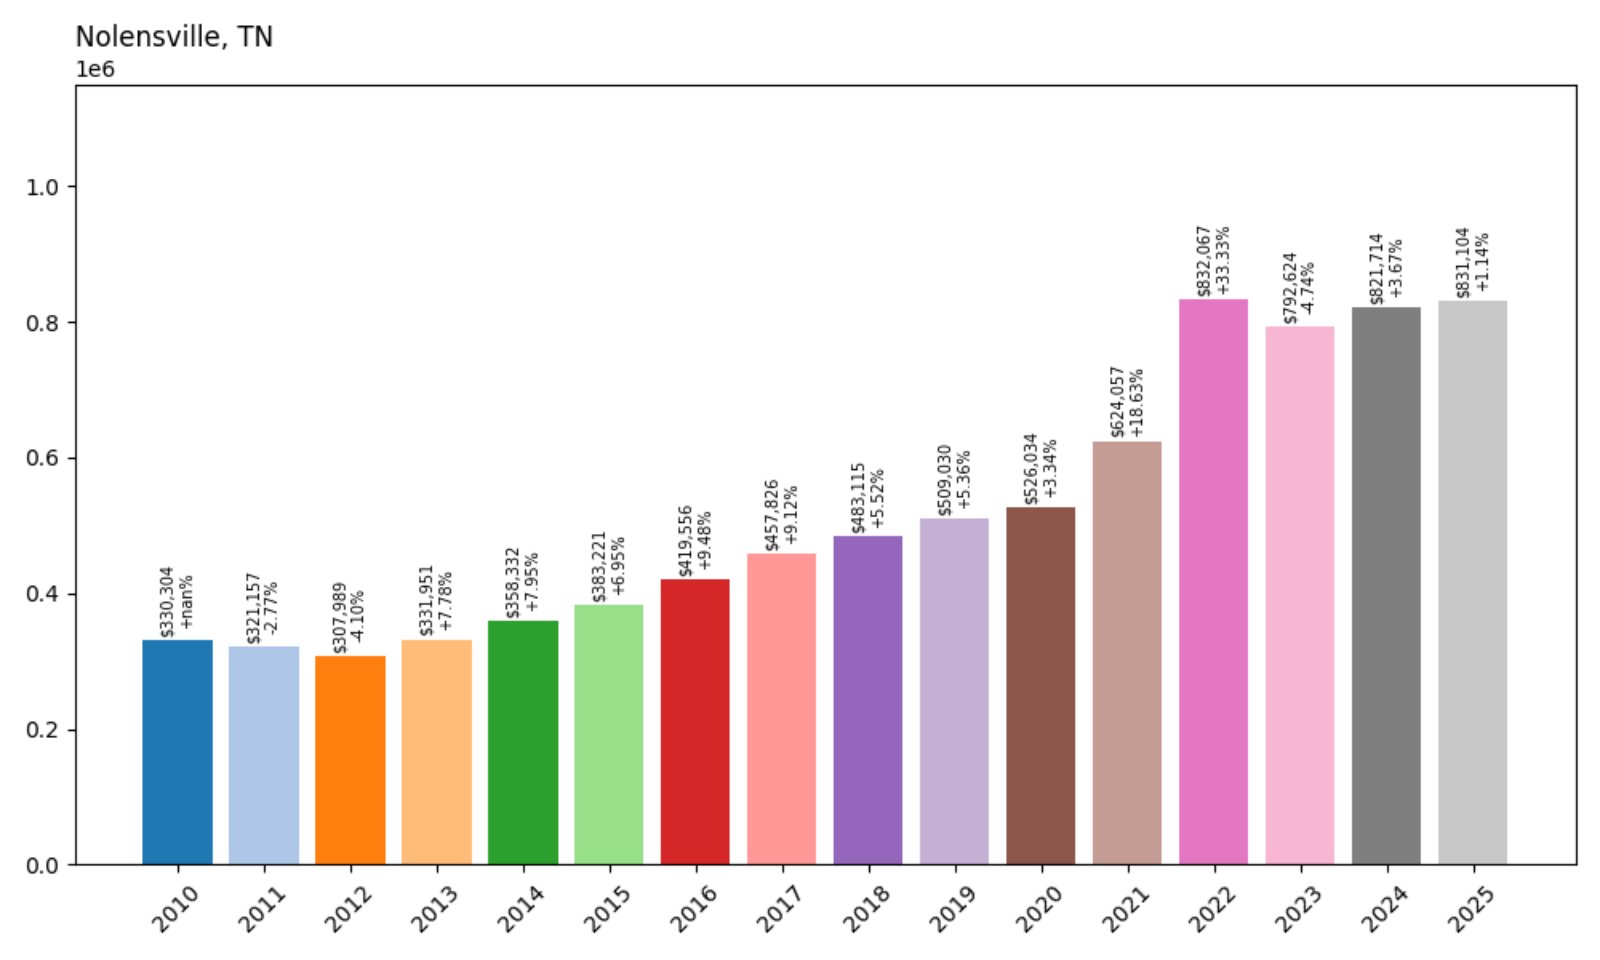
- 2010: $330,304
- 2011: $321,157 (−$9,147, −2.77% from previous year)
- 2012: $307,989 (−$13,168, −4.10% from previous year)
- 2013: $331,951 (+$23,962, +7.78% from previous year)
- 2014: $358,332 (+$26,381, +7.95% from previous year)
- 2015: $383,221 (+$24,888, +6.95% from previous year)
- 2016: $419,556 (+$36,335, +9.48% from previous year)
- 2017: $457,826 (+$38,270, +9.12% from previous year)
- 2018: $483,115 (+$25,289, +5.52% from previous year)
- 2019: $509,030 (+$25,915, +5.36% from previous year)
- 2020: $526,034 (+$17,003, +3.34% from previous year)
- 2021: $624,057 (+$98,023, +18.63% from previous year)
- 2022: $832,067 (+$208,009, +33.33% from previous year)
- 2023: $792,624 (−$39,442, −4.74% from previous year)
- 2024: $821,714 (+$29,089, +3.67% from previous year)
- 2025: $831,104 (+$9,390, +1.14% from previous year)
Nolensville home values have more than doubled since 2010, reaching over $830K in 2025. The town saw explosive gains from 2020–2022, with the 2022 surge topping 33%. Though there was a brief cooldown, values are climbing again, albeit at a gentler pace.
Nolensville – A Nashville-Area Favorite for New Construction
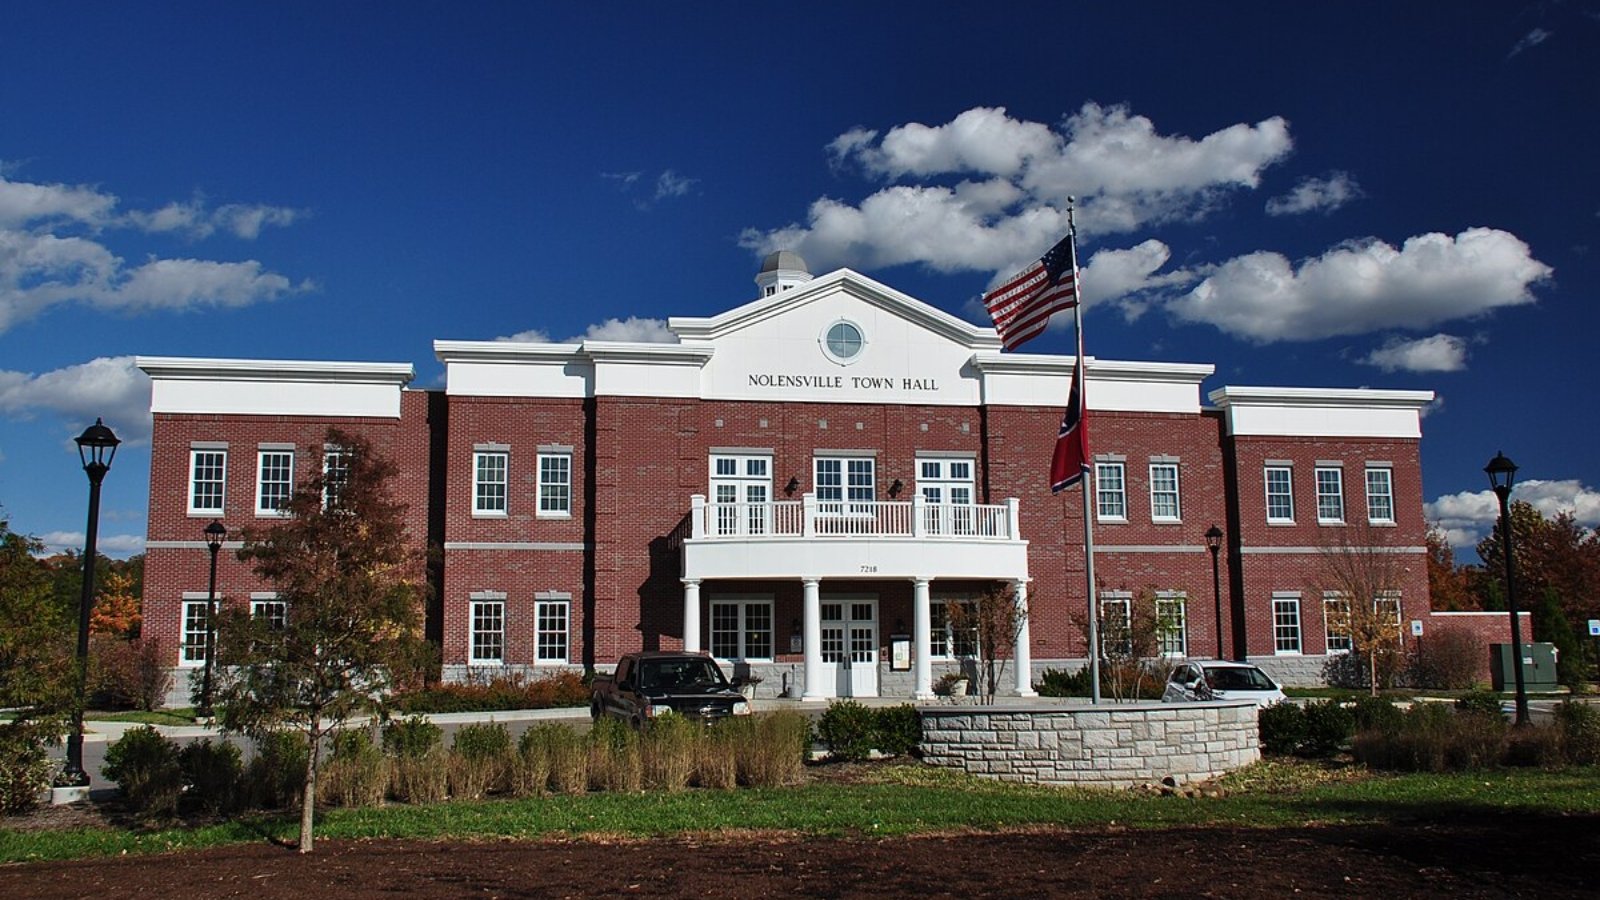
South of Nashville and part of Williamson County, Nolensville blends small-town feel with upscale amenities. It’s a magnet for young professionals, especially those moving from other metros. New subdivisions, modern infrastructure, and high-performing schools have made it a top choice for families relocating to Tennessee.
While earlier price jumps were fueled by demand for spacious new builds, today’s slower growth reflects both high interest rates and a more balanced supply. That said, its strong fundamentals and location mean Nolensville remains one of the most valuable zip codes in the state.
5. Franklin – 173% Home Price Increase Since 2010

- 2010: $336,099
- 2011: $334,654 (−$1,445, −0.43% from previous year)
- 2012: $334,158 (−$496, −0.15% from previous year)
- 2013: $358,933 (+$24,775, +7.41% from previous year)
- 2014: $384,972 (+$26,039, +7.25% from previous year)
- 2015: $410,657 (+$25,685, +6.67% from previous year)
- 2016: $442,783 (+$32,126, +7.82% from previous year)
- 2017: $476,218 (+$33,435, +7.55% from previous year)
- 2018: $502,296 (+$26,078, +5.48% from previous year)
- 2019: $534,570 (+$32,273, +6.43% from previous year)
- 2020: $558,811 (+$24,241, +4.53% from previous year)
- 2021: $671,297 (+$112,486, +20.13% from previous year)
- 2022: $909,594 (+$238,297, +35.50% from previous year)
- 2023: $862,232 (−$47,362, −5.21% from previous year)
- 2024: $902,475 (+$40,243, +4.67% from previous year)
- 2025: $918,147 (+$15,671, +1.74% from previous year)
Home values in Franklin have surged from $336K in 2010 to over $918K in 2025—a 173% increase. The city posted huge gains in 2021 and 2022, though prices briefly dipped in 2023 before rebounding modestly. It remains one of the most stable and desirable real estate markets in Tennessee.
Franklin – Historic Charm Meets High Growth
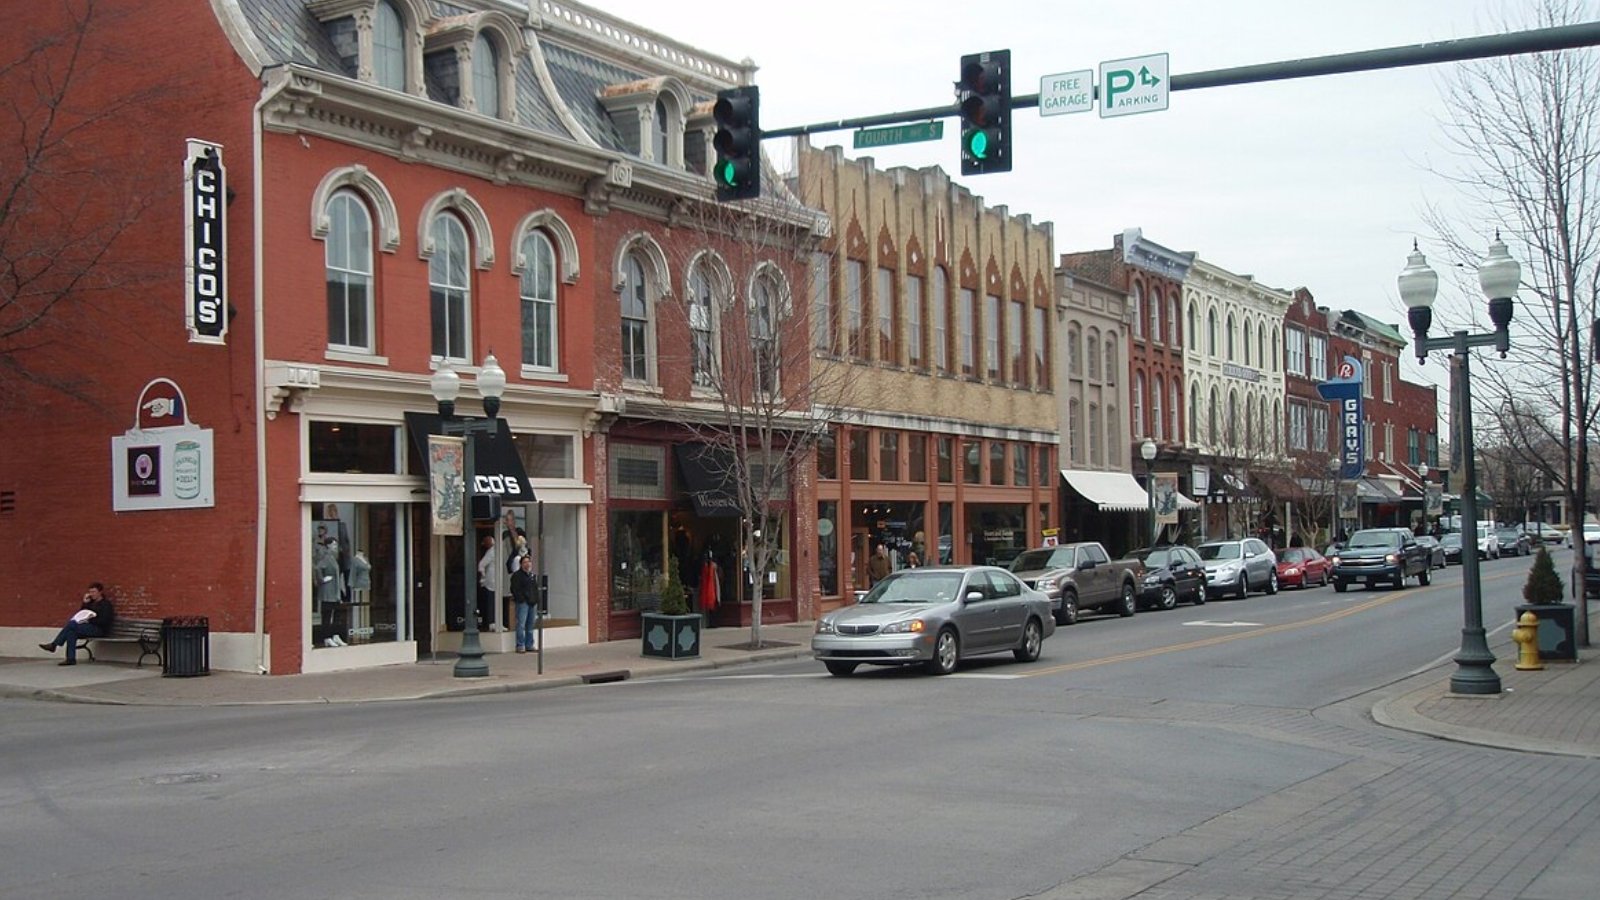
Franklin is widely known as one of the most livable small cities in America. Located just south of Nashville, this Williamson County hub blends Civil War-era architecture with top-tier schools, a bustling downtown, and master-planned neighborhoods.
Its meteoric rise in home prices reflects the town’s cultural significance, employment growth, and lifestyle appeal. Buyers flock here for access to jobs in healthcare, tech, and entertainment. Even with recent slowdowns, Franklin’s value retention is unmatched thanks to its enduring popularity and wealth concentration.
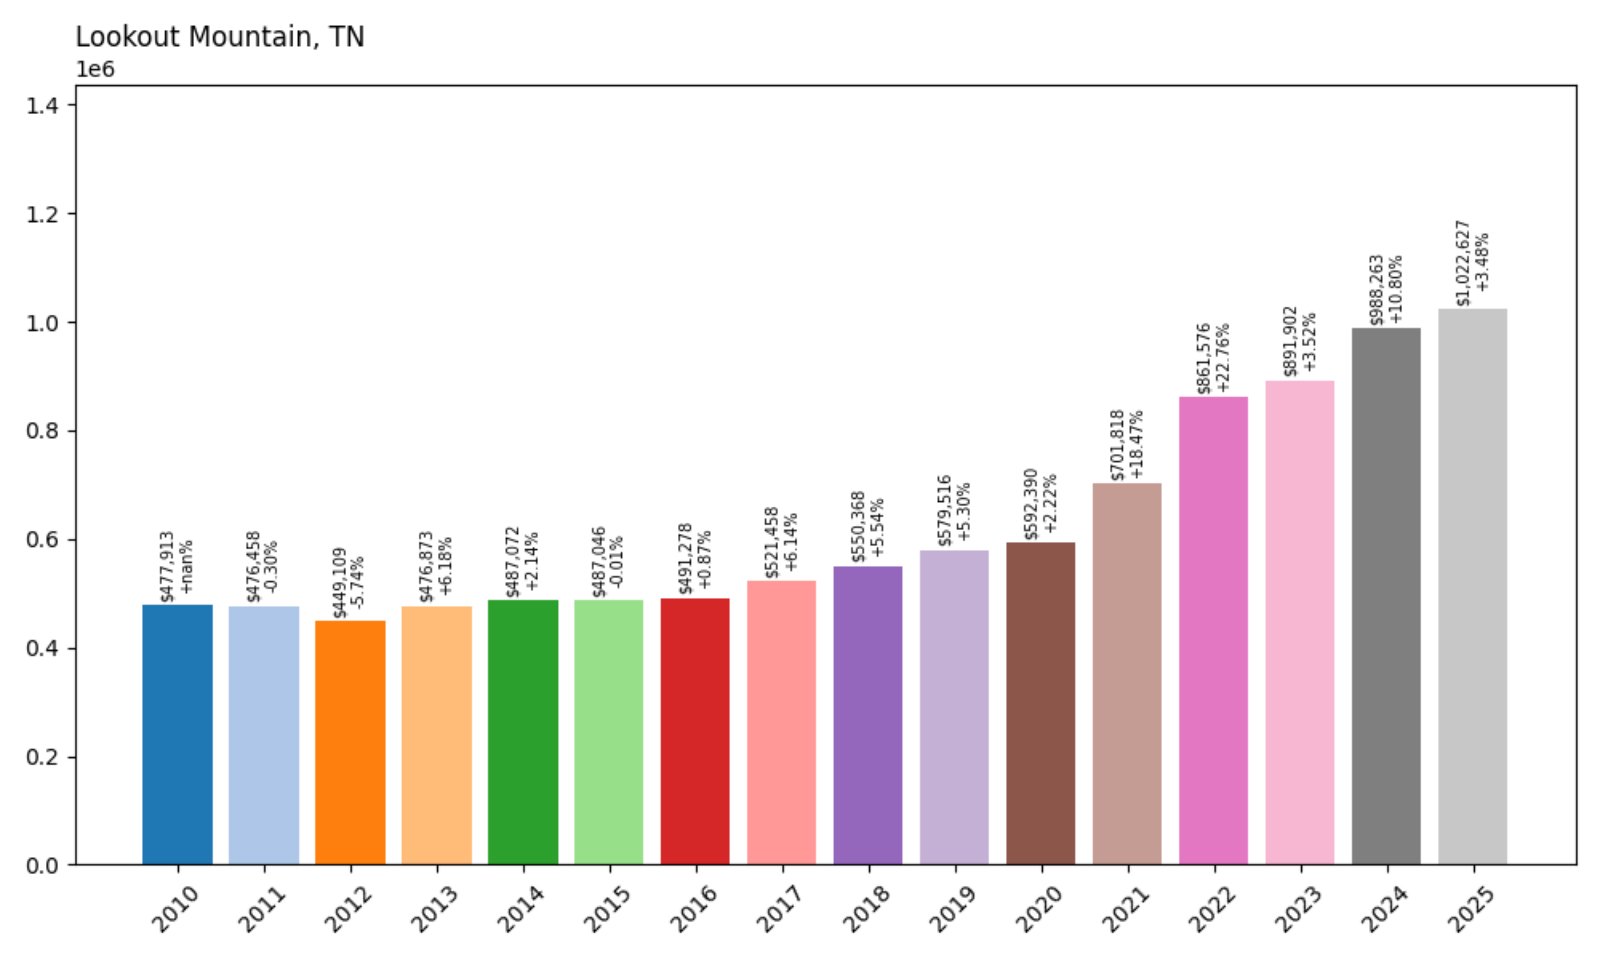
4. Lookout Mountain – 114% Home Price Increase Since 2010
- 2010: $477,913
- 2011: $476,458 (−$1,455, −0.30% from previous year)
- 2012: $449,109 (−$27,349, −5.74% from previous year)
- 2013: $476,873 (+$27,764, +6.18% from previous year)
- 2014: $487,072 (+$10,199, +2.14% from previous year)
- 2015: $487,046 (−$26, −0.01% from previous year)
- 2016: $491,278 (+$4,232, +0.87% from previous year)
- 2017: $521,458 (+$30,180, +6.14% from previous year)
- 2018: $550,368 (+$28,910, +5.54% from previous year)
- 2019: $579,516 (+$29,148, +5.30% from previous year)
- 2020: $592,390 (+$12,874, +2.22% from previous year)
- 2021: $701,818 (+$109,428, +18.47% from previous year)
- 2022: $861,576 (+$159,758, +22.76% from previous year)
- 2023: $891,902 (+$30,326, +3.52% from previous year)
- 2024: $988,263 (+$96,361, +10.80% from previous year)
- 2025: $1,022,627 (+$34,365, +3.48% from previous year)
Lookout Mountain’s values jumped from $477K in 2010 to over $1 million by 2025. This scenic town saw particularly large gains during the pandemic boom, with price increases topping 40% in just two years. Despite some slowdowns, the trend remains firmly upward.
Lookout Mountain – Scenic Prestige Above the Clouds
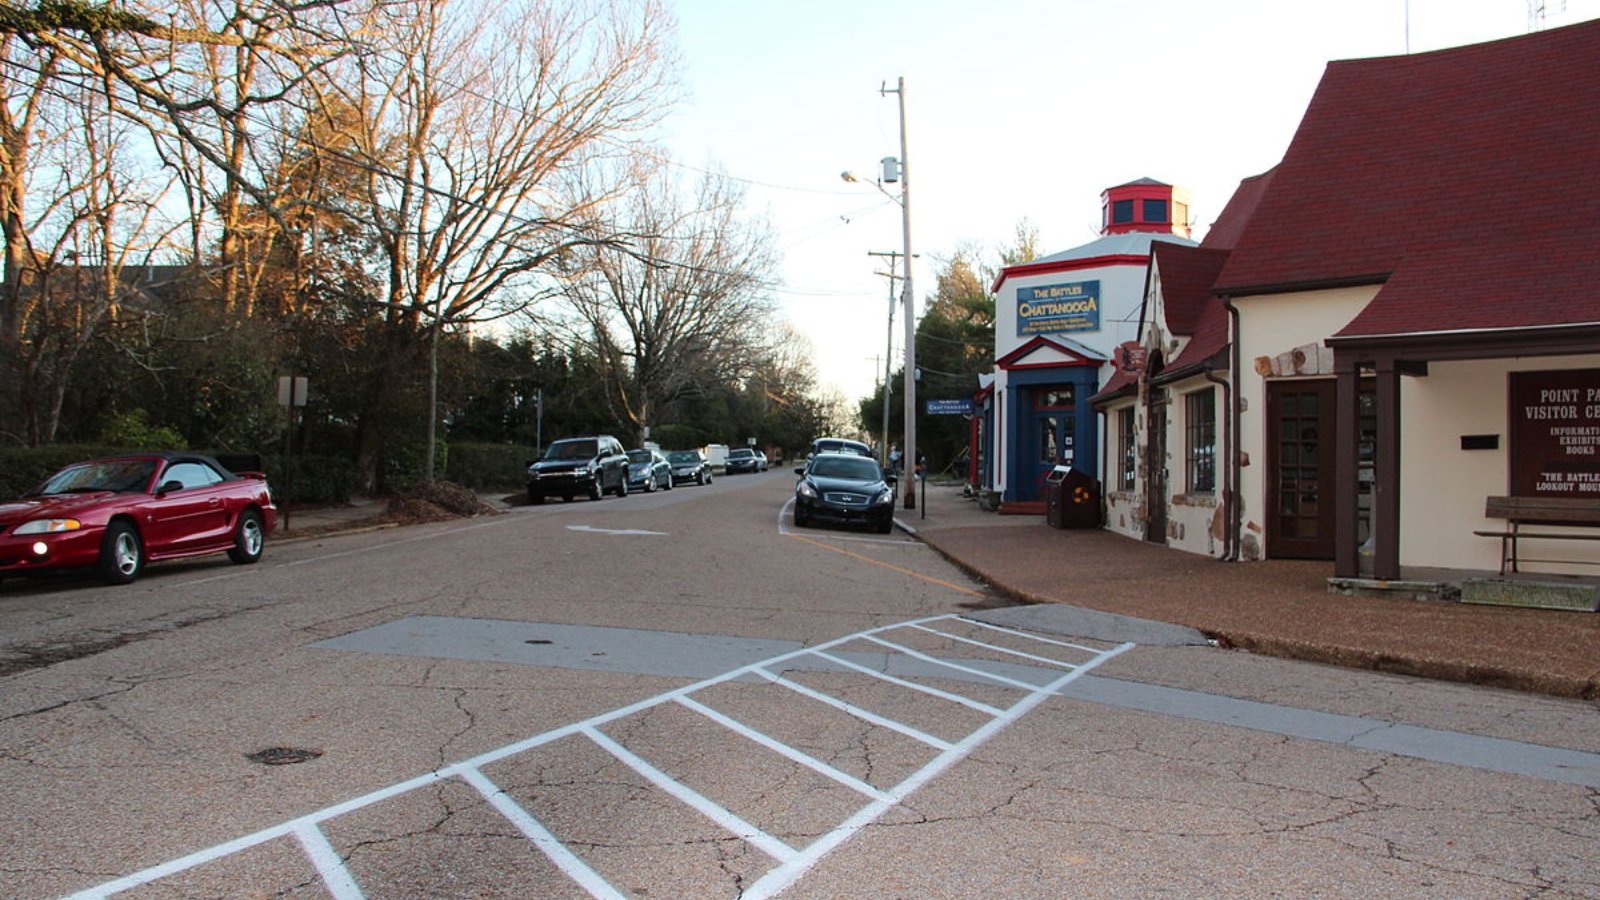
Perched high above Chattanooga, Lookout Mountain offers breathtaking views, a cooler climate, and exclusivity. Its real estate market benefits from a unique mix of historic homes, prestige schools, and proximity to national parks and trails.
The town’s limited supply and topography naturally restrict new development, driving long-term value. Despite early 2010s fluctuations, strong demand and luxury appeal have pushed prices consistently higher. With 2025 prices now above $1 million, Lookout Mountain ranks among Tennessee’s most elite enclaves.
3. Arrington – 226% Home Price Increase Since 2010
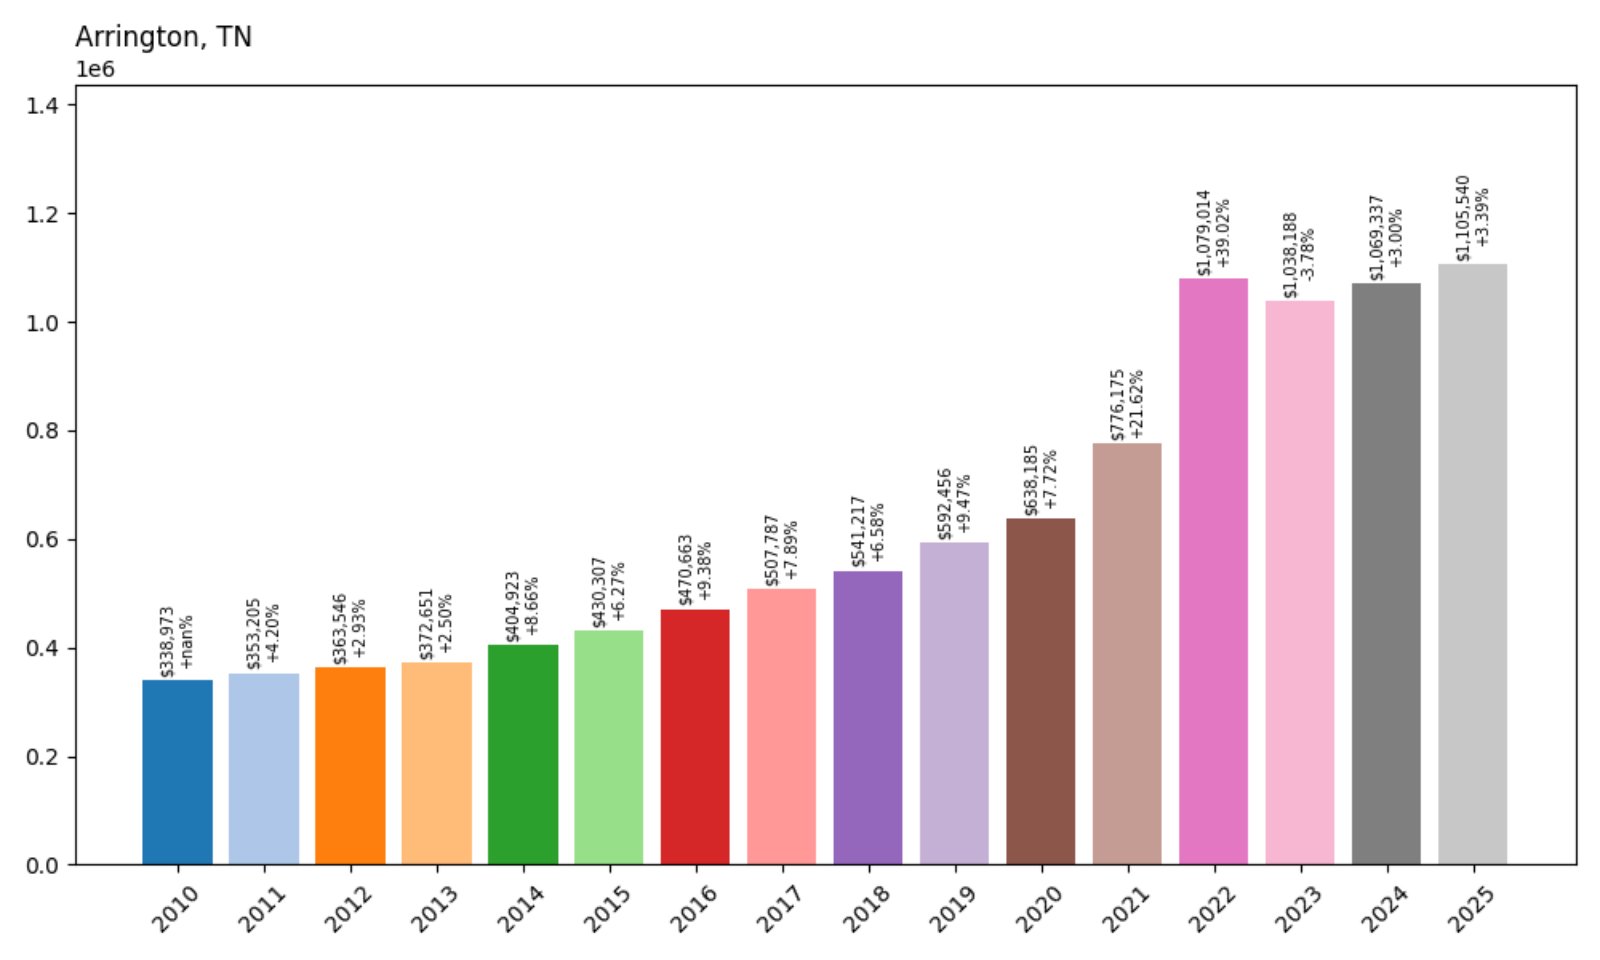
- 2010: $338,973
- 2011: $353,205 (+$14,232, +4.20% from previous year)
- 2012: $363,546 (+$10,341, +2.93% from previous year)
- 2013: $372,651 (+$9,105, +2.50% from previous year)
- 2014: $404,923 (+$32,273, +8.66% from previous year)
- 2015: $430,307 (+$25,384, +6.27% from previous year)
- 2016: $470,663 (+$40,356, +9.38% from previous year)
- 2017: $507,787 (+$37,124, +7.89% from previous year)
- 2018: $541,217 (+$33,430, +6.58% from previous year)
- 2019: $592,456 (+$51,239, +9.47% from previous year)
- 2020: $638,185 (+$45,729, +7.72% from previous year)
- 2021: $776,175 (+$137,990, +21.62% from previous year)
- 2022: $1,079,014 (+$302,838, +39.02% from previous year)
- 2023: $1,038,188 (−$40,826, −3.78% from previous year)
- 2024: $1,069,337 (+$31,149, +3.00% from previous year)
- 2025: $1,105,540 (+$36,203, +3.39% from previous year)
Arrington has seen a dramatic 226% price increase since 2010, topping $1.1 million in 2025. The town experienced its fastest growth from 2020–2022, with a massive 39% leap in 2022 alone. A brief decline followed, but values have since rebounded steadily.
Arrington – Big Acreage and Even Bigger Demand
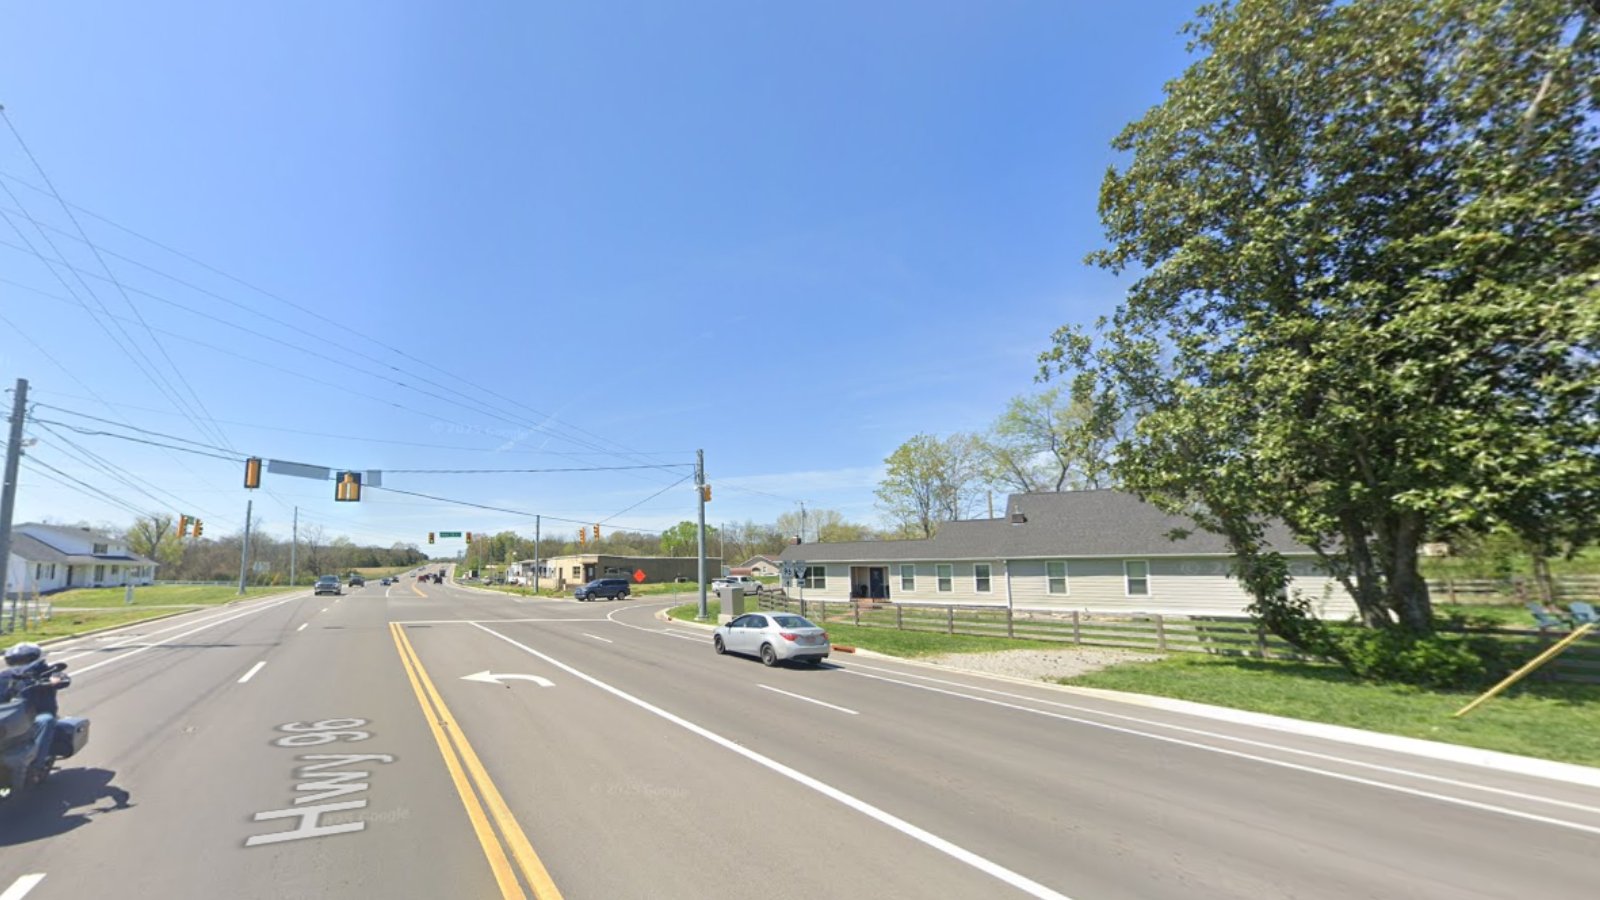
Arrington sits in southern Williamson County, where sprawling horse farms and vineyards define the landscape. Once largely rural, the town has drawn high-end residential development in recent years, attracting buyers seeking land, privacy, and space.
Its rise in home prices reflects a luxury niche market—often custom-built estates on large lots. With limited inventory and strong lifestyle appeal, Arrington continues to command high prices despite wider market slowdowns.
2. College Grove – 259% Home Price Increase Since 2010
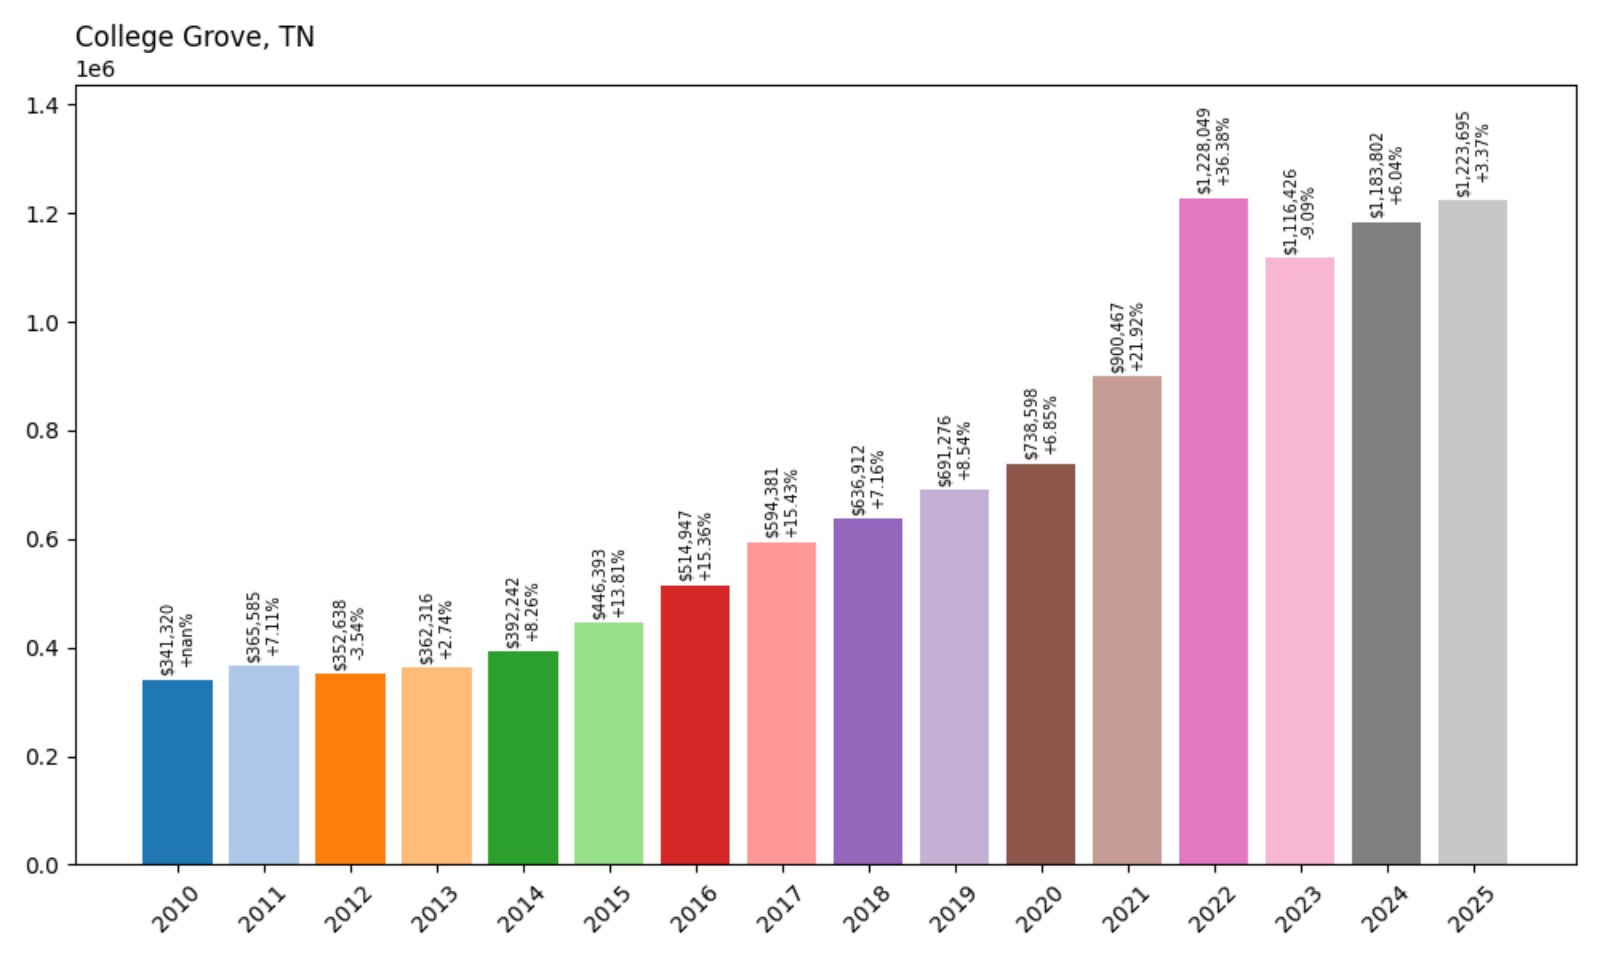
- 2010: $341,320
- 2011: $365,585 (+$24,265, +7.11% from previous year)
- 2012: $352,638 (−$12,948, −3.54% from previous year)
- 2013: $362,316 (+$9,678, +2.74% from previous year)
- 2014: $392,242 (+$29,926, +8.26% from previous year)
- 2015: $446,393 (+$54,151, +13.81% from previous year)
- 2016: $514,947 (+$68,554, +15.36% from previous year)
- 2017: $594,381 (+$79,434, +15.43% from previous year)
- 2018: $636,912 (+$42,531, +7.16% from previous year)
- 2019: $691,276 (+$54,364, +8.54% from previous year)
- 2020: $738,598 (+$47,322, +6.85% from previous year)
- 2021: $900,467 (+$161,869, +21.92% from previous year)
- 2022: $1,228,049 (+$327,582, +36.38% from previous year)
- 2023: $1,116,426 (−$111,623, −9.09% from previous year)
- 2024: $1,183,802 (+$67,377, +6.04% from previous year)
- 2025: $1,223,695 (+$39,893, +3.37% from previous year)
College Grove has seen a 259% increase in home values since 2010, climbing from $341K to over $1.22 million in 2025. Though there was a notable dip in 2023, values have regained momentum. The area remains one of Tennessee’s most sought-after luxury markets.
College Grove – Country Estates With Modern Appeal
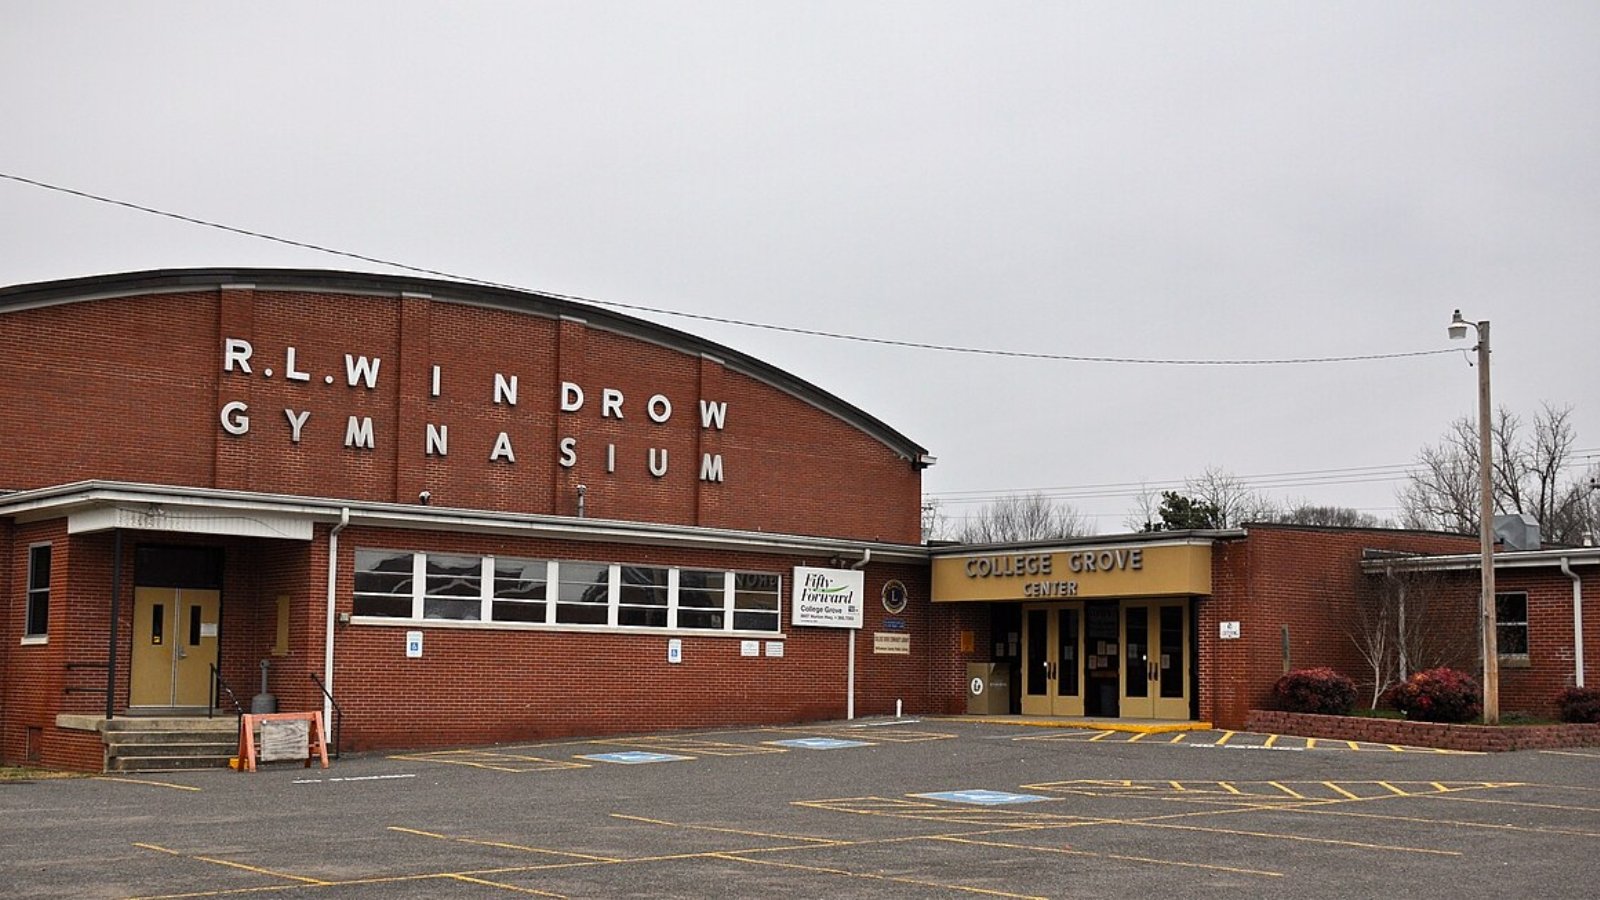
Located in Williamson County, College Grove blends rolling farmland with master-planned luxury communities like The Grove and Falls Grove. It’s popular with executives, athletes, and celebrities looking for privacy outside Nashville.
High-end golf courses, gated communities, and expansive properties fuel its high valuations. While demand dipped slightly in 2023, it’s now rebounding alongside broader recovery trends. In 2025, average home values exceed $1.2 million—among the highest in the state.
1. Brentwood – 170% Home Price Increase Since 2010
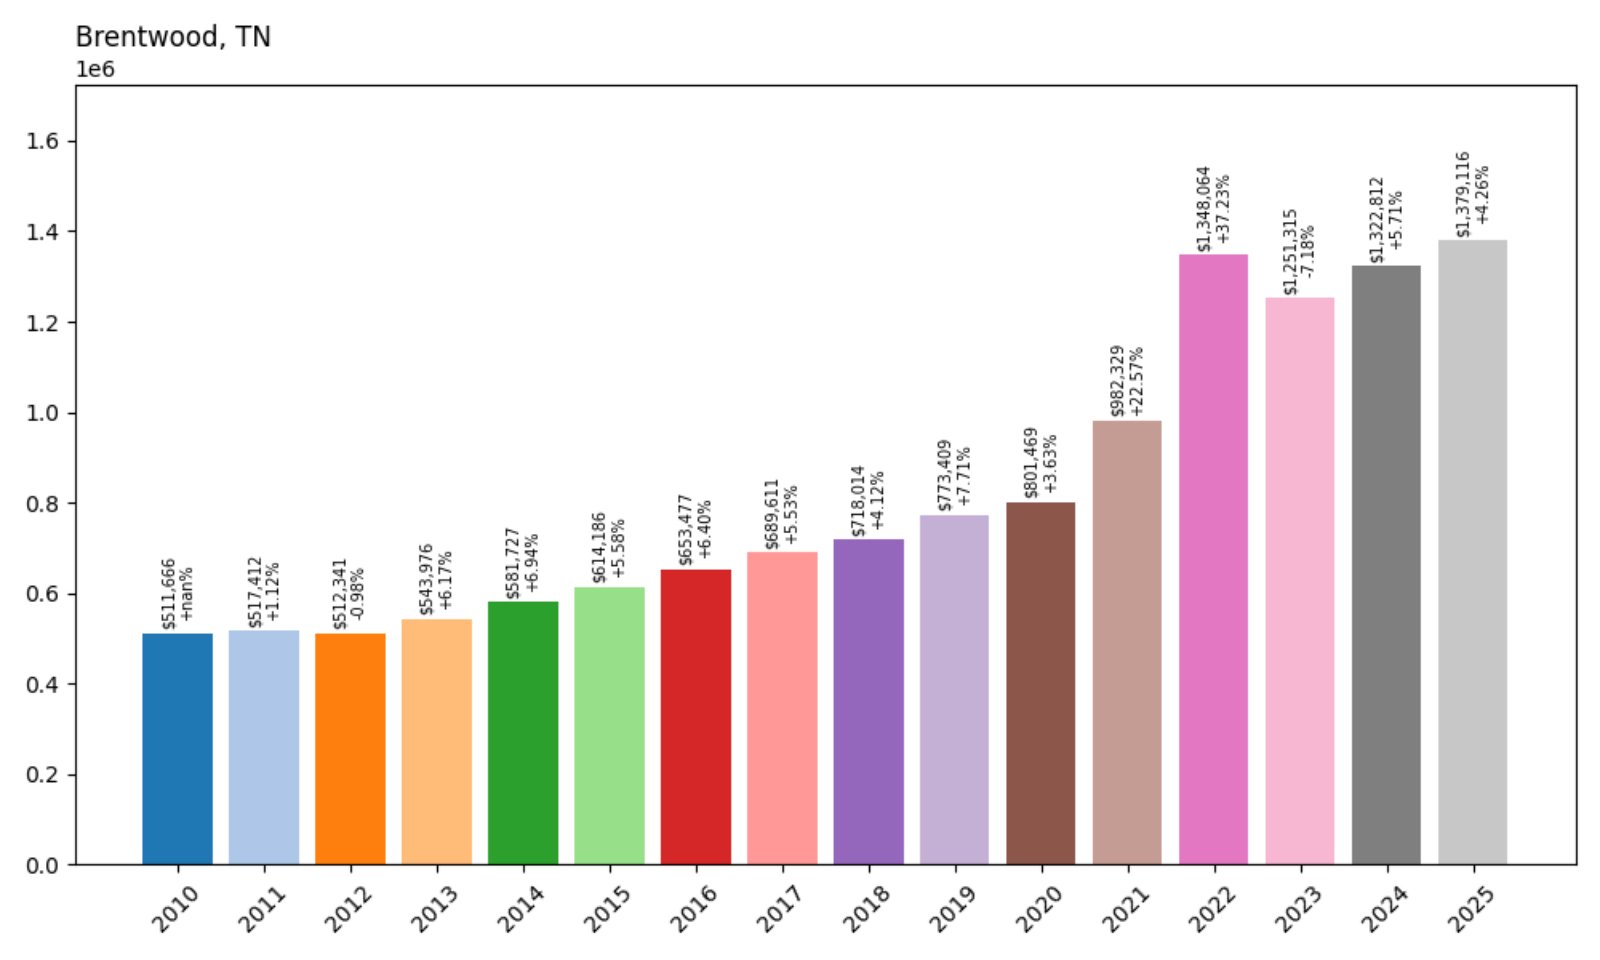
- 2010: $511,666
- 2011: $517,412 (+$5,747, +1.12% from previous year)
- 2012: $512,341 (−$5,072, −0.98% from previous year)
- 2013: $543,976 (+$31,635, +6.17% from previous year)
- 2014: $581,727 (+$37,751, +6.94% from previous year)
- 2015: $614,186 (+$32,459, +5.58% from previous year)
- 2016: $653,477 (+$39,291, +6.40% from previous year)
- 2017: $689,611 (+$36,134, +5.53% from previous year)
- 2018: $718,014 (+$28,403, +4.12% from previous year)
- 2019: $773,409 (+$55,394, +7.71% from previous year)
- 2020: $801,469 (+$28,061, +3.63% from previous year)
- 2021: $982,329 (+$180,860, +22.57% from previous year)
- 2022: $1,348,064 (+$365,735, +37.23% from previous year)
- 2023: $1,251,315 (−$96,750, −7.18% from previous year)
- 2024: $1,322,812 (+$71,498, +5.71% from previous year)
- 2025: $1,379,116 (+$56,303, +4.26% from previous year)
Brentwood tops the list with a staggering home value of over $1.37 million in 2025. That’s a 170% jump from 2010. Though the market cooled in 2023, it’s regained traction with two straight years of growth.
Brentwood – Tennessee’s Pinnacle of Prestige
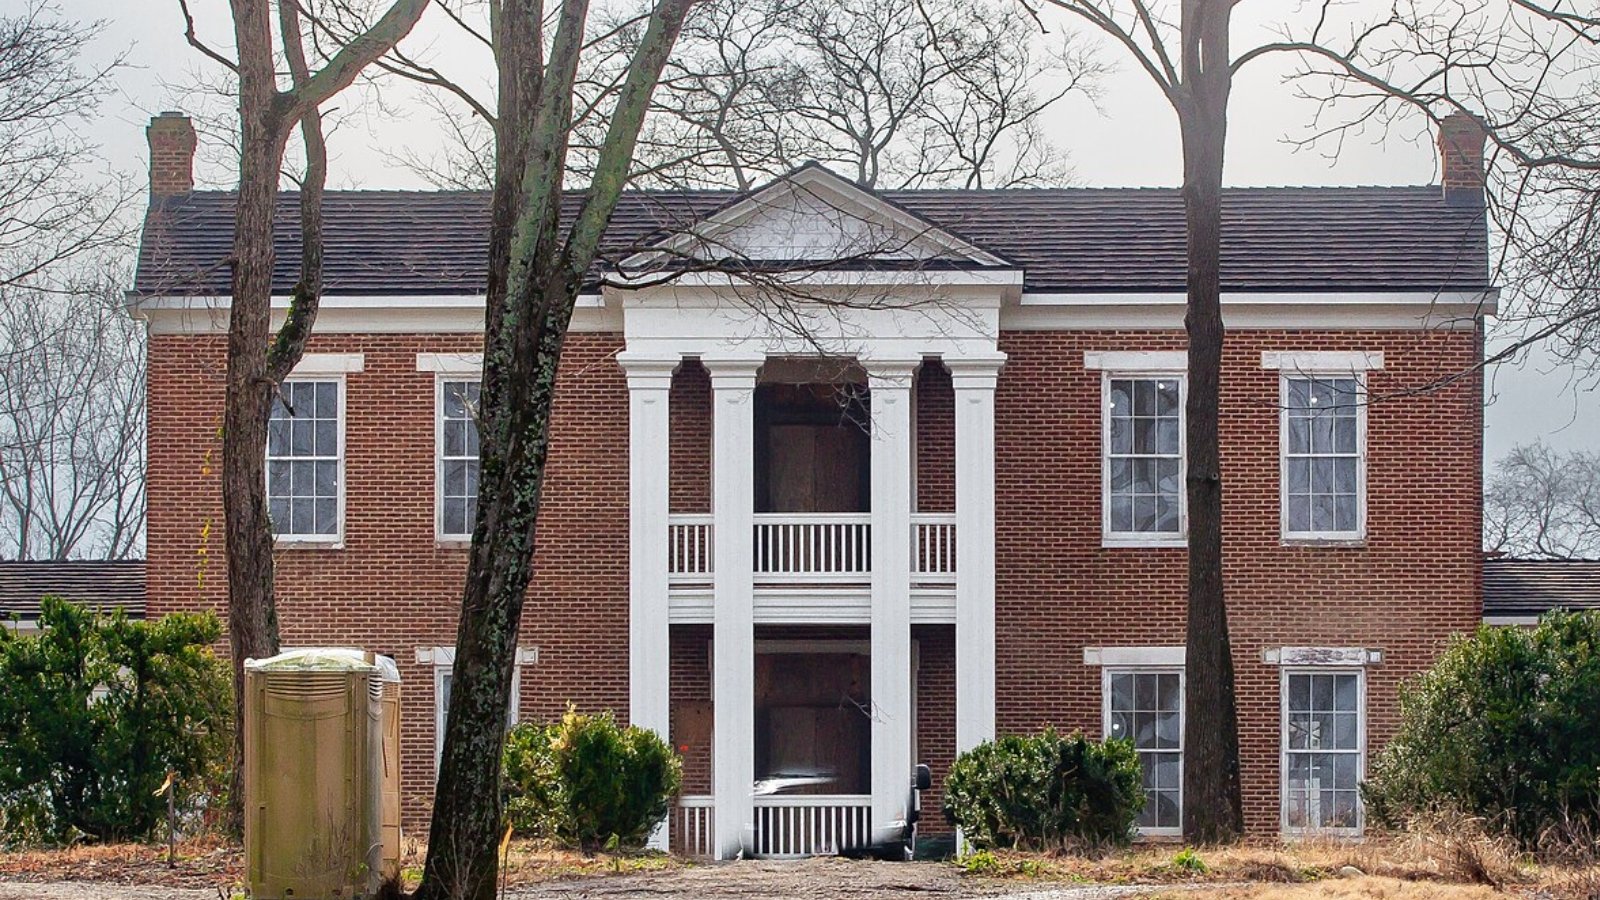
Brentwood is the crown jewel of suburban Nashville, known for its stately homes, elite schools, and immaculate parks. It’s a corporate and residential powerhouse, home to executives, athletes, and entertainers.
The housing boom during 2020–2022 propelled values into the seven-figure range. Even as other markets slowed, Brentwood’s fundamentals remain rock-solid. With rising construction standards and enduring demand, it leads Tennessee in both price and reputation.


