If it feels like Nevada housing prices are rising faster than a Vegas jackpot, you’re not wrong. According to the Zillow Home Value Index, 18 towns across the Silver State are outpacing the rest, posting rapid price growth through May 2025. These aren’t just big cities, either—some of the fastest climbers are small towns where demand is suddenly booming. Whether it’s new development, investor interest, or a fresh wave of out-of-state buyers, something is clearly driving the surge. The price tags are rising—fast—and this list shows where it’s happening the quickest.
18. Dayton – 203% Home Price Increase Since 2010
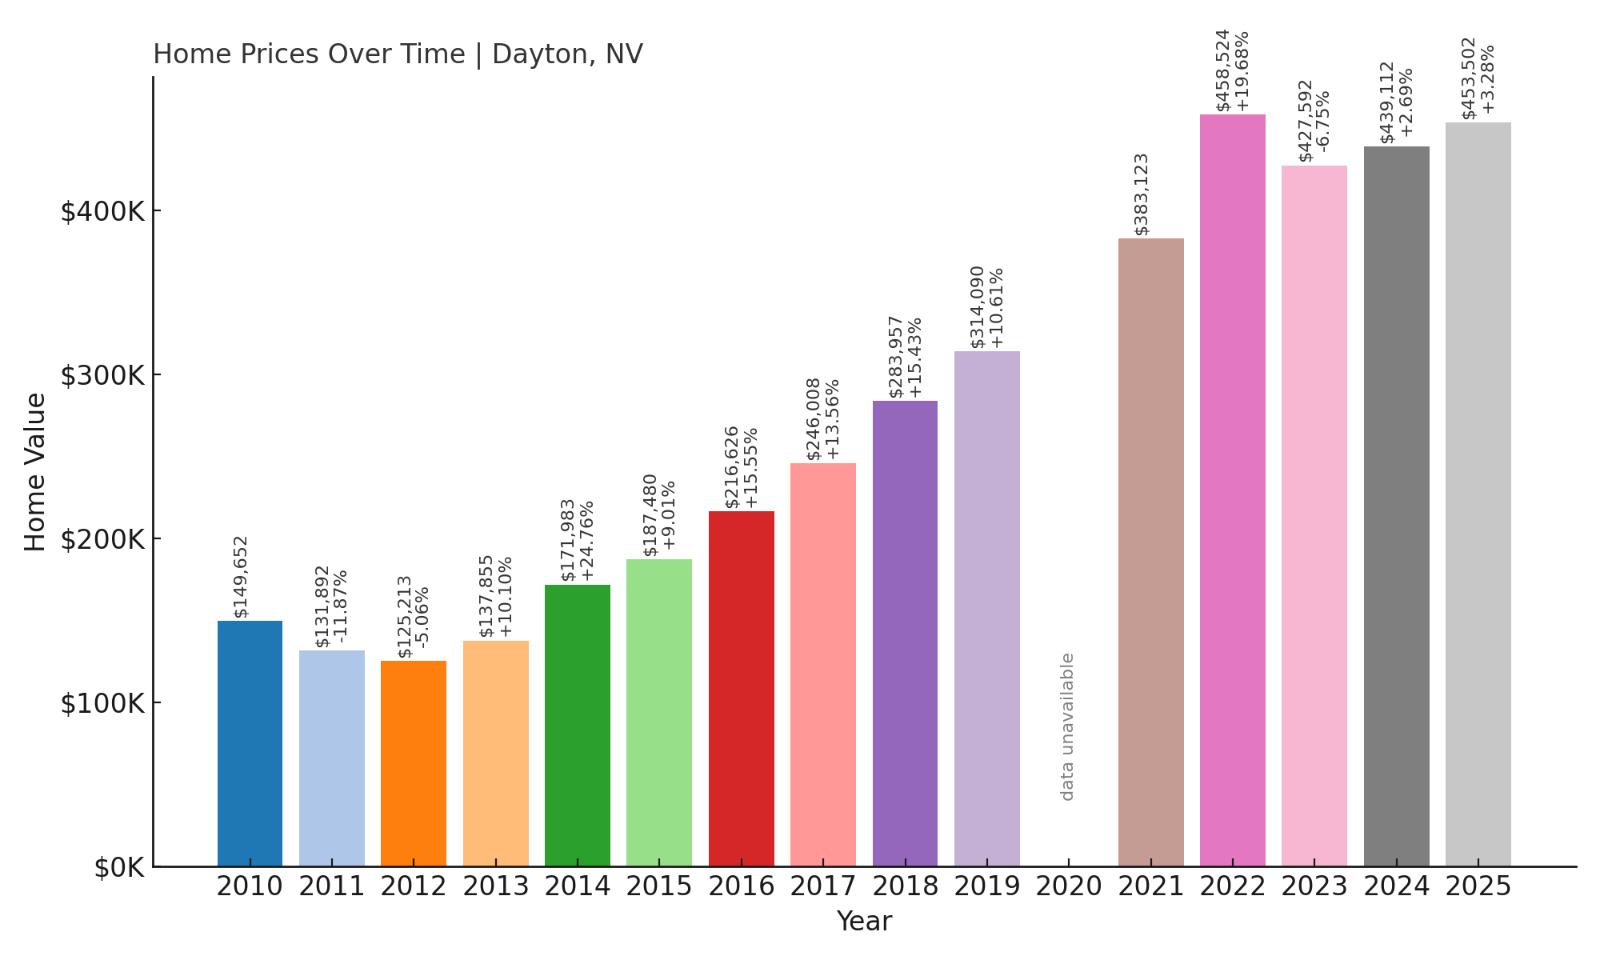
- 2010: $149,652
- 2011: $131,892 (-$17,759, -11.87% from previous year)
- 2012: $125,213 (-$6,679, -5.06% from previous year)
- 2013: $137,855 (+$12,642, +10.10% from previous year)
- 2014: $171,983 (+$34,128, +24.76% from previous year)
- 2015: $187,480 (+$15,497, +9.01% from previous year)
- 2016: $216,626 (+$29,146, +15.55% from previous year)
- 2017: $246,008 (+$29,383, +13.56% from previous year)
- 2018: $283,957 (+$37,949, +15.43% from previous year)
- 2019: $314,090 (+$30,133, +10.61% from previous year)
- 2021: $383,123
- 2022: $458,524 (+$75,401, +19.68% from previous year)
- 2023: $427,592 (-$30,932, -6.75% from previous year)
- 2024: $439,112 (+$11,519, +2.69% from previous year)
- 2025: $453,502 (+$14,391, +3.28% from previous year)
Dayton’s home prices have climbed from under $150K in 2010 to over $450K in 2025—a rise of more than 200%. The sharpest growth came between 2013 and 2019, with strong double-digit increases. Even after a brief dip in 2023, values are climbing again, showing solid long-term momentum.
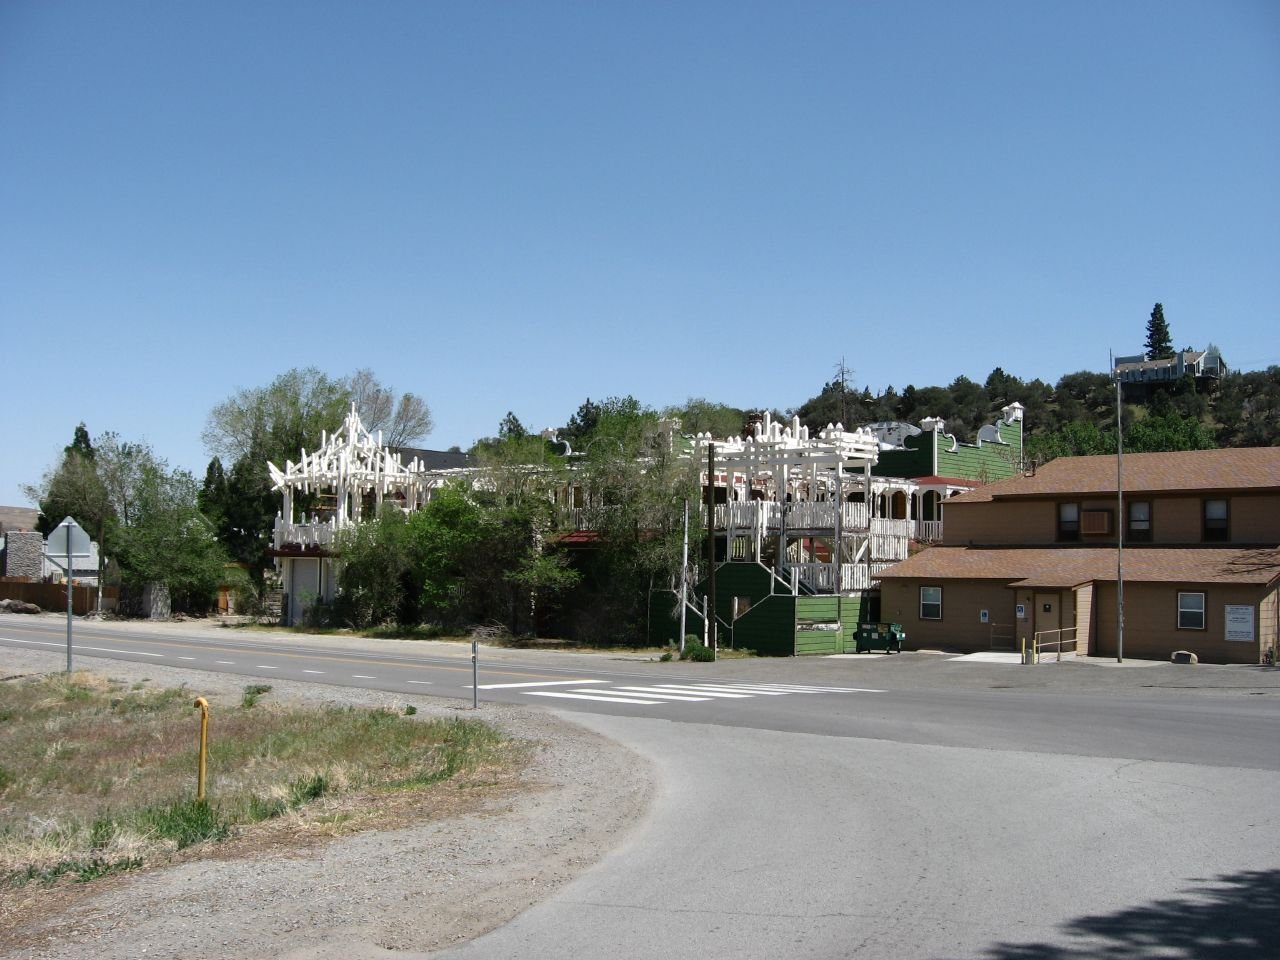
Dayton – Affordable Alternative Near Carson City
Located just east of Carson City, Dayton offers a more accessible housing market for buyers priced out of bigger cities. Its historic roots as one of Nevada’s oldest settlements give it a small-town feel, while new developments have brought modern amenities. Proximity to Reno and Lake Tahoe makes it appealing for commuters and retirees alike.
Price growth here reflects rising demand from those seeking affordability without sacrificing access to jobs or recreation. Dayton’s schools, community services, and expanding housing stock have helped fuel continued interest, even as other markets cool slightly.
17. Boulder City – 105% Home Price Increase Since 2010
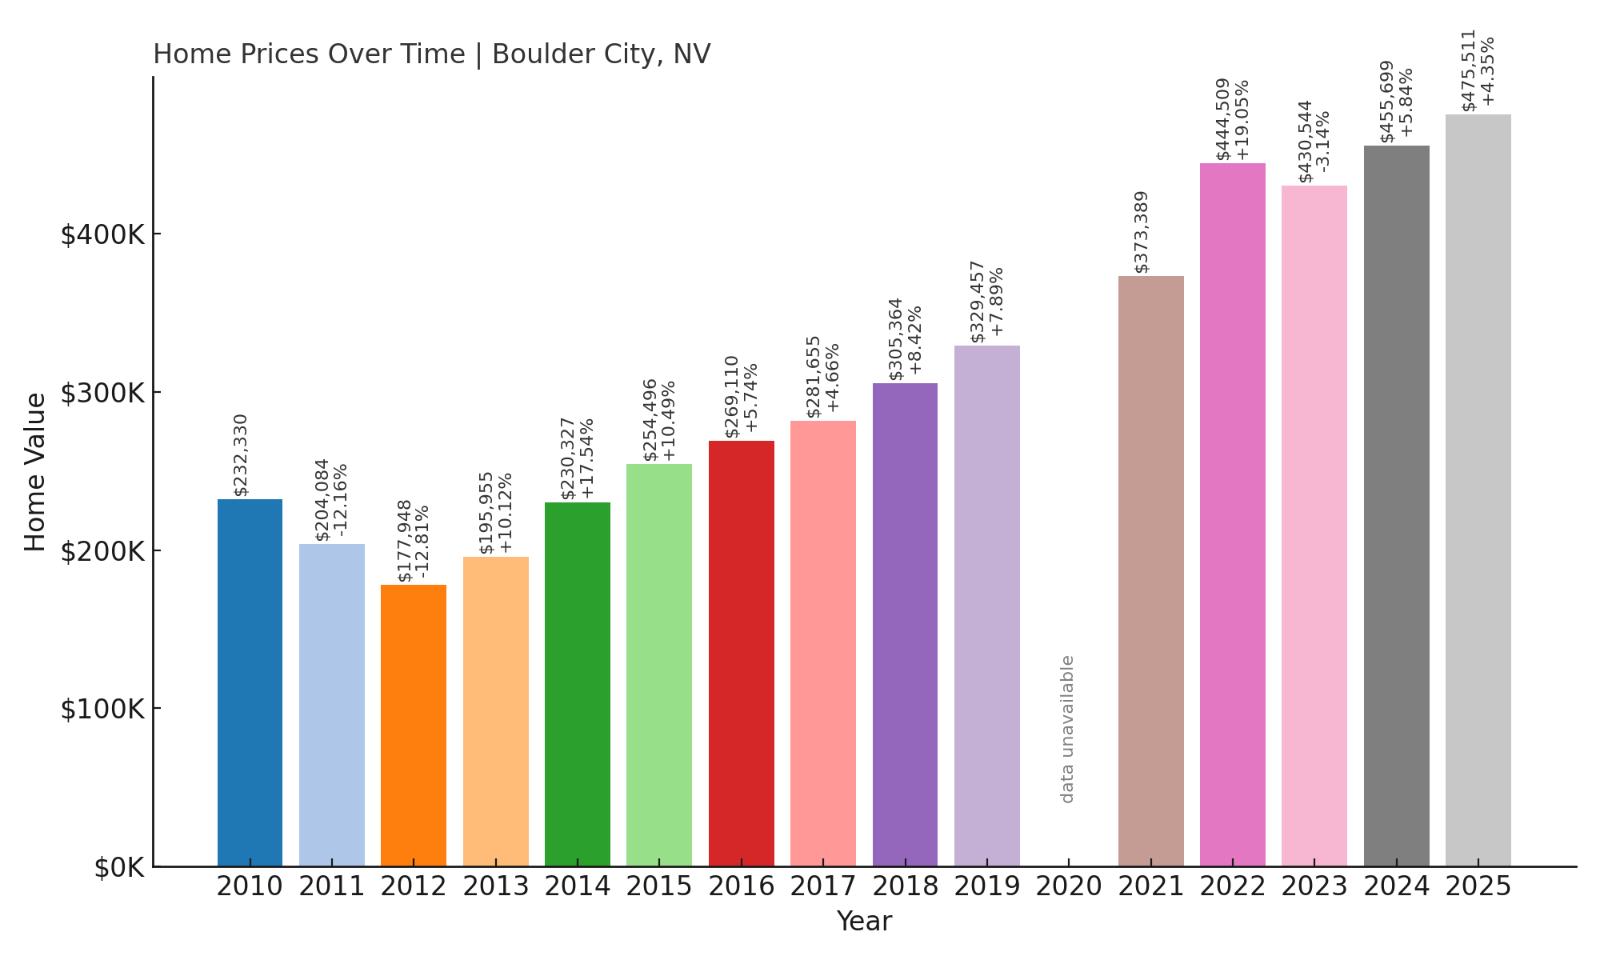
- 2010: $232,330
- 2011: $204,084 (-$28,245, -12.16% from previous year)
- 2012: $177,948 (-$26,136, -12.81% from previous year)
- 2013: $195,955 (+$18,007, +10.12% from previous year)
- 2014: $230,327 (+$34,372, +17.54% from previous year)
- 2015: $254,496 (+$24,169, +10.49% from previous year)
- 2016: $269,110 (+$14,614, +5.74% from previous year)
- 2017: $281,655 (+$12,545, +4.66% from previous year)
- 2018: $305,364 (+$23,709, +8.42% from previous year)
- 2019: $329,457 (+$24,093, +7.89% from previous year)
- 2021: $373,389
- 2022: $444,509 (+$71,120, +19.05% from previous year)
- 2023: $430,544 (-$13,965, -3.14% from previous year)
- 2024: $455,699 (+$25,155, +5.84% from previous year)
- 2025: $475,511 (+$19,812, +4.35% from previous year)
Home prices in Boulder City have more than doubled since 2010, with a notable surge between 2012 and 2015. While there were minor pullbacks in 2023, overall trends remain positive—especially in 2024 and 2025, which saw steady single-digit increases.
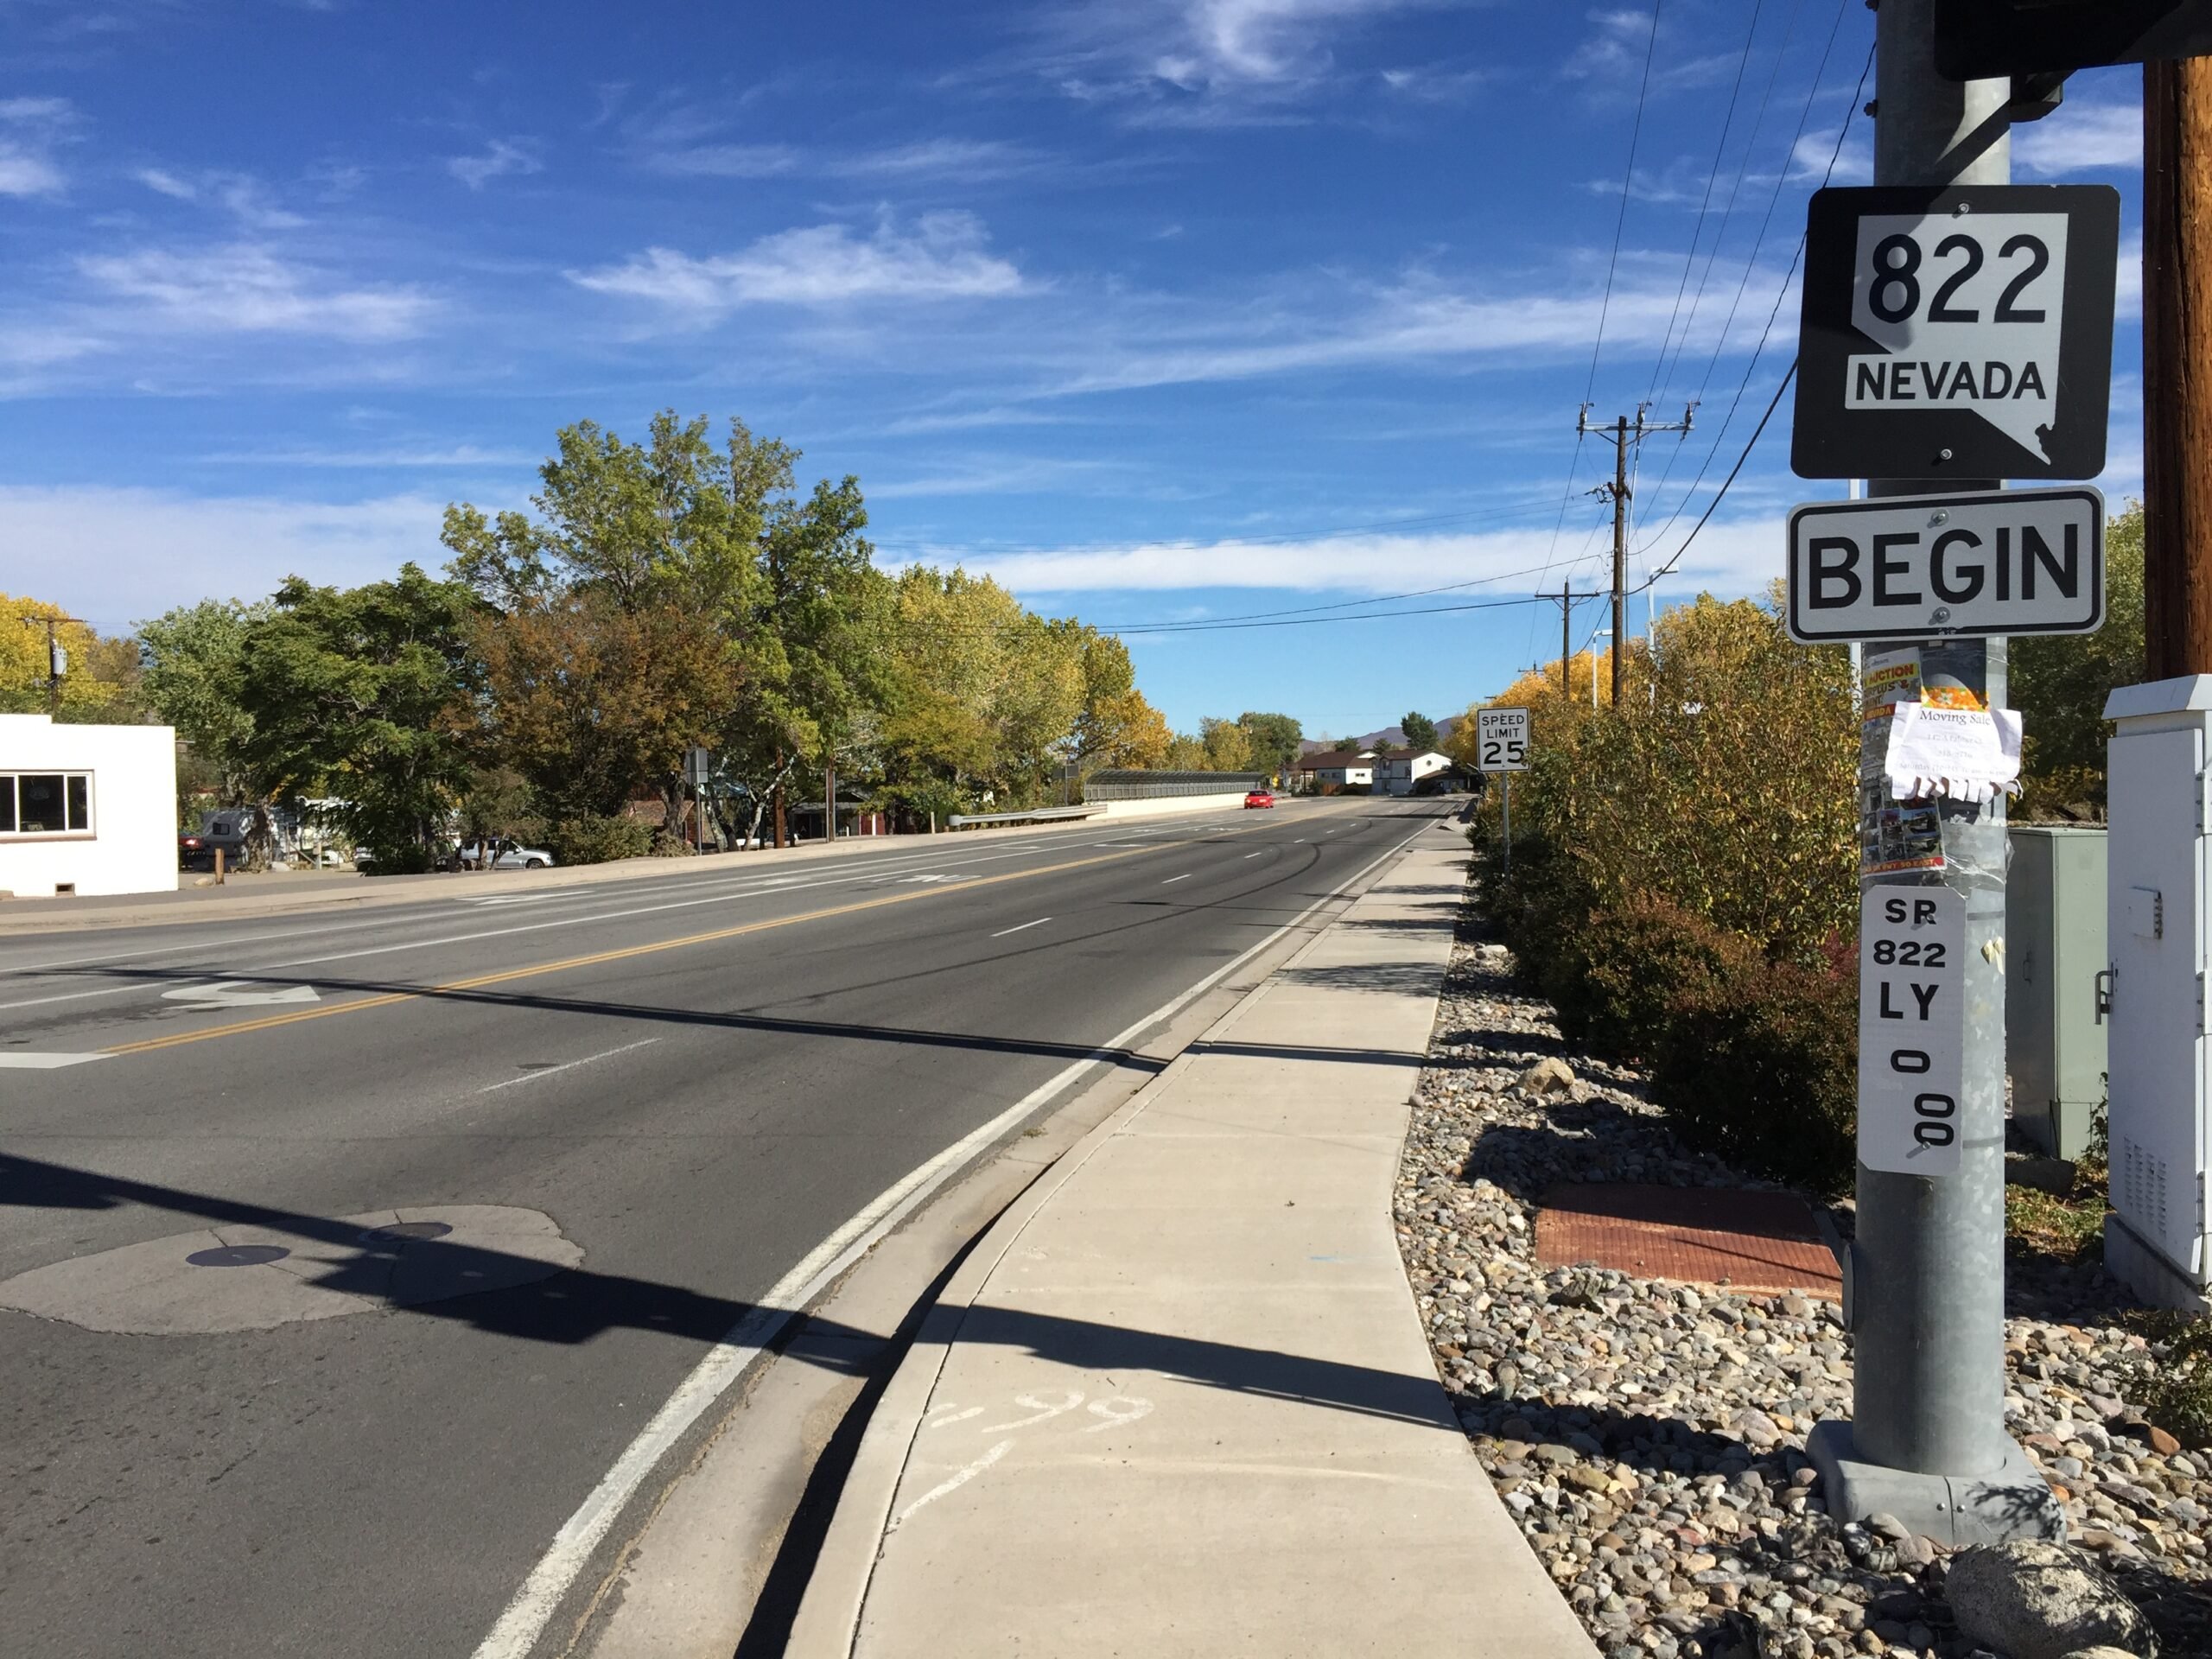
Boulder City – Lake Proximity Drives Demand

Perched near Lake Mead and just a short drive from Las Vegas, Boulder City attracts buyers looking for natural beauty and a slower pace. Strict building codes and limited development keep supply tight, which helps support property values over time.
With historic charm, outdoor recreation, and a strong sense of community, Boulder City has carved out a niche in Southern Nevada’s housing landscape. The city’s steady appreciation speaks to its enduring appeal for retirees and families alike.
16. Carson City – 181% Home Price Increase Since 2010

- 2010: $176,311
- 2011: $156,551 (-$19,760, -11.21% from previous year)
- 2012: $149,710 (-$6,841, -4.37% from previous year)
- 2013: $164,699 (+$14,989, +10.01% from previous year)
- 2014: $191,343 (+$26,644, +16.18% from previous year)
- 2015: $209,768 (+$18,425, +9.63% from previous year)
- 2016: $247,332 (+$37,564, +17.91% from previous year)
- 2017: $278,053 (+$30,722, +12.42% from previous year)
- 2018: $306,227 (+$28,173, +10.13% from previous year)
- 2019: $335,568 (+$29,341, +9.58% from previous year)
- 2021: $414,798
- 2022: $488,325 (+$73,527, +17.73% from previous year)
- 2023: $456,339 (-$31,986, -6.55% from previous year)
- 2024: $482,097 (+$25,758, +5.64% from previous year)
- 2025: $494,660 (+$12,564, +2.61% from previous year)
Carson City’s home prices have surged by 181% since 2010, with particularly strong growth between 2013 and 2022. A brief dip in 2023 hasn’t stopped the upward trend, with prices climbing again in 2024 and 2025.
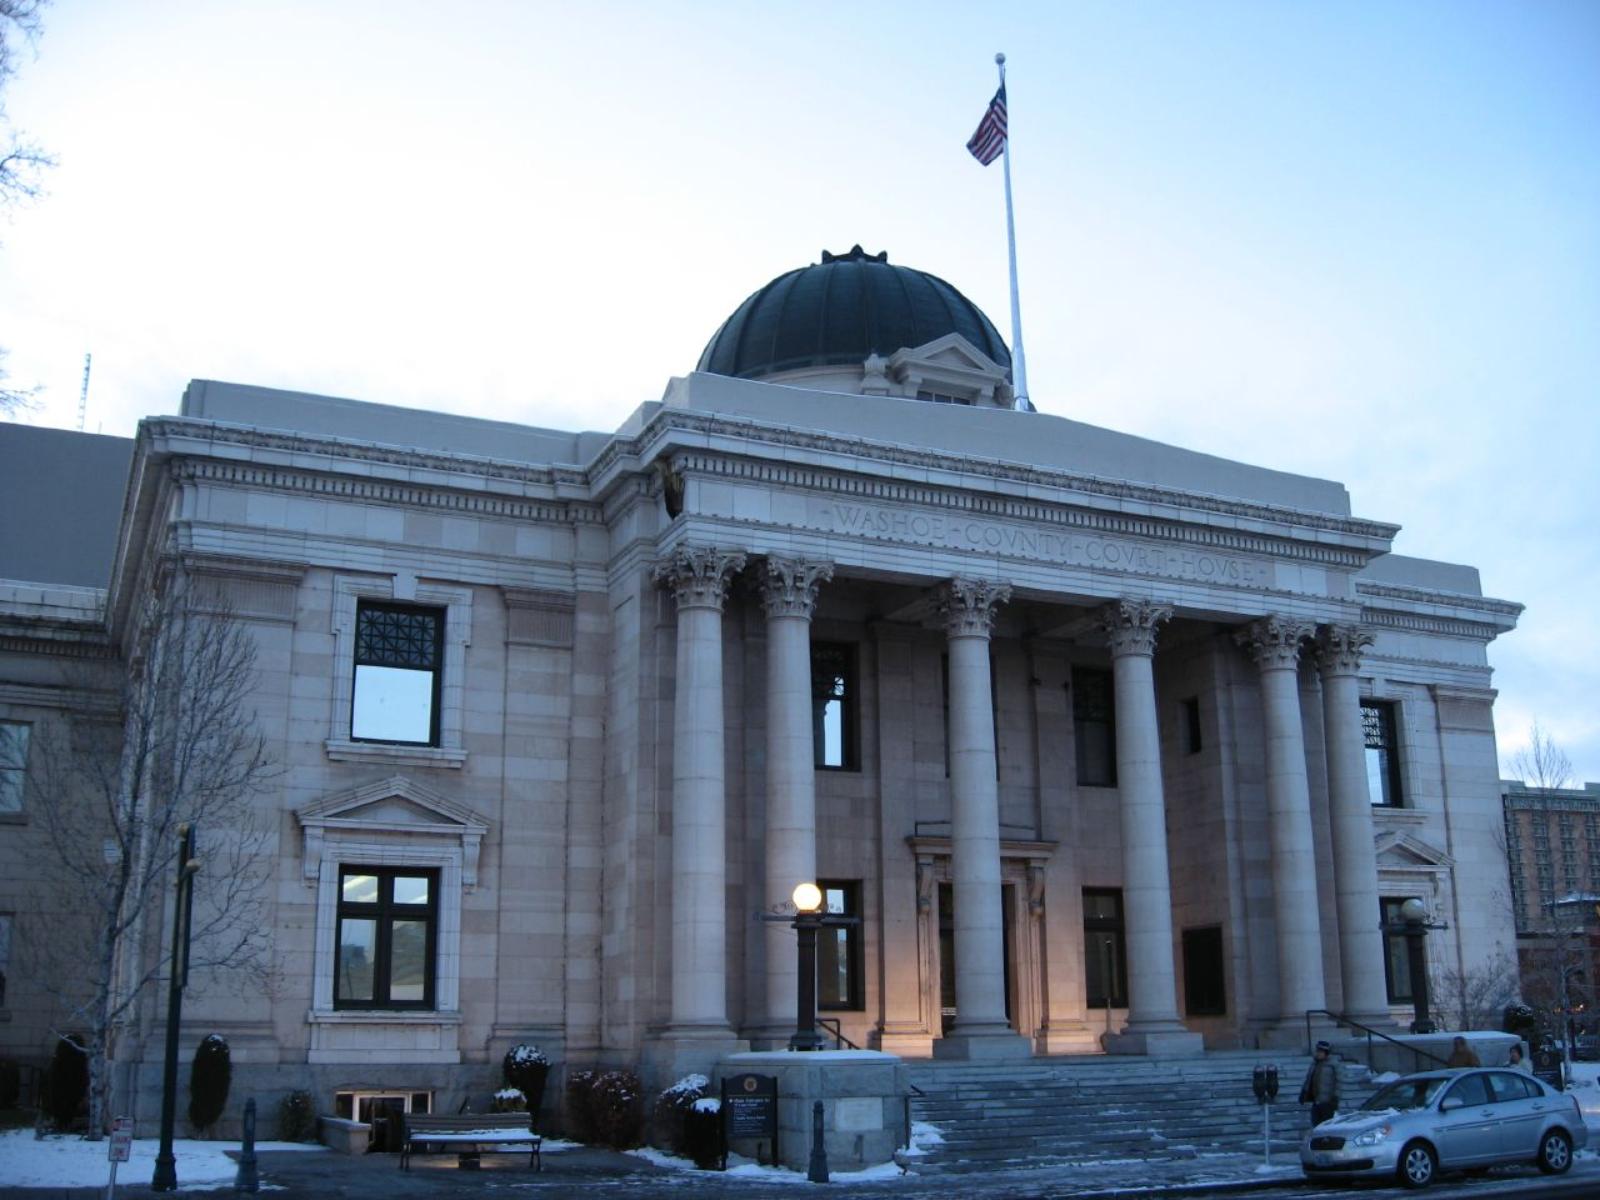
Carson City – Capital Growth Meets Affordability

As Nevada’s capital, Carson City blends government jobs, cultural amenities, and a relatively small-town atmosphere. Its location between Reno and Lake Tahoe makes it a strategic choice for professionals and nature lovers alike.
With historical charm and ongoing revitalization projects, Carson City has become more attractive in recent years. Growth in tech-related jobs and spillover from pricier markets have kept demand high and prices steadily rising.
15. Henderson – 167% Home Price Increase Since 2010
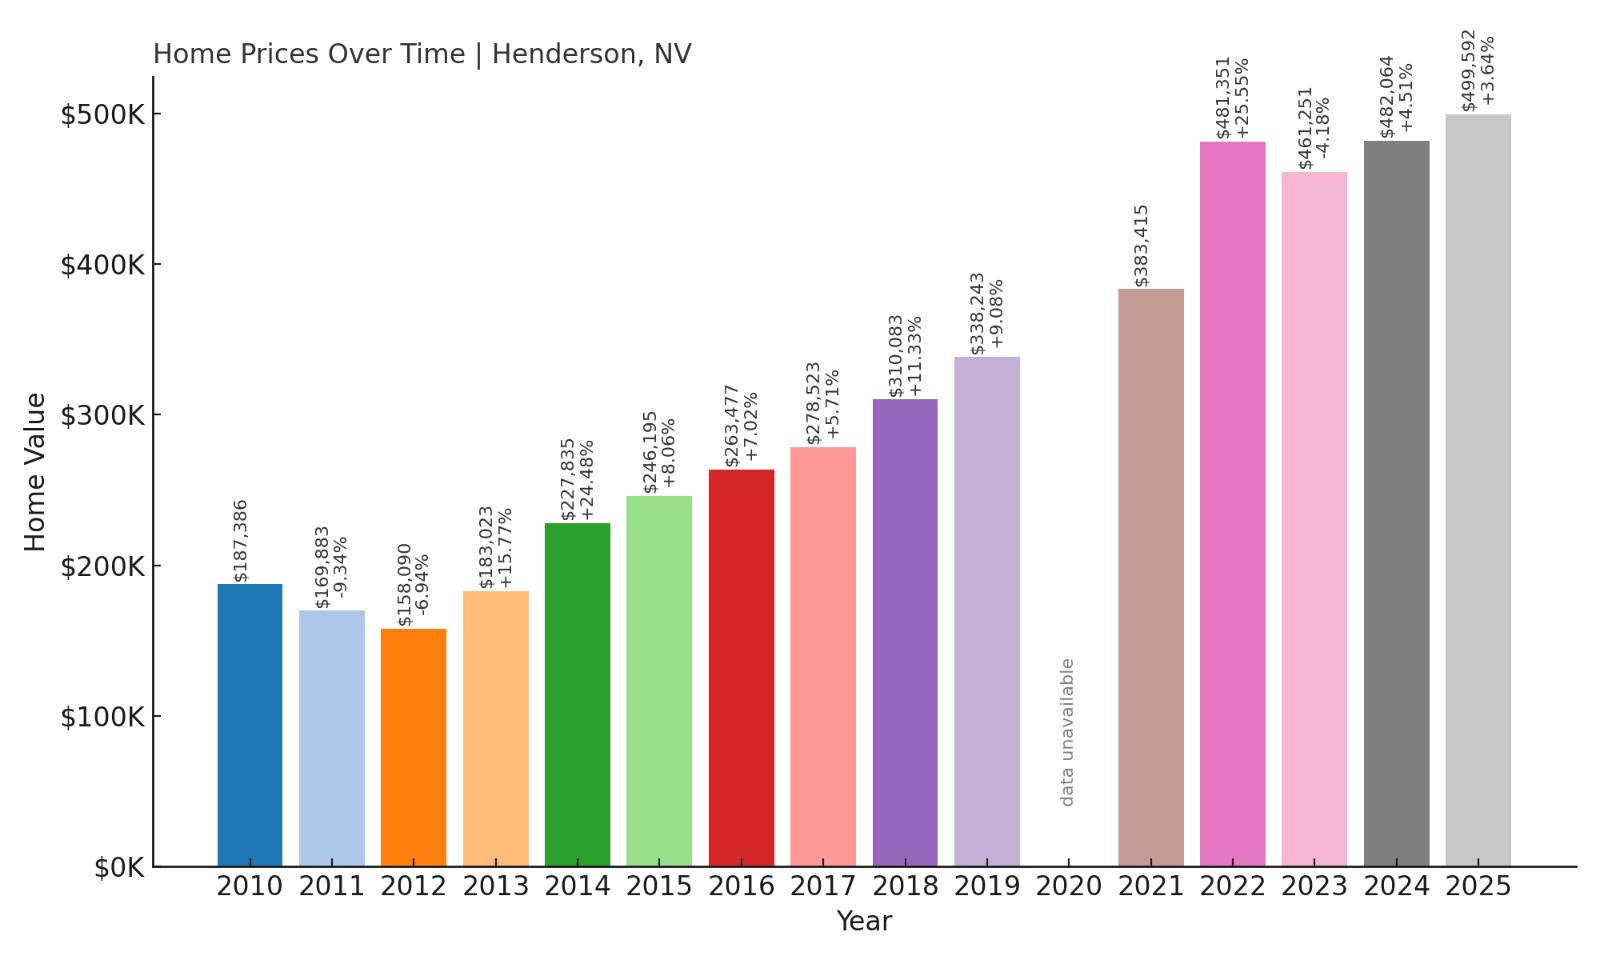
- 2010: $187,386
- 2011: $169,883 (-$17,502, -9.34% from previous year)
- 2012: $158,090 (-$11,794, -6.94% from previous year)
- 2013: $183,023 (+$24,933, +15.77% from previous year)
- 2014: $227,835 (+$44,812, +24.48% from previous year)
- 2015: $246,195 (+$18,360, +8.06% from previous year)
- 2016: $263,477 (+$17,282, +7.02% from previous year)
- 2017: $278,523 (+$15,046, +5.71% from previous year)
- 2018: $310,083 (+$31,560, +11.33% from previous year)
- 2019: $338,243 (+$28,160, +9.08% from previous year)
- 2021: $383,415
- 2022: $481,351 (+$97,936, +25.55% from previous year)
- 2023: $461,251 (-$20,100, -4.18% from previous year)
- 2024: $482,064 (+$20,813, +4.51% from previous year)
- 2025: $499,592 (+$17,528, +3.64% from previous year)
Henderson’s housing market has grown by 167% since 2010, driven by consistent demand and large year-over-year jumps, particularly in 2022. While 2023 brought a small decline, home values quickly rebounded.
Henderson – Las Vegas Suburb with Staying Power
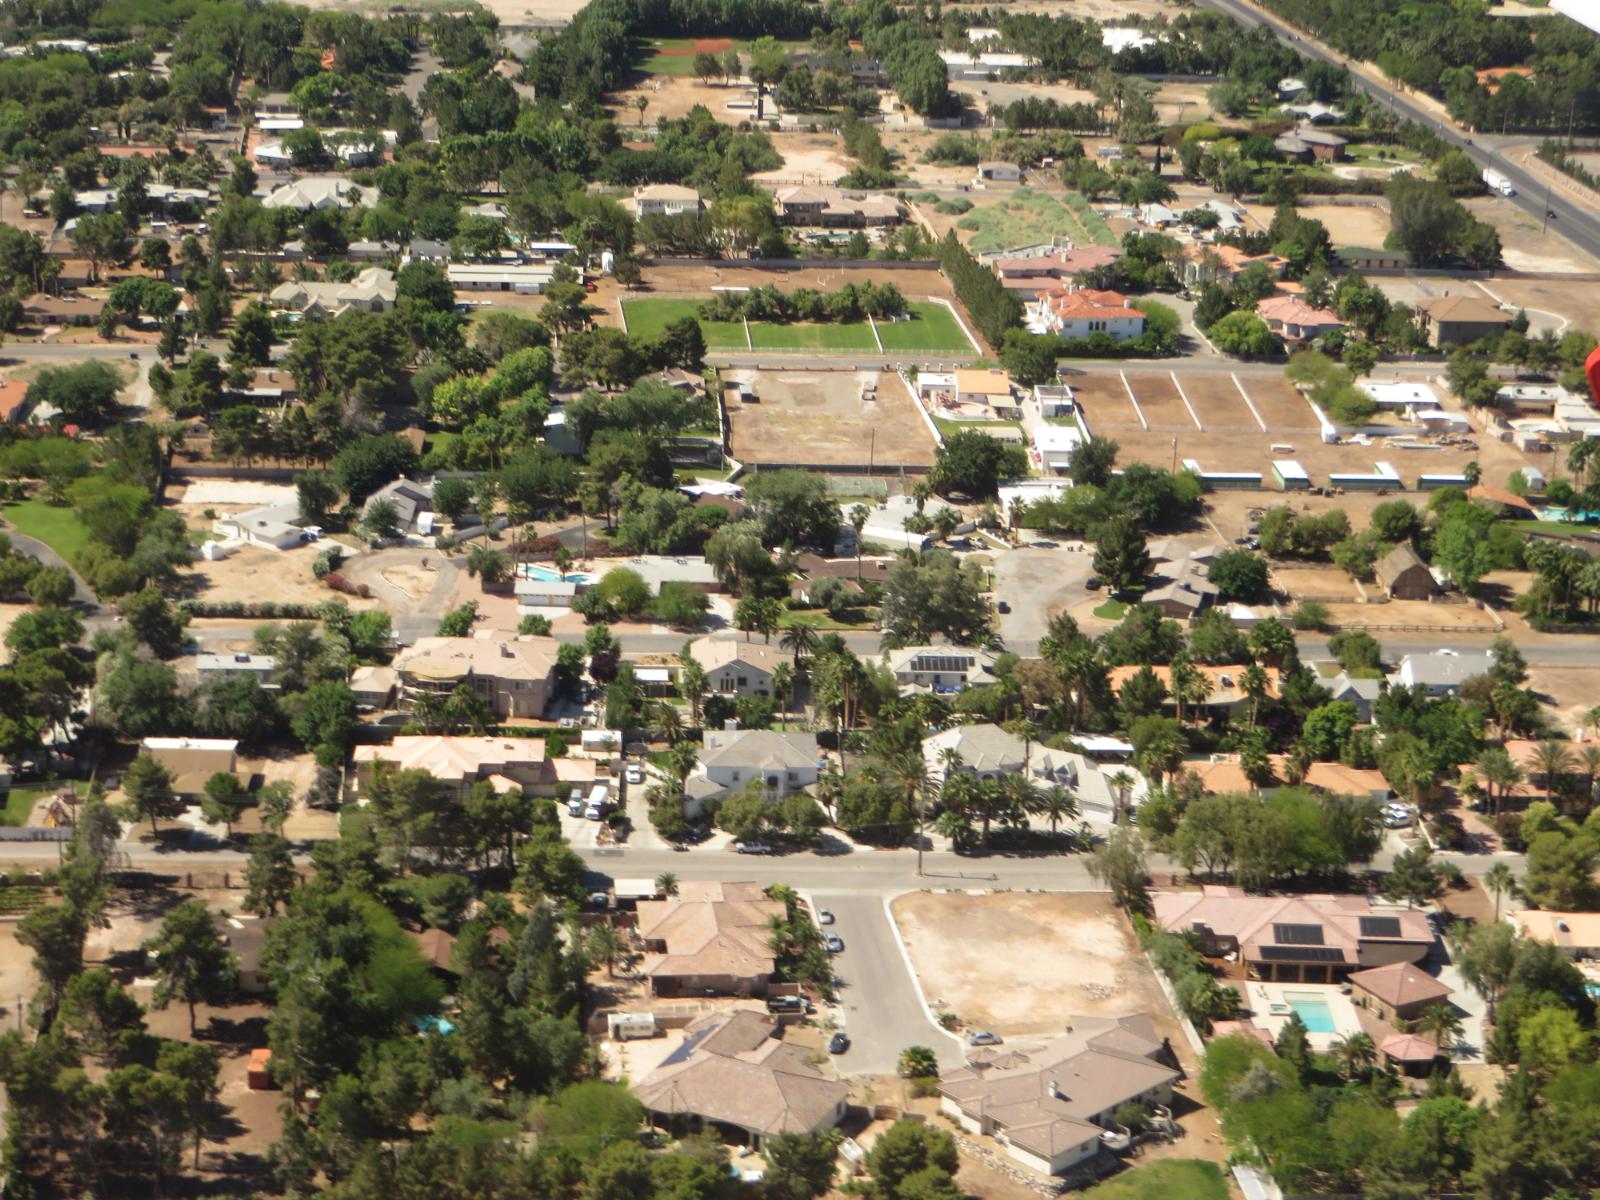
Just south of Las Vegas, Henderson has built a reputation as a family-friendly city with high-quality schools, parks, and planned communities. Its relative affordability compared to some California metros has brought steady migration.
The city’s blend of new developments and established neighborhoods appeals to a wide range of buyers. Economic spillover from Vegas and local investments in infrastructure have helped maintain price growth in the long term.
14. Logandale – 148% Home Price Increase Since 2010

- 2010: $209,612
- 2011: $195,073 (-$14,539, -6.94% from previous year)
- 2012: $178,623 (-$16,450, -8.43% from previous year)
- 2013: $189,777 (+$11,154, +6.24% from previous year)
- 2014: $219,322 (+$29,545, +15.57% from previous year)
- 2015: $242,819 (+$23,497, +10.71% from previous year)
- 2016: $263,653 (+$20,834, +8.58% from previous year)
- 2017: $281,551 (+$17,898, +6.79% from previous year)
- 2018: $314,095 (+$32,544, +11.56% from previous year)
- 2019: $341,462 (+$27,367, +8.71% from previous year)
- 2021: $404,051
- 2022: $474,985 (+$70,934, +17.55% from previous year)
- 2023: $466,889 (-$8,096, -1.70% from previous year)
- 2024: $491,773 (+$24,884, +5.33% from previous year)
- 2025: $519,610 (+$27,837, +5.66% from previous year)
Logandale has seen home prices jump by 148% since 2010, with the most consistent growth happening from 2013 onward. Even with a small dip in 2023, prices have bounced back with strong increases in the following two years.
Logandale – Quiet Living with Big Growth
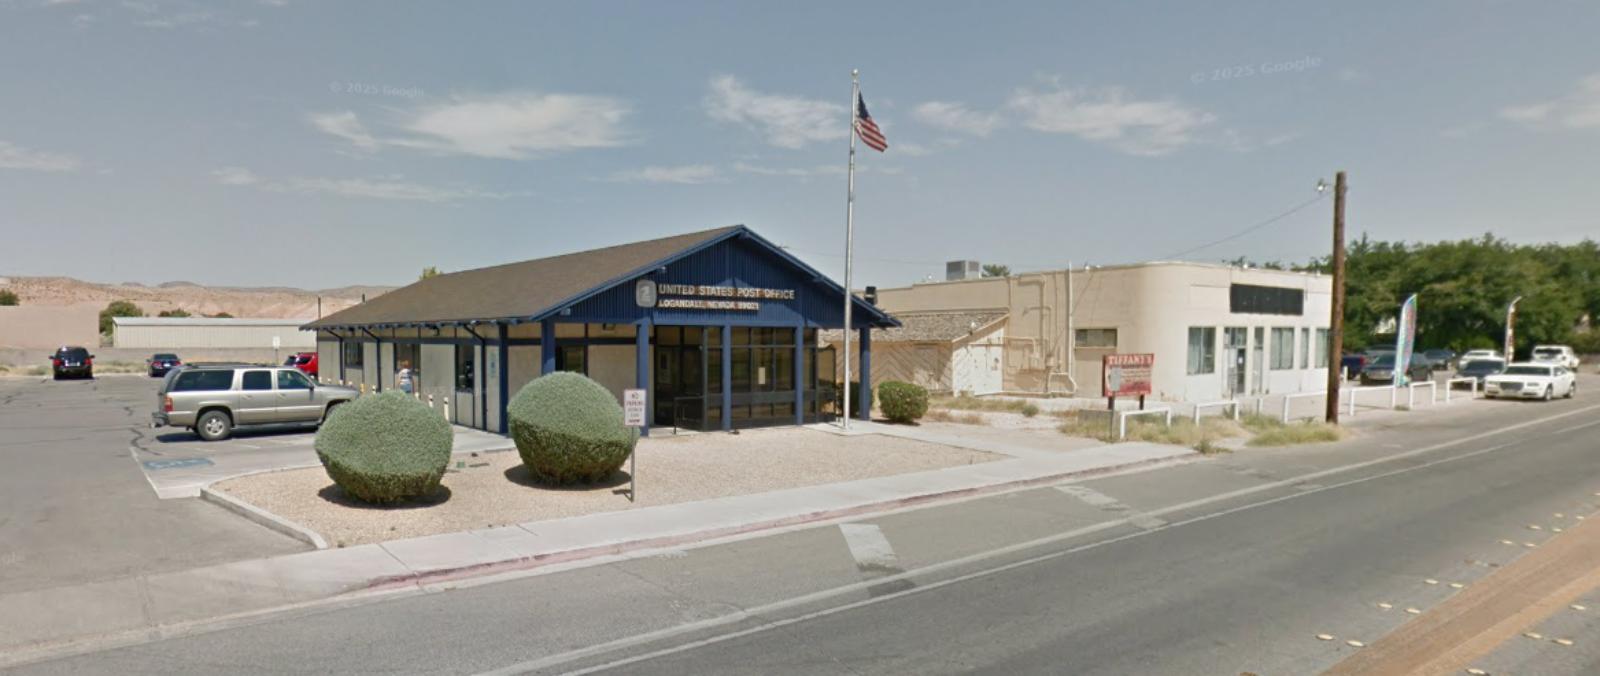
Located northeast of Las Vegas, Logandale offers wide-open spaces and a quieter pace of life. It appeals to buyers seeking space, privacy, and lower density—without being too far from city amenities.
The community’s growth is partly driven by demand for rural and semi-rural living, especially post-pandemic. As land and development tighten in metro areas, towns like Logandale are seeing increased attention and price growth.
13. Wellington – 134% Home Price Increase Since 2010
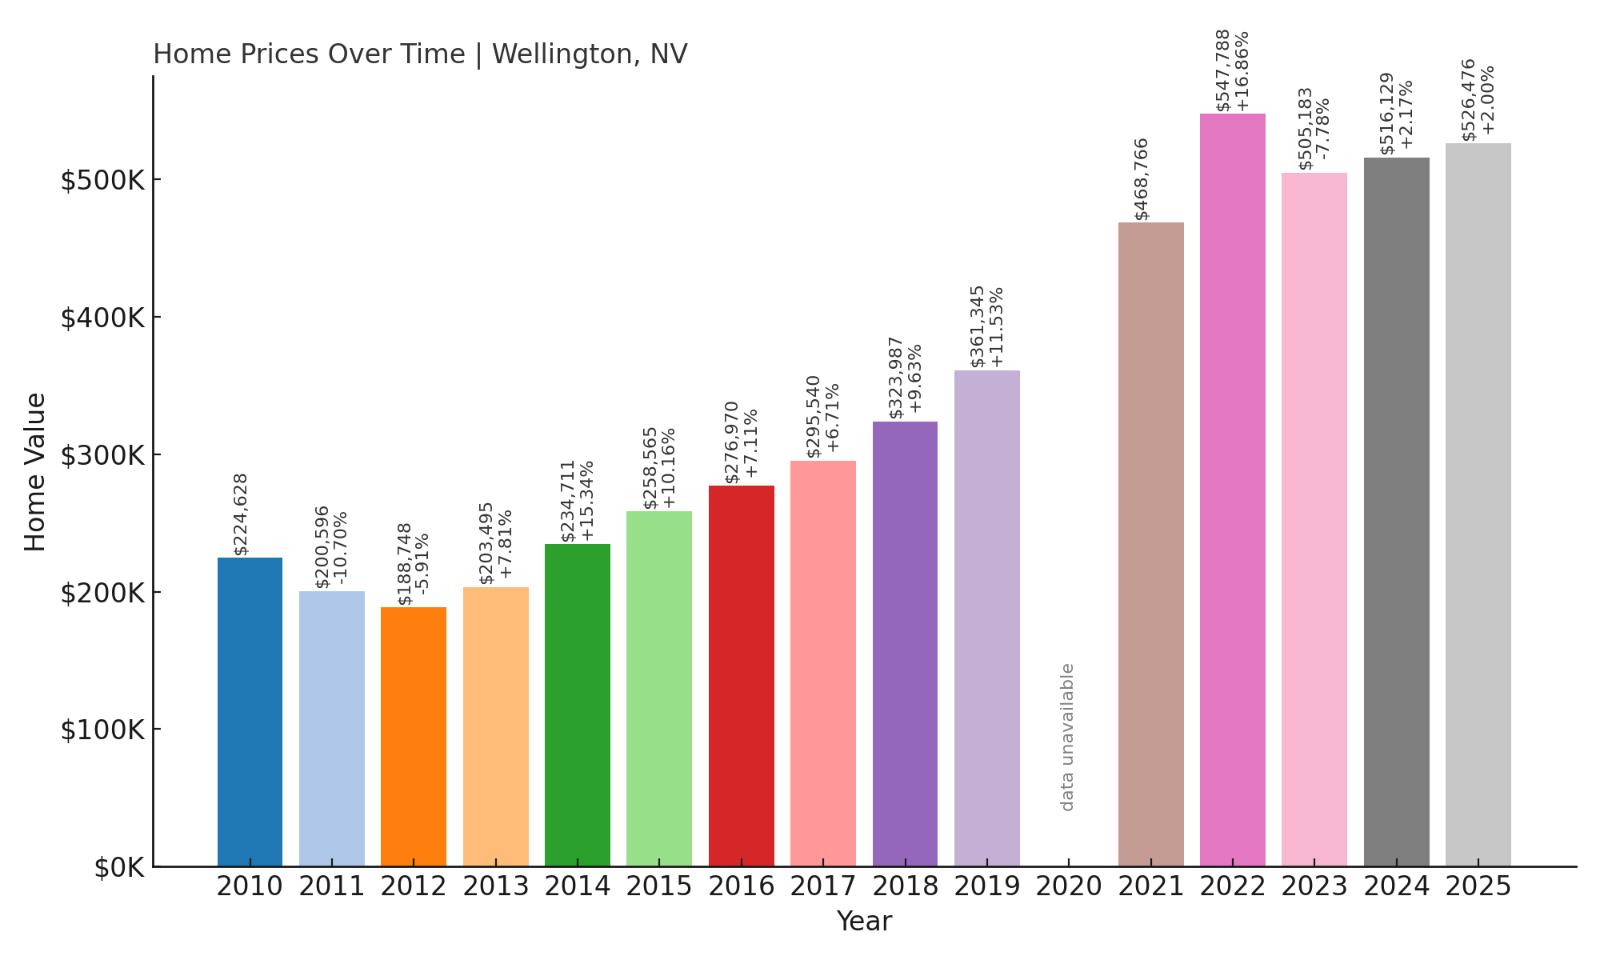
- 2010: $224,628
- 2011: $200,596 (-$24,032, -10.70% from previous year)
- 2012: $188,748 (-$11,848, -5.91% from previous year)
- 2013: $203,495 (+$14,747, +7.81% from previous year)
- 2014: $234,711 (+$31,216, +15.34% from previous year)
- 2015: $258,565 (+$23,854, +10.16% from previous year)
- 2016: $276,970 (+$18,405, +7.11% from previous year)
- 2017: $295,540 (+$18,570, +6.71% from previous year)
- 2018: $323,987 (+$28,447, +9.63% from previous year)
- 2019: $361,345 (+$37,358, +11.53% from previous year)
- 2021: $468,766
- 2022: $547,788 (+$79,022, +16.86% from previous year)
- 2023: $505,183 (-$42,605, -7.78% from previous year)
- 2024: $516,129 (+$10,946, +2.17% from previous year)
- 2025: $526,476 (+$10,347, +2.00% from previous year)
Wellington has more than doubled its home values since 2010, with a steady string of annual increases especially strong through 2022. A brief correction in 2023 was followed by renewed, if modest, price growth.
Wellington – Steady Climb for a Rural Outlier
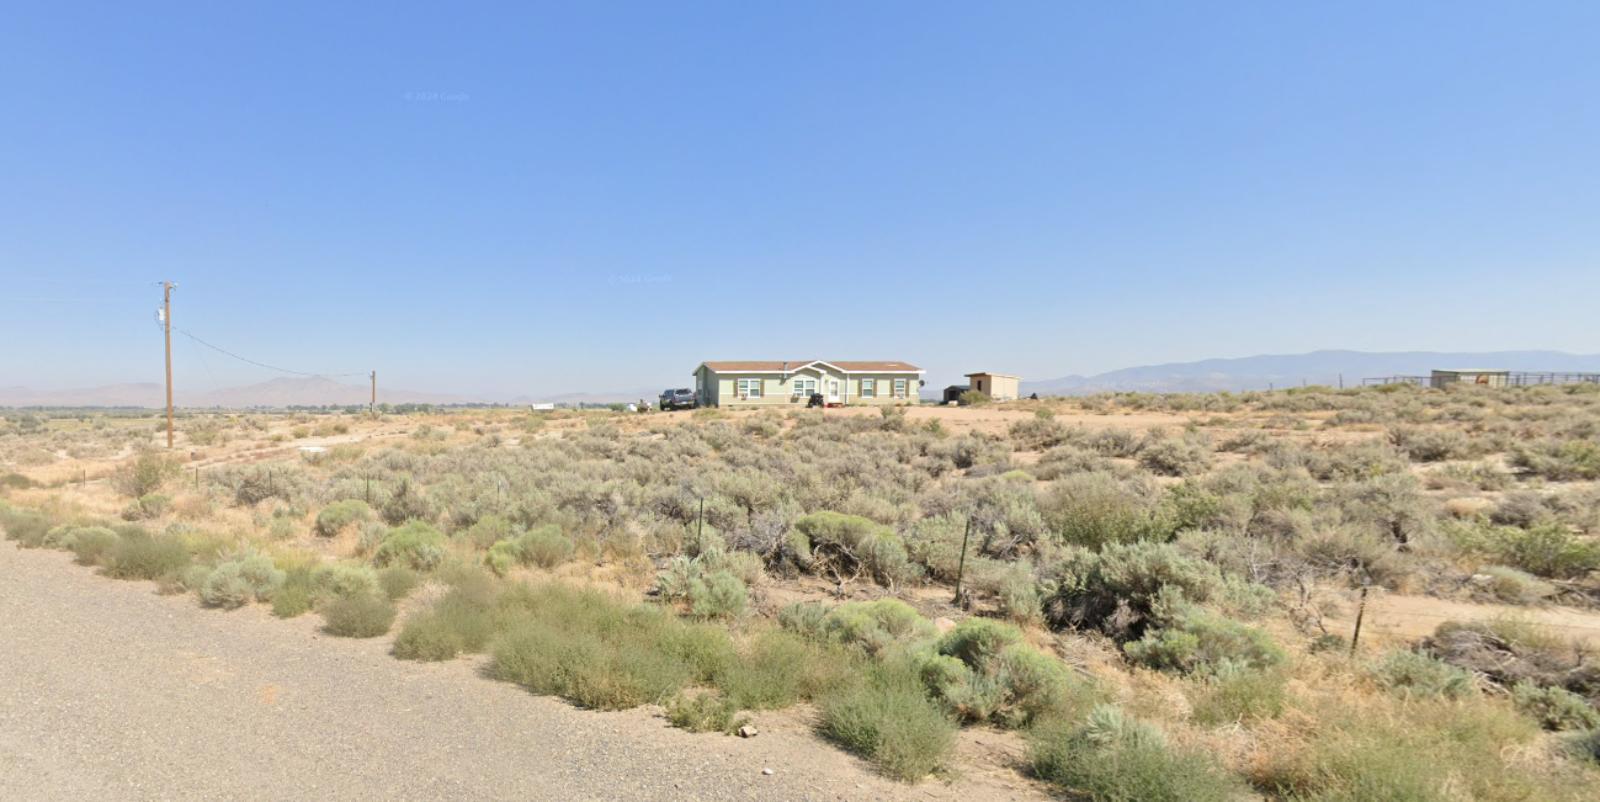
Wellington lies in western Nevada, tucked between mountains and valleys, making it attractive to those wanting affordable rural living with great views. Its modest size hasn’t stopped a steady stream of buyers looking for large plots and quieter surroundings.
While it’s more remote than other towns on this list, Wellington benefits from buyers expanding their search radius amid rising prices elsewhere. Long-term growth has been consistent and may continue as development pushes farther from urban cores.
12. Sparks – 188% Home Price Increase Since 2010
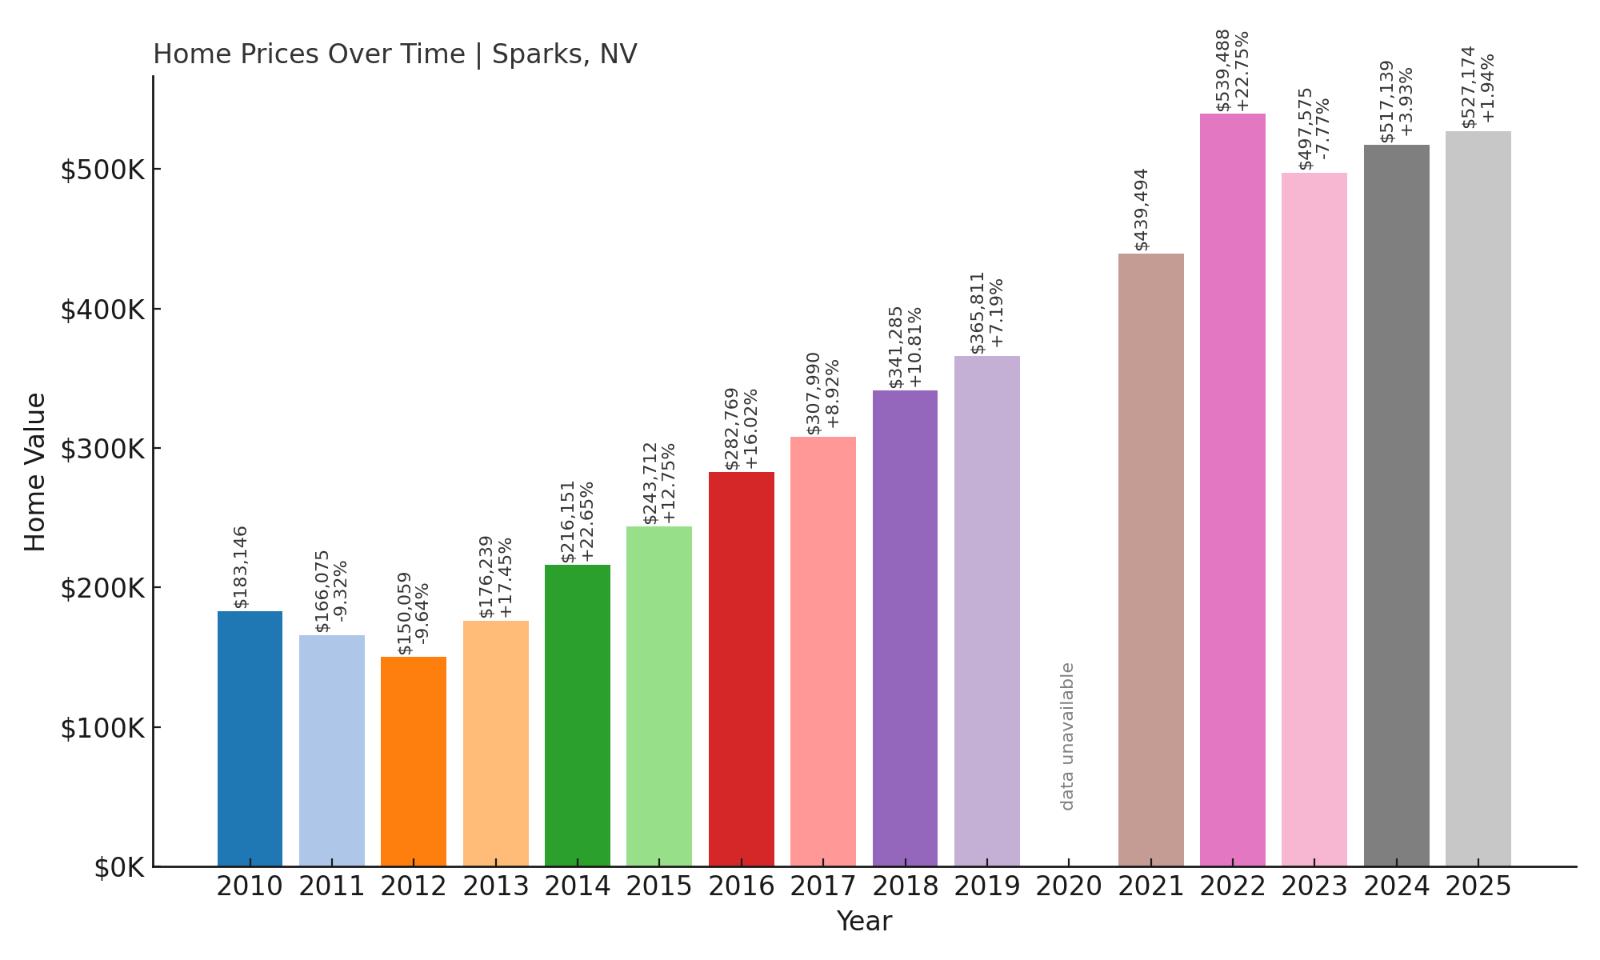
- 2010: $183,146
- 2011: $166,075 (-$17,071, -9.32% from previous year)
- 2012: $150,059 (-$16,016, -9.64% from previous year)
- 2013: $176,239 (+$26,180, +17.45% from previous year)
- 2014: $216,151 (+$39,912, +22.65% from previous year)
- 2015: $243,712 (+$27,561, +12.75% from previous year)
- 2016: $282,769 (+$39,057, +16.02% from previous year)
- 2017: $307,990 (+$25,221, +8.92% from previous year)
- 2018: $341,285 (+$33,295, +10.81% from previous year)
- 2019: $365,811 (+$24,526, +7.19% from previous year)
- 2021: $439,494
- 2022: $539,488 (+$99,994, +22.75% from previous year)
- 2023: $497,575 (-$41,913, -7.77% from previous year)
- 2024: $517,139 (+$19,564, +3.93% from previous year)
- 2025: $527,174 (+$10,035, +1.94% from previous year)
Home prices in Sparks have soared nearly 190% over the past 15 years, peaking in 2022. While there was a minor dip in 2023, the city quickly bounced back with continued gains into 2025.
Sparks – Reno’s Rising Neighbor
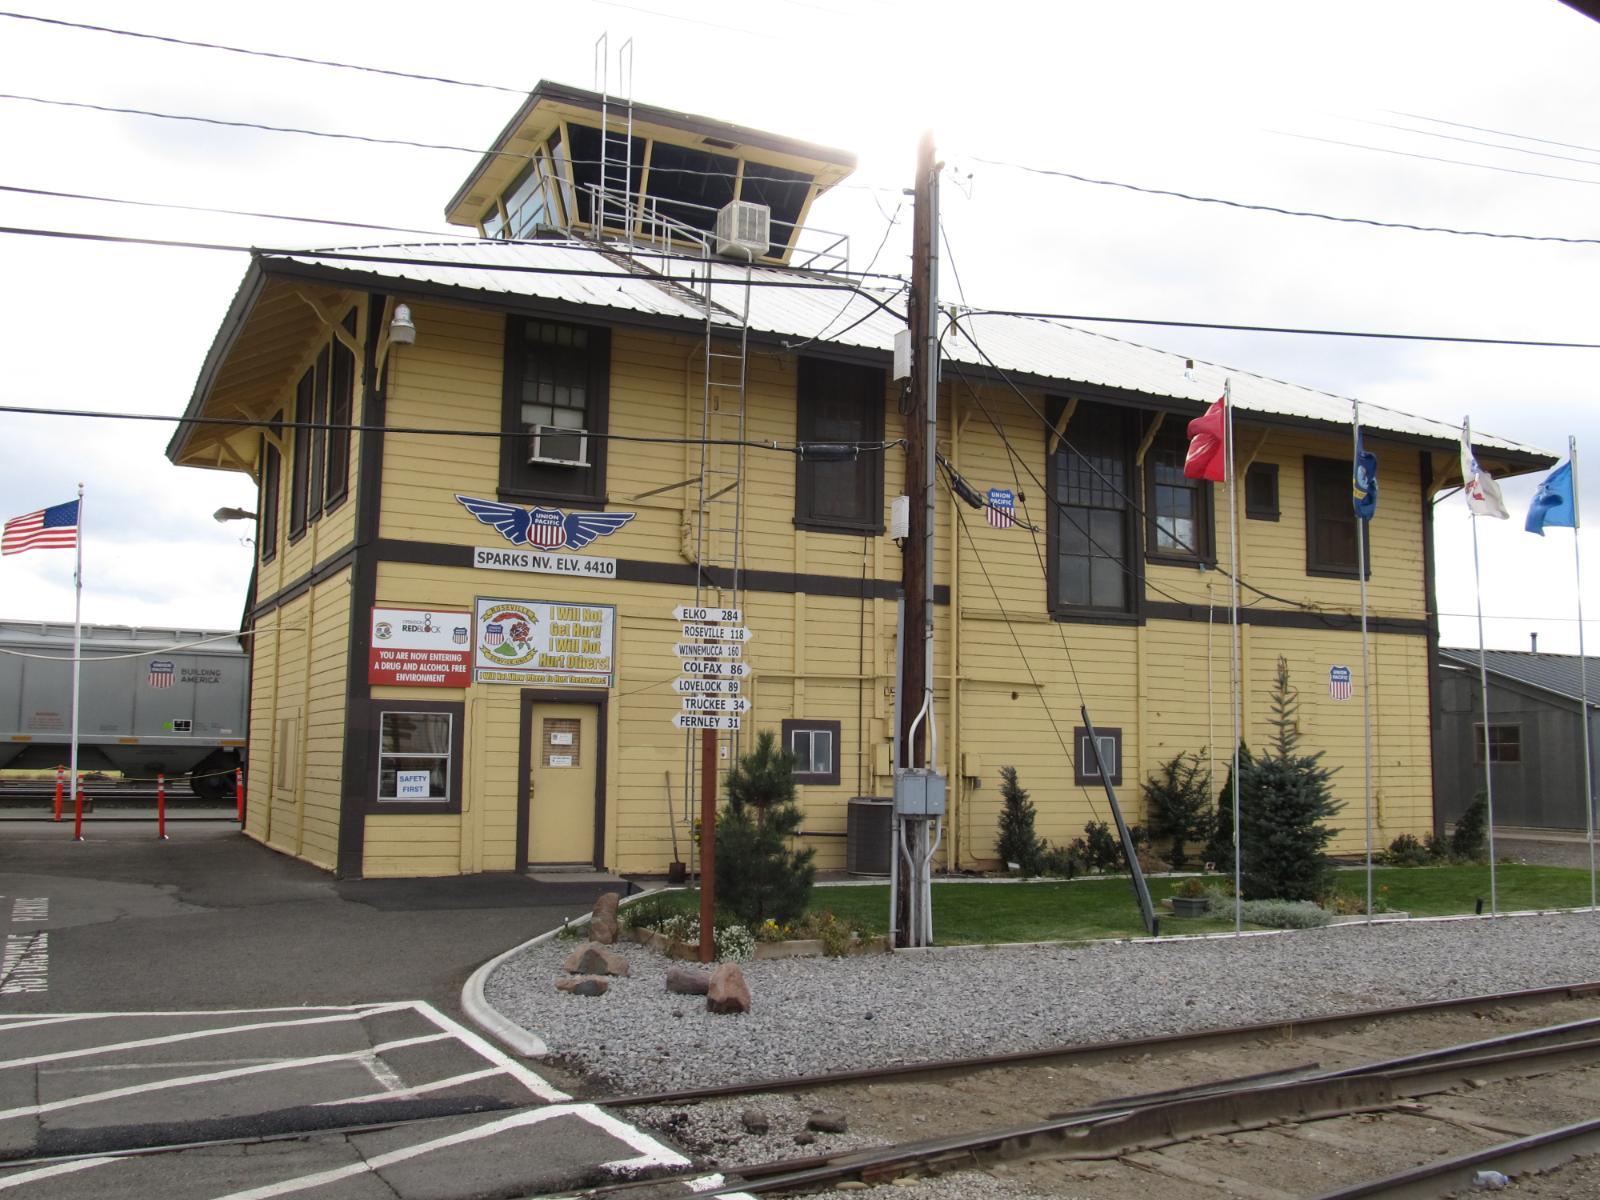
Sparks is often seen as a more affordable alternative to Reno, but that’s quickly changing. New housing developments, tech company expansions, and better infrastructure have made it a strong contender in northern Nevada’s real estate boom.
The city’s combination of family neighborhoods, shopping centers, and access to I-80 makes it attractive for commuters and investors alike. With limited land near Reno, Sparks has grown rapidly in both population and property value.
11. Mount Charleston – 104% Home Price Increase Since 2010
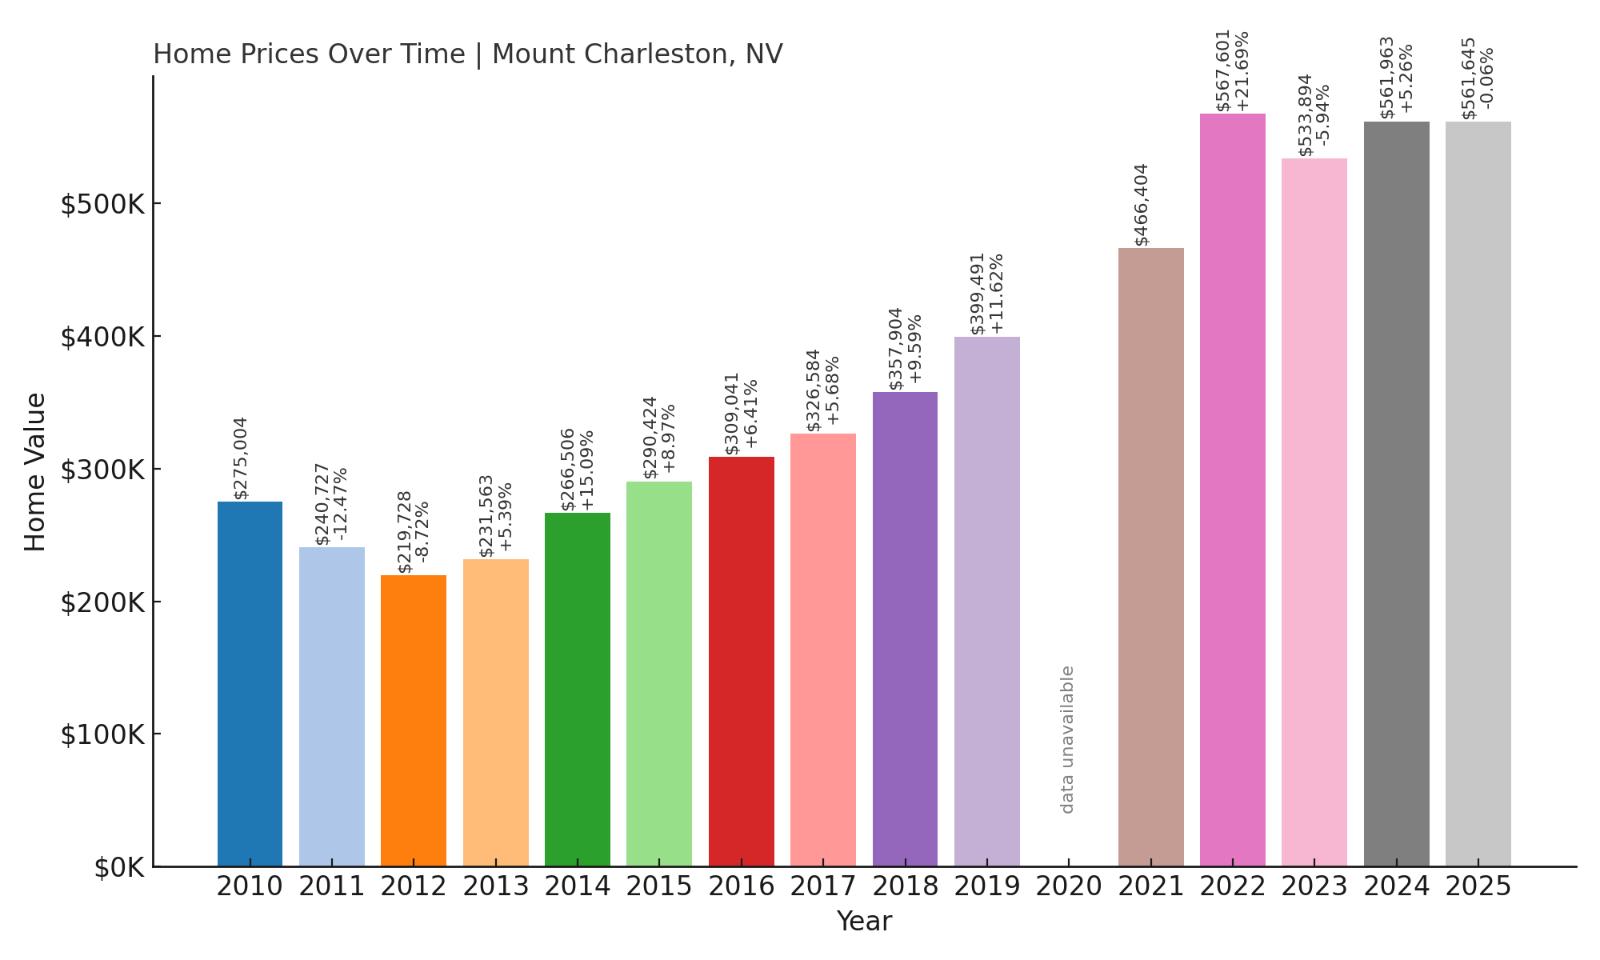
- 2010: $275,004
- 2011: $240,727 (-$34,277, -12.47% from previous year)
- 2012: $219,728 (-$20,999, -8.72% from previous year)
- 2013: $231,563 (+$11,835, +5.39% from previous year)
- 2014: $266,506 (+$34,943, +15.09% from previous year)
- 2015: $290,424 (+$23,918, +8.97% from previous year)
- 2016: $309,041 (+$18,617, +6.41% from previous year)
- 2017: $326,584 (+$17,543, +5.68% from previous year)
- 2018: $357,904 (+$31,320, +9.59% from previous year)
- 2019: $399,491 (+$41,587, +11.62% from previous year)
- 2021: $466,404
- 2022: $567,601 (+$101,197, +21.69% from previous year)
- 2023: $533,894 (-$33,707, -5.94% from previous year)
- 2024: $561,963 (+$28,069, +5.26% from previous year)
- 2025: $561,645 (-$318, -0.06% from previous year)
Mount Charleston’s home prices have more than doubled since 2010, although growth has tapered off recently. A spike in 2022 was followed by a moderate correction and a plateau in 2025.
Mount Charleston – Mountain Retreat With Tight Supply

Just an hour outside Las Vegas, Mount Charleston is prized for its cooler climate and alpine scenery. The area is limited in terms of development due to geography and conservation, which keeps inventory extremely low.
Home values surged during the pandemic as buyers sought outdoor space and seasonal getaways. Although recent price shifts show stabilization, long-term demand remains strong due to the town’s unique setting and exclusivity.
10. Reno – 186% Home Price Increase Since 2010
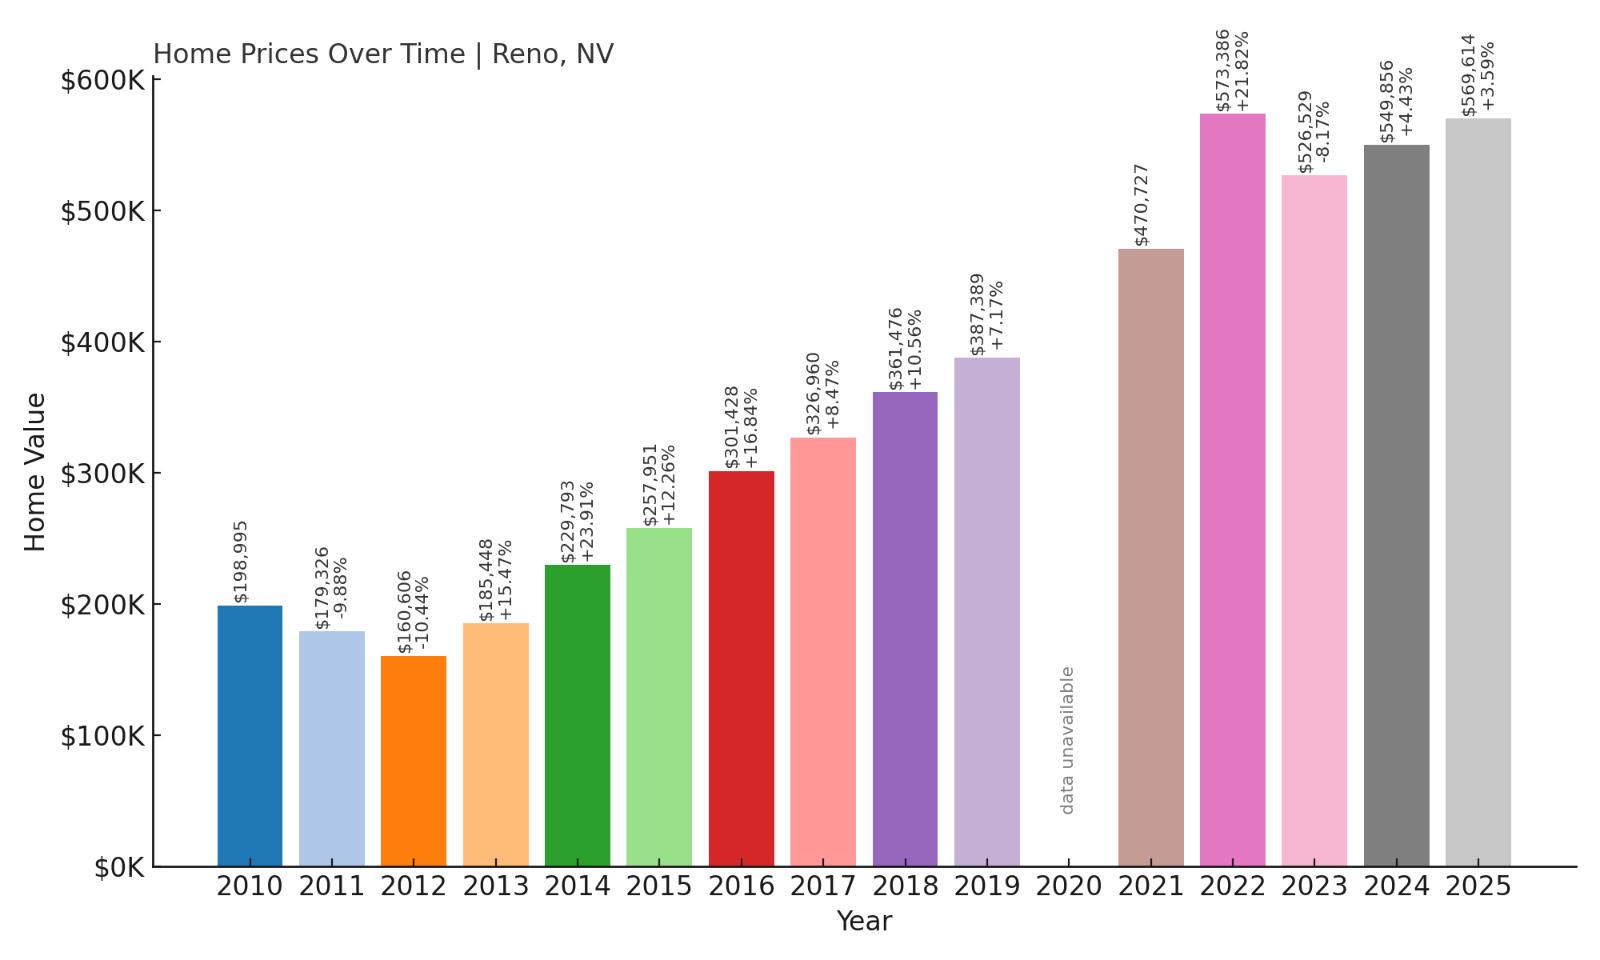
- 2010: $198,995
- 2011: $179,326 (-$19,669, -9.88% from previous year)
- 2012: $160,606 (-$18,720, -10.44% from previous year)
- 2013: $185,448 (+$24,842, +15.47% from previous year)
- 2014: $229,793 (+$44,345, +23.91% from previous year)
- 2015: $257,951 (+$28,158, +12.26% from previous year)
- 2016: $301,428 (+$43,477, +16.84% from previous year)
- 2017: $326,960 (+$25,532, +8.47% from previous year)
- 2018: $361,476 (+$34,516, +10.56% from previous year)
- 2019: $387,389 (+$25,913, +7.17% from previous year)
- 2021: $470,727
- 2022: $573,386 (+$102,659, +21.82% from previous year)
- 2023: $526,529 (-$46,857, -8.17% from previous year)
- 2024: $549,856 (+$23,327, +4.43% from previous year)
- 2025: $569,614 (+$19,758, +3.59% from previous year)
Reno has become one of Nevada’s biggest housing success stories, with prices rising nearly 190% since 2010. A slight cooldown in 2023 was followed by a return to steady growth through 2025.
Reno – From Casino Town to Tech Hub
Reno’s transformation over the past decade has been dramatic. Once known mostly for its casinos, it’s now home to major tech and logistics firms, drawing in new residents from across the western U.S.
The city’s growth is fueled by a mix of job creation, proximity to Tahoe, and Nevada’s tax-friendly climate. With new construction racing to keep up, Reno remains a key driver of statewide real estate trends.
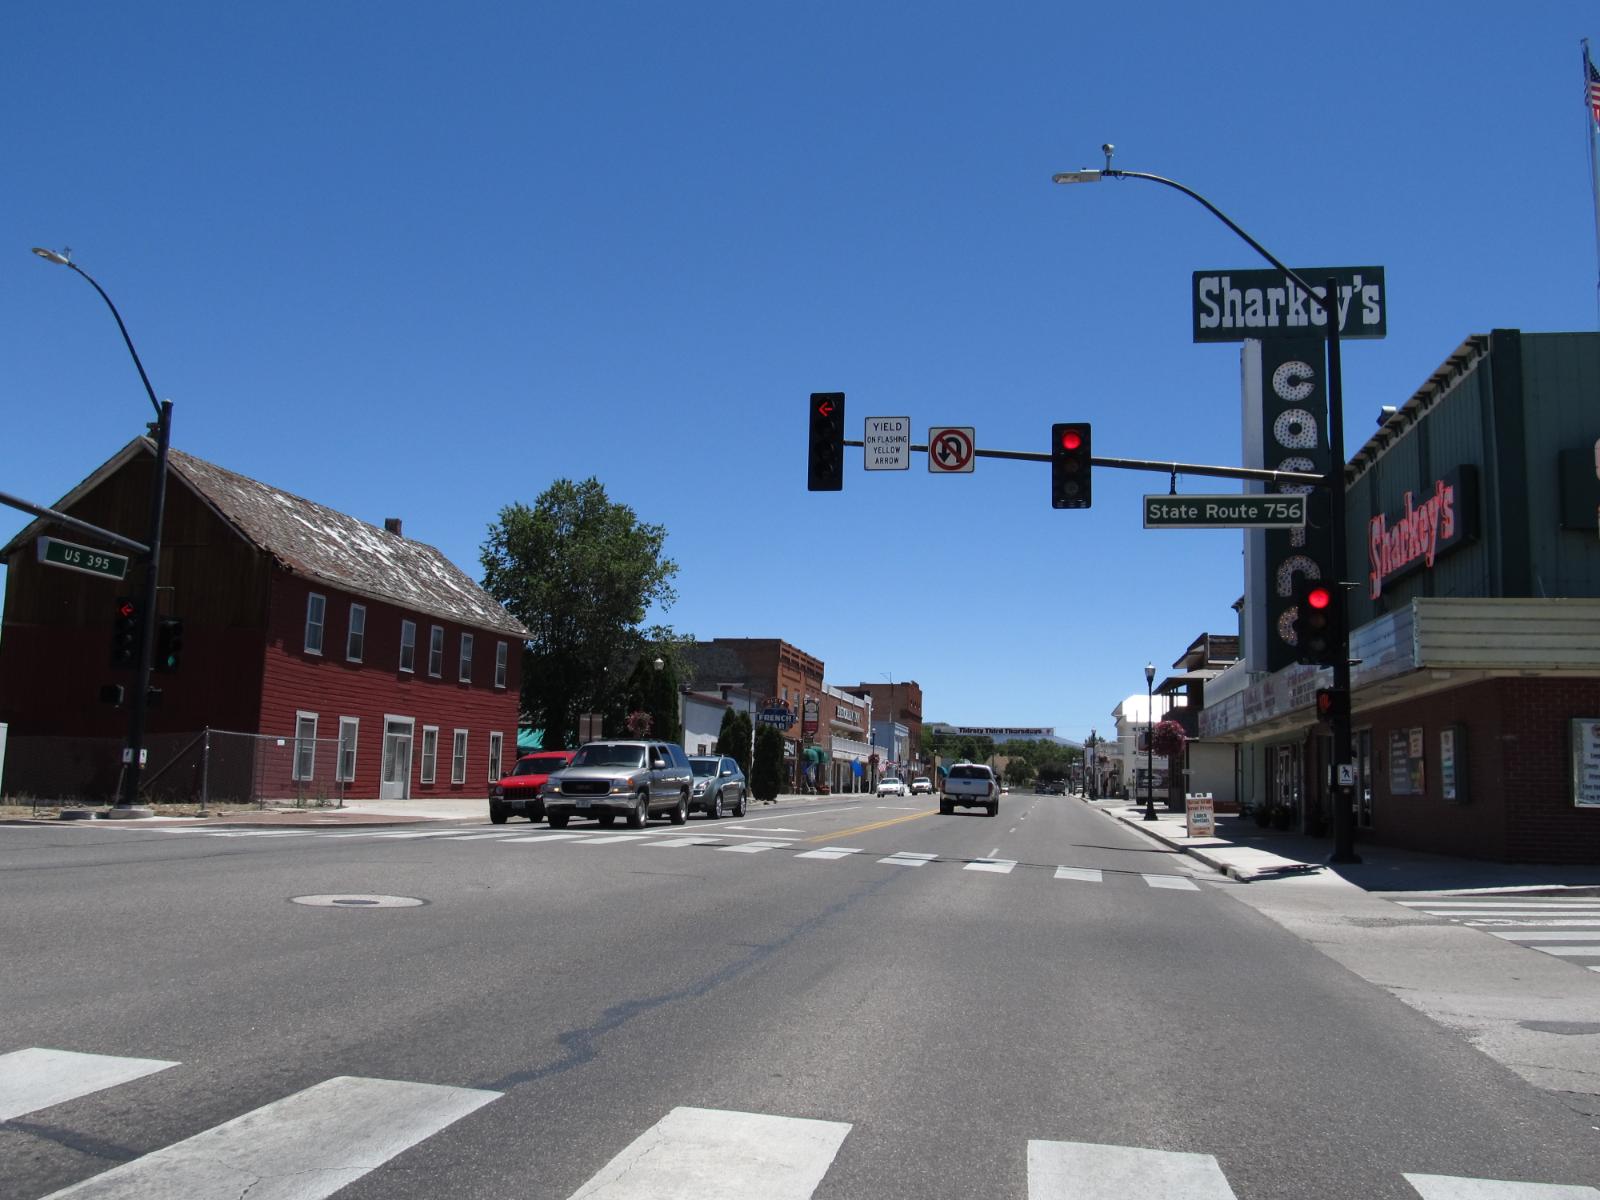
9. Smith – 146% Home Price Increase Since 2010

- 2010: $239,986
- 2011: $213,659 (-$26,327, -10.97% from previous year)
- 2012: $203,677 (-$9,982, -4.67% from previous year)
- 2013: $218,644 (+$14,967, +7.35% from previous year)
- 2014: $251,938 (+$33,294, +15.22% from previous year)
- 2015: $282,461 (+$30,523, +12.12% from previous year)
- 2016: $308,805 (+$26,344, +9.33% from previous year)
- 2017: $329,308 (+$20,503, +6.64% from previous year)
- 2018: $360,529 (+$31,221, +9.48% from previous year)
- 2019: $399,623 (+$39,094, +10.84% from previous year)
- 2021: $503,978
- 2022: $598,375 (+$94,397, +18.73% from previous year)
- 2023: $536,339 (-$62,036, -10.37% from previous year)
- 2024: $562,327 (+$25,988, +4.85% from previous year)
- 2025: $589,932 (+$27,605, +4.91% from previous year)
Smith’s home prices have climbed 146% since 2010, with the strongest acceleration between 2021 and 2022. Even with a price dip in 2023, the trend bounced back with two solid years of growth.
Smith – Rural Growth with Room to Expand
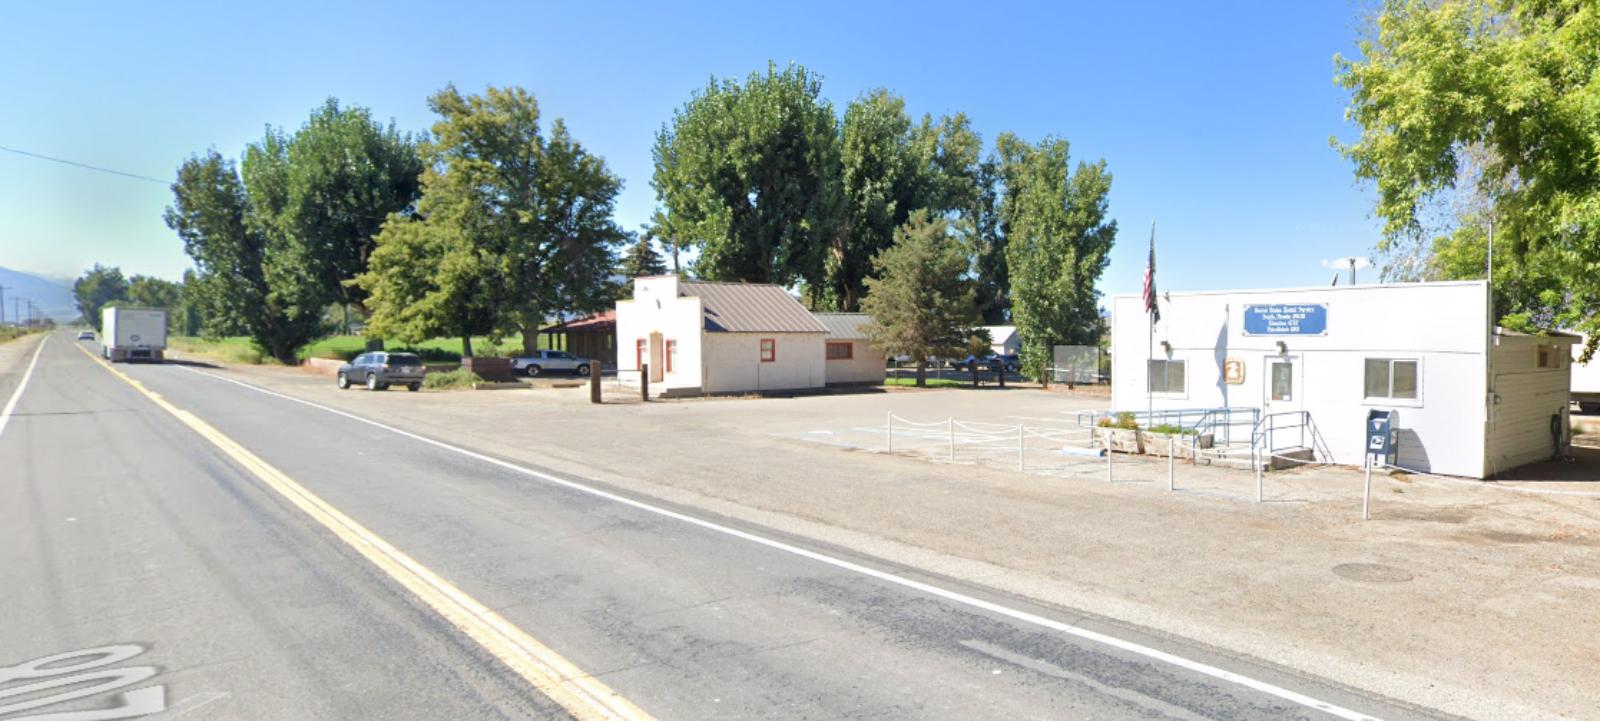
Smith is one of the lesser-known towns on this list, but that’s exactly what makes it appealing to buyers. It offers land, quiet, and a break from higher prices seen closer to urban centers.
Its growth appears driven by buyers expanding their search areas for affordability, which may continue as home prices rise across the state. For now, Smith represents the outer edges of Nevada’s housing expansion.
8. Gardnerville – 160% Home Price Increase Since 2010

- 2010: $230,983
- 2011: $205,674 (-$25,309, -10.96% from previous year)
- 2012: $197,705 (-$7,969, -3.88% from previous year)
- 2013: $220,900 (+$23,195, +11.73% from previous year)
- 2014: $263,884 (+$42,984, +19.45% from previous year)
- 2015: $286,097 (+$22,213, +8.42% from previous year)
- 2016: $313,912 (+$27,815, +9.72% from previous year)
- 2017: $344,448 (+$30,536, +9.73% from previous year)
- 2018: $380,936 (+$36,488, +10.60% from previous year)
- 2019: $417,967 (+$37,031, +9.72% from previous year)
- 2021: $522,712
- 2022: $617,667 (+$94,955, +18.17% from previous year)
- 2023: $568,182 (-$49,485, -8.01% from previous year)
- 2024: $589,336 (+$21,154, +3.72% from previous year)
- 2025: $601,029 (+$11,693, +1.98% from previous year)
Gardnerville has seen a 160% increase in home values since 2010, with consistent year-over-year growth peaking in 2022. A dip in 2023 was followed by continued, albeit slower, gains in the next two years.
Gardnerville – Mountain Views and Long-Term Growth
Located in the Carson Valley, Gardnerville offers scenic mountain views, outdoor access, and a growing residential community. It attracts both retirees and families looking for space and nature near urban conveniences.
Its steady rise in home prices reflects a healthy mix of demand and limited sprawl. As nearby cities become more crowded and expensive, Gardnerville continues to draw buyers seeking a quieter lifestyle without leaving Nevada’s growth corridor.
7. Minden – 147% Home Price Increase Since 2010

- 2010: $279,355
- 2011: $250,015 (-$29,340, -10.50% from previous year)
- 2012: $242,293 (-$7,722, -3.09% from previous year)
- 2013: $263,795 (+$21,502, +8.88% from previous year)
- 2014: $314,118 (+$50,323, +19.08% from previous year)
- 2015: $333,167 (+$19,049, +6.06% from previous year)
- 2016: $363,923 (+$30,756, +9.23% from previous year)
- 2017: $394,855 (+$30,932, +8.49% from previous year)
- 2018: $434,195 (+$39,340, +9.97% from previous year)
- 2019: $476,015 (+$41,820, +9.63% from previous year)
- 2021: $607,596
- 2022: $727,517 (+$119,921, +19.73% from previous year)
- 2023: $662,436 (-$65,081, -8.95% from previous year)
- 2024: $675,616 (+$13,180, +1.99% from previous year)
- 2025: $690,286 (+$14,670, +2.17% from previous year)
Minden’s home values have climbed 147% since 2010, with standout growth through 2022. Despite a dip in 2023, prices have stabilized and are climbing again, suggesting a long-term upward trend.
Minden – Small-Town Charm Meets Rising Demand

Right next to Gardnerville in the Carson Valley, Minden is another town benefiting from the Reno-Tahoe growth spillover. With a quaint downtown, good schools, and proximity to outdoor adventures, Minden is gaining popularity.
The combination of lifestyle appeal and accessibility continues to push values upward. It’s become a favorite among buyers wanting a community feel with upscale home options.
6. Stateline – 78% Home Price Increase Since 2010

- 2010: $409,918
- 2011: $365,920 (-$43,998, -10.73% from previous year)
- 2012: $347,969 (-$17,951, -4.90% from previous year)
- 2013: $372,809 (+$24,840, +7.14% from previous year)
- 2014: $447,281 (+$74,472, +19.97% from previous year)
- 2015: $493,336 (+$46,055, +10.30% from previous year)
- 2016: $488,517 (-$4,819, -0.98% from previous year)
- 2017: $501,695 (+$13,178, +2.70% from previous year)
- 2018: $519,950 (+$18,255, +3.64% from previous year)
- 2019: $563,920 (+$43,970, +8.46% from previous year)
- 2021: $718,472
- 2022: $884,011 (+$165,539, +23.04% from previous year)
- 2023: $776,290 (-$107,721, -12.18% from previous year)
- 2024: $741,095 (-$35,195, -4.53% from previous year)
- 2025: $728,012 (-$13,083, -1.77% from previous year)
Stateline saw strong price growth through 2022, peaking at nearly $900K before a correction over the following three years. Even with recent declines, prices remain well above their 2010 levels.
Stateline – Casino Town with Lakefront Luxury
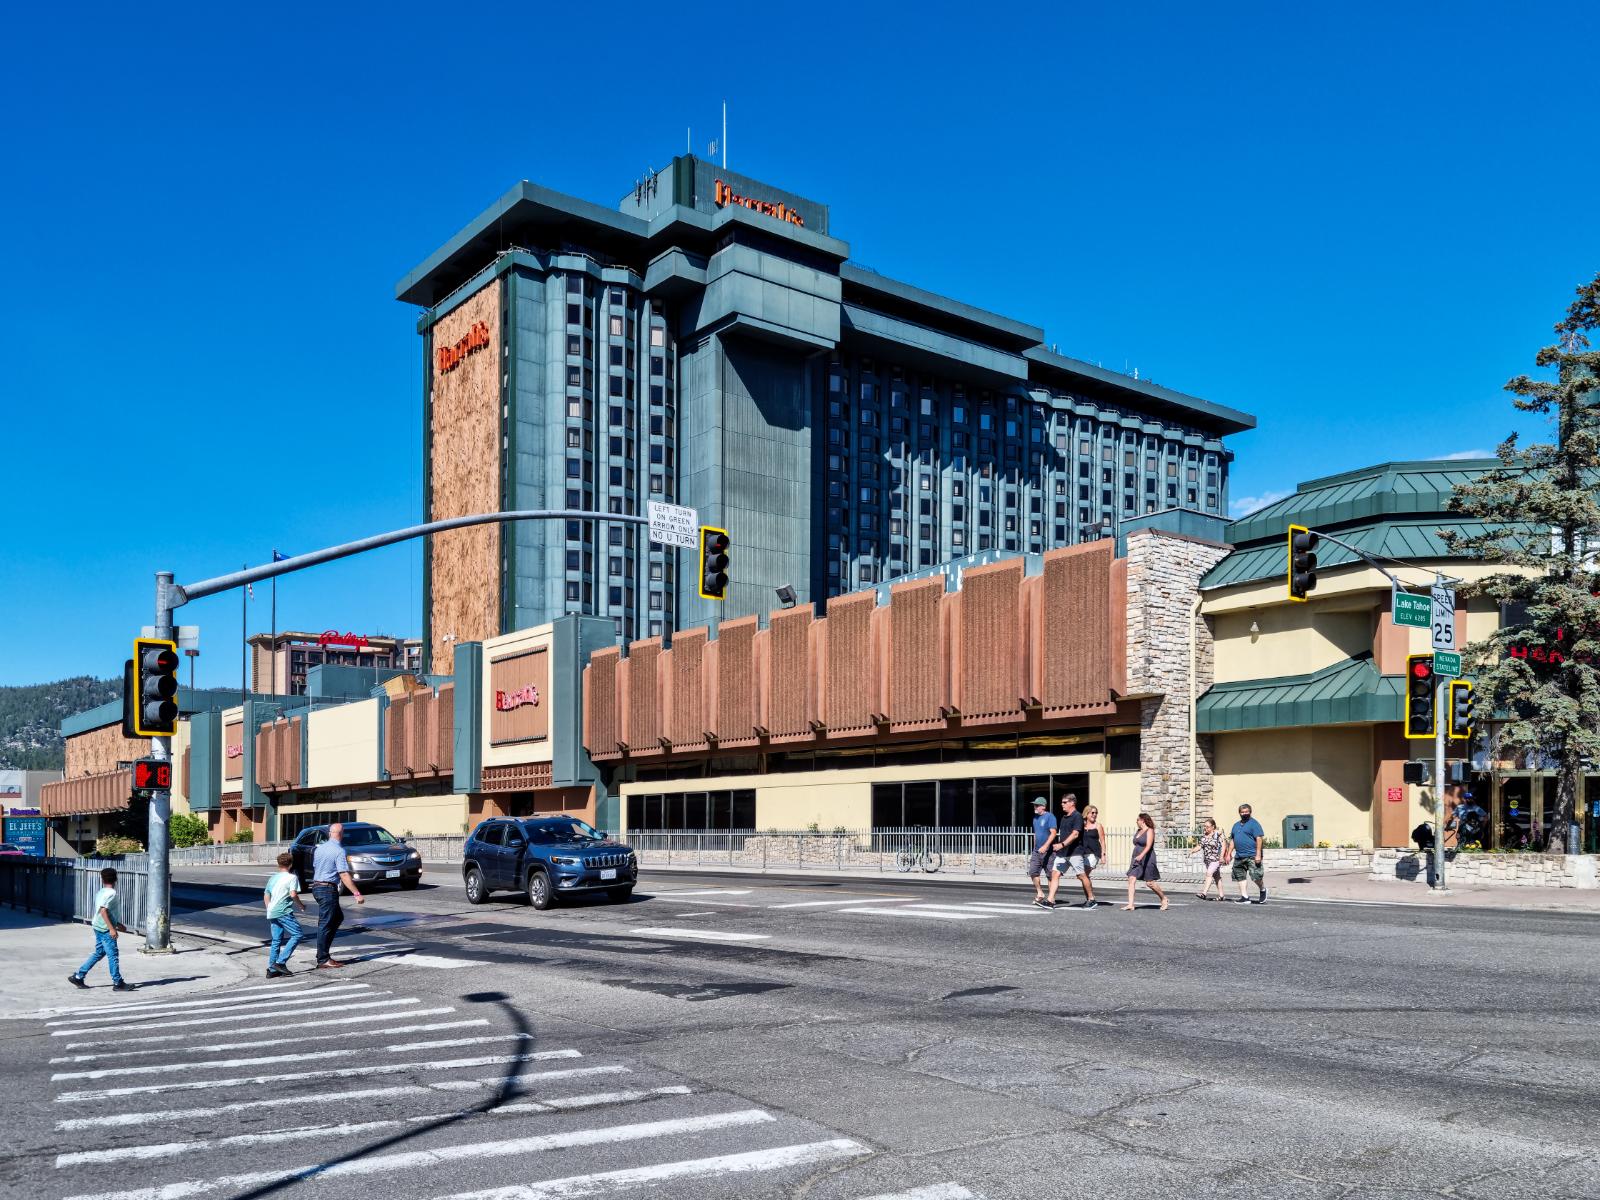
Stateline sits right at the Nevada-California border on the shore of Lake Tahoe. Known for its casinos and ski access, it draws vacationers and second-home buyers year-round.
Its real estate prices are closely tied to tourism and luxury trends. As travel and remote work patterns evolve, Stateline has seen both booms and corrections—but long-term growth remains substantial.
5. Verdi – 149% Home Price Increase Since 2010
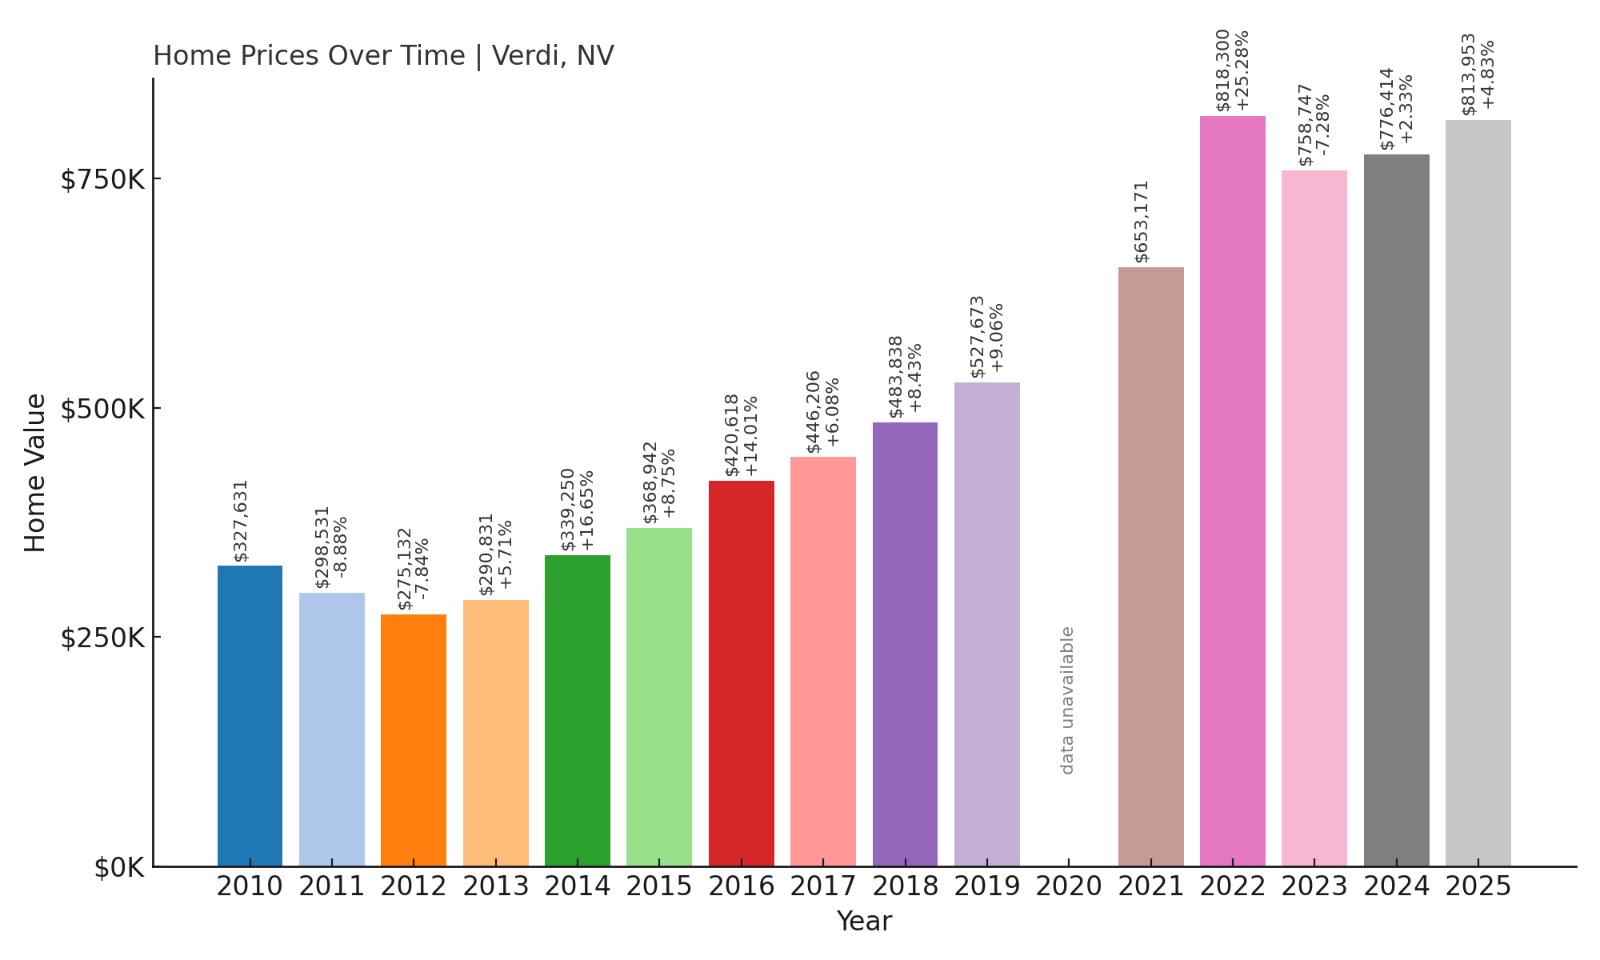
- 2010: $327,631
- 2011: $298,531 (-$29,100, -8.88% from previous year)
- 2012: $275,132 (-$23,399, -7.84% from previous year)
- 2013: $290,831 (+$15,699, +5.71% from previous year)
- 2014: $339,250 (+$48,419, +16.65% from previous year)
- 2015: $368,942 (+$29,692, +8.75% from previous year)
- 2016: $420,618 (+$51,676, +14.01% from previous year)
- 2017: $446,206 (+$25,588, +6.08% from previous year)
- 2018: $483,838 (+$37,632, +8.43% from previous year)
- 2019: $527,673 (+$43,835, +9.06% from previous year)
- 2021: $653,171
- 2022: $818,300 (+$165,129, +25.28% from previous year)
- 2023: $758,747 (-$59,553, -7.28% from previous year)
- 2024: $776,414 (+$17,667, +2.33% from previous year)
- 2025: $813,953 (+$37,539, +4.83% from previous year)
Verdi’s home prices have surged 149% since 2010, with particularly strong momentum between 2021 and 2022. Though there was a dip in 2023, the town has since returned to a growth trajectory.
Verdi – Scenic, Upscale, and Surging
Verdi, located just west of Reno near the California border, offers scenic river views, quick access to I-80, and a premium feel. It’s a favorite among buyers seeking luxury homes and open spaces without venturing far from city life.
Its high-end developments and proximity to Tahoe and tech hubs have helped drive prices skyward. As Reno fills out, Verdi continues to grow as an exclusive residential enclave with long-term appeal.
4. Incline Village – 140% Home Price Increase Since 2010

- 2010: $612,746
- 2011: $570,580 (-$42,166, -6.89% from previous year)
- 2012: $541,797 (-$28,783, -5.04% from previous year)
- 2013: $561,022 (+$19,225, +3.55% from previous year)
- 2014: $644,071 (+$83,049, +14.80% from previous year)
- 2015: $684,882 (+$40,811, +6.34% from previous year)
- 2016: $731,265 (+$46,383, +6.77% from previous year)
- 2017: $790,310 (+$59,045, +8.08% from previous year)
- 2018: $853,949 (+$63,639, +8.05% from previous year)
- 2019: $942,127 (+$88,178, +10.33% from previous year)
- 2021: $1,226,328
- 2022: $1,476,831 (+$250,503, +20.43% from previous year)
- 2023: $1,350,011 (-$126,820, -8.59% from previous year)
- 2024: $1,409,067 (+$59,056, +4.37% from previous year)
- 2025: $1,469,592 (+$60,525, +4.29% from previous year)
Incline Village has posted a 140% increase in home values since 2010, with a huge spike in 2022. Although values dipped slightly the next year, they’ve resumed upward movement since.
Incline Village – Luxury Living on Lake Tahoe’s Edge
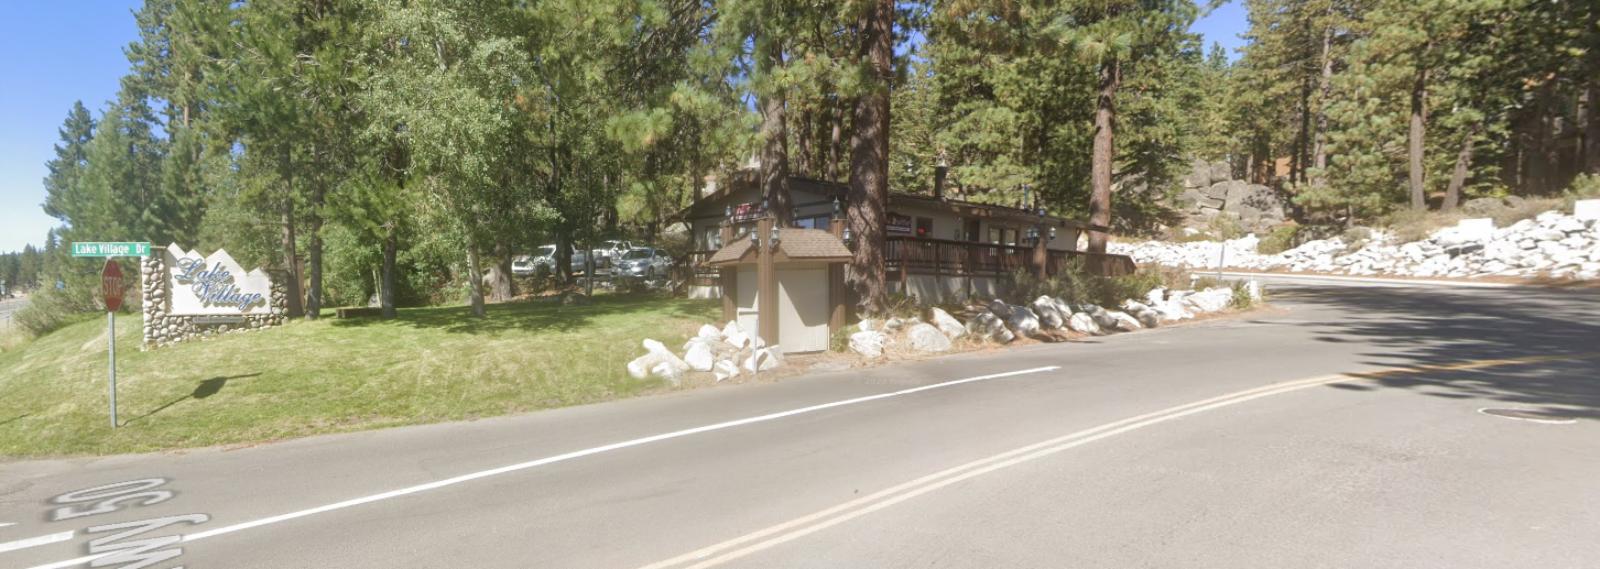
Incline Village is one of Nevada’s most exclusive communities. Set on the northern shore of Lake Tahoe, it’s home to multi-million-dollar homes, private beaches, and low Nevada property taxes.
Popular with second-home buyers and retirees, Incline’s market reflects demand for both lifestyle and investment. With limited inventory and stunning views, prices here tend to climb quickly and correct only slightly.
3. Glenbrook – 132% Home Price Increase Since 2010

- 2010: $715,512
- 2011: $644,394 (-$71,118, -9.94% from previous year)
- 2012: $613,435 (-$30,959, -4.80% from previous year)
- 2013: $637,243 (+$23,808, +3.88% from previous year)
- 2014: $743,706 (+$106,463, +16.71% from previous year)
- 2015: $784,775 (+$41,069, +5.52% from previous year)
- 2016: $831,826 (+$47,051, +5.99% from previous year)
- 2017: $895,503 (+$63,677, +7.65% from previous year)
- 2018: $981,528 (+$86,025, +9.61% from previous year)
- 2019: $1,067,589 (+$86,061, +8.77% from previous year)
- 2021: $1,367,706
- 2022: $1,667,014 (+$299,308, +21.89% from previous year)
- 2023: $1,542,344 (-$124,670, -7.48% from previous year)
- 2024: $1,602,587 (+$60,243, +3.91% from previous year)
- 2025: $1,661,086 (+$58,499, +3.65% from previous year)
Glenbrook’s real estate has appreciated by 132% since 2010, peaking in 2022 with continued gains in 2024 and 2025 after a temporary pullback.
Glenbrook – Gated, Private, and Pricy
Glenbrook is a small, gated community on Lake Tahoe’s east shore. Known for seclusion, lakefront estates, and private amenities, it’s one of Nevada’s most expensive and exclusive enclaves.
Prices have surged thanks to scarcity and high-end demand. With limited homes and a premium on privacy, Glenbrook remains a top-tier location for ultra-wealthy buyers.
2. Crystal Bay – 121% Home Price Increase Since 2010

- 2010: $786,325
- 2011: $733,911 (-$52,414, -6.67% from previous year)
- 2012: $693,403 (-$40,508, -5.52% from previous year)
- 2013: $708,844 (+$15,441, +2.23% from previous year)
- 2014: $796,688 (+$87,844, +12.39% from previous year)
- 2015: $858,667 (+$61,979, +7.78% from previous year)
- 2016: $900,135 (+$41,468, +4.83% from previous year)
- 2017: $955,604 (+$55,469, +6.16% from previous year)
- 2018: $1,015,304 (+$59,700, +6.25% from previous year)
- 2019: $1,124,263 (+$108,959, +10.73% from previous year)
- 2021: $1,436,320
- 2022: $1,729,524 (+$293,204, +20.43% from previous year)
- 2023: $1,602,537 (-$126,987, -7.34% from previous year)
- 2024: $1,671,239 (+$68,702, +4.29% from previous year)
- 2025: $1,741,092 (+$69,853, +4.18% from previous year)
Crystal Bay has seen a 121% increase in home values since 2010, with major leaps in recent years despite short-term price adjustments in 2023.
Crystal Bay – Exclusive and Ever-Rising
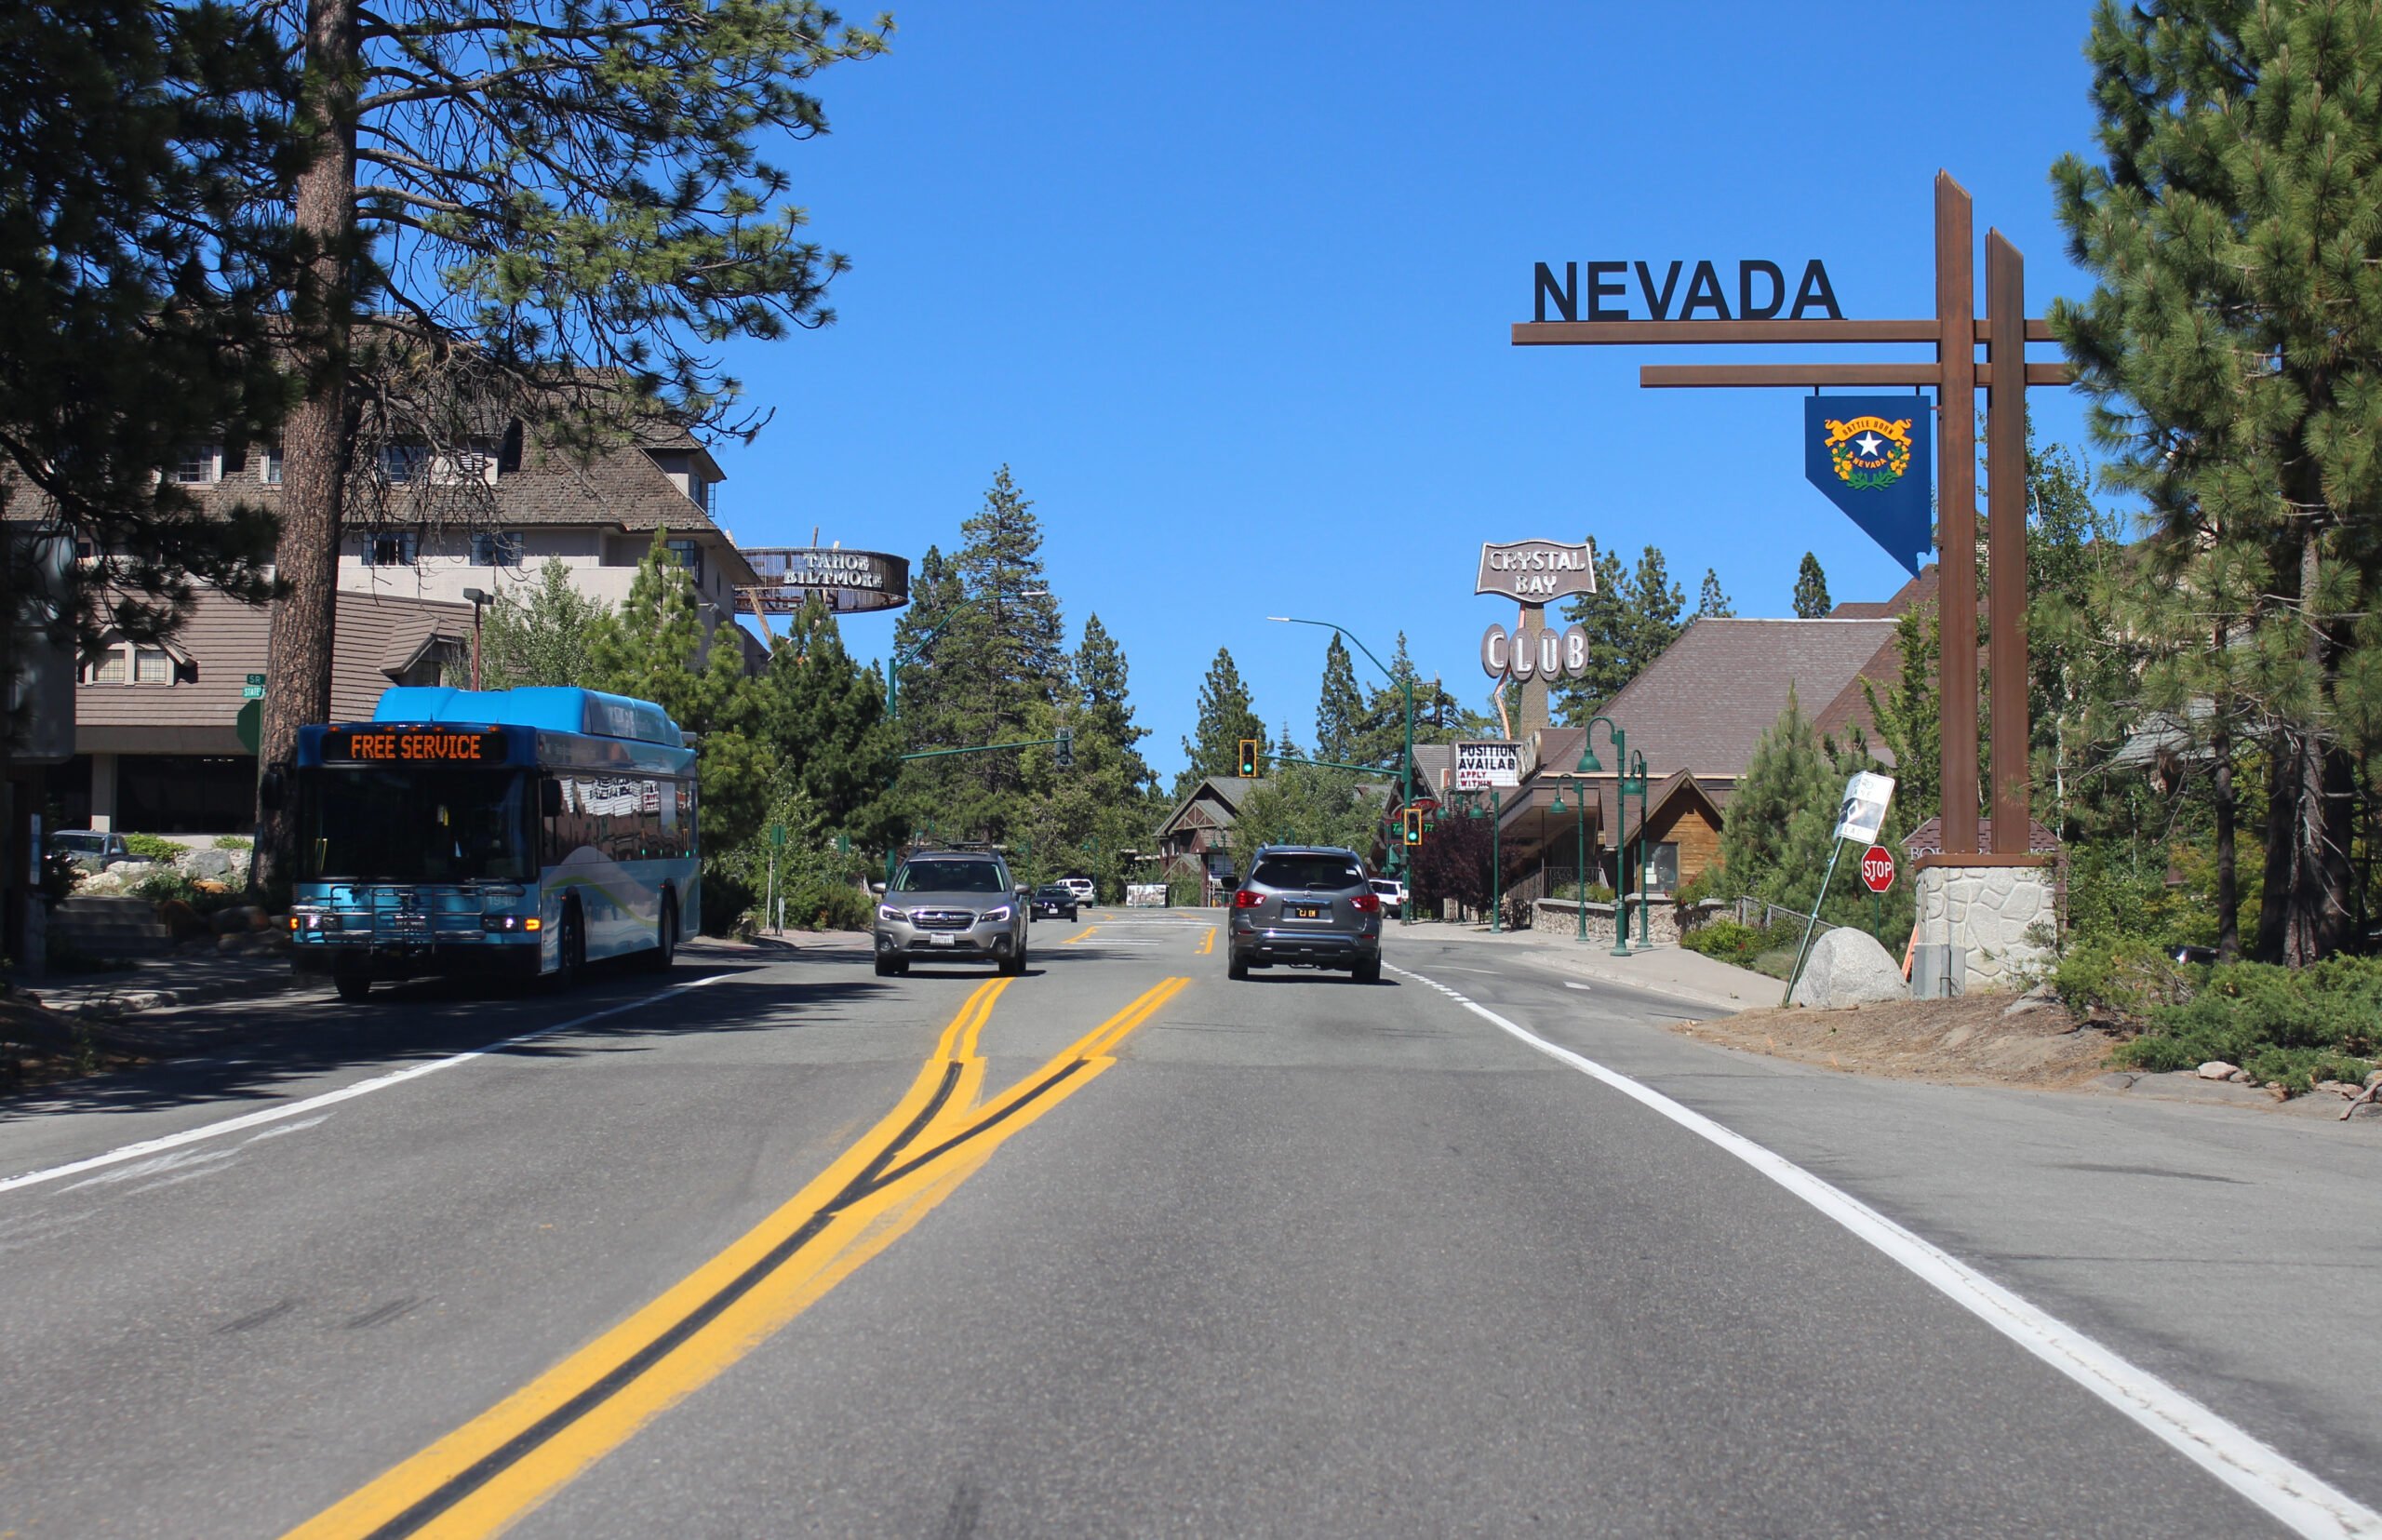
Crystal Bay is another Lake Tahoe jewel, perched on steep slopes with unmatched views and iconic estates. With limited buildable land, prices have climbed steadily for over a decade.
This area caters to high-end buyers and second-home owners who want lake access, privacy, and prestige. Supply remains tight, ensuring values stay high.
1. Zephyr Cove – 118% Home Price Increase Since 2010
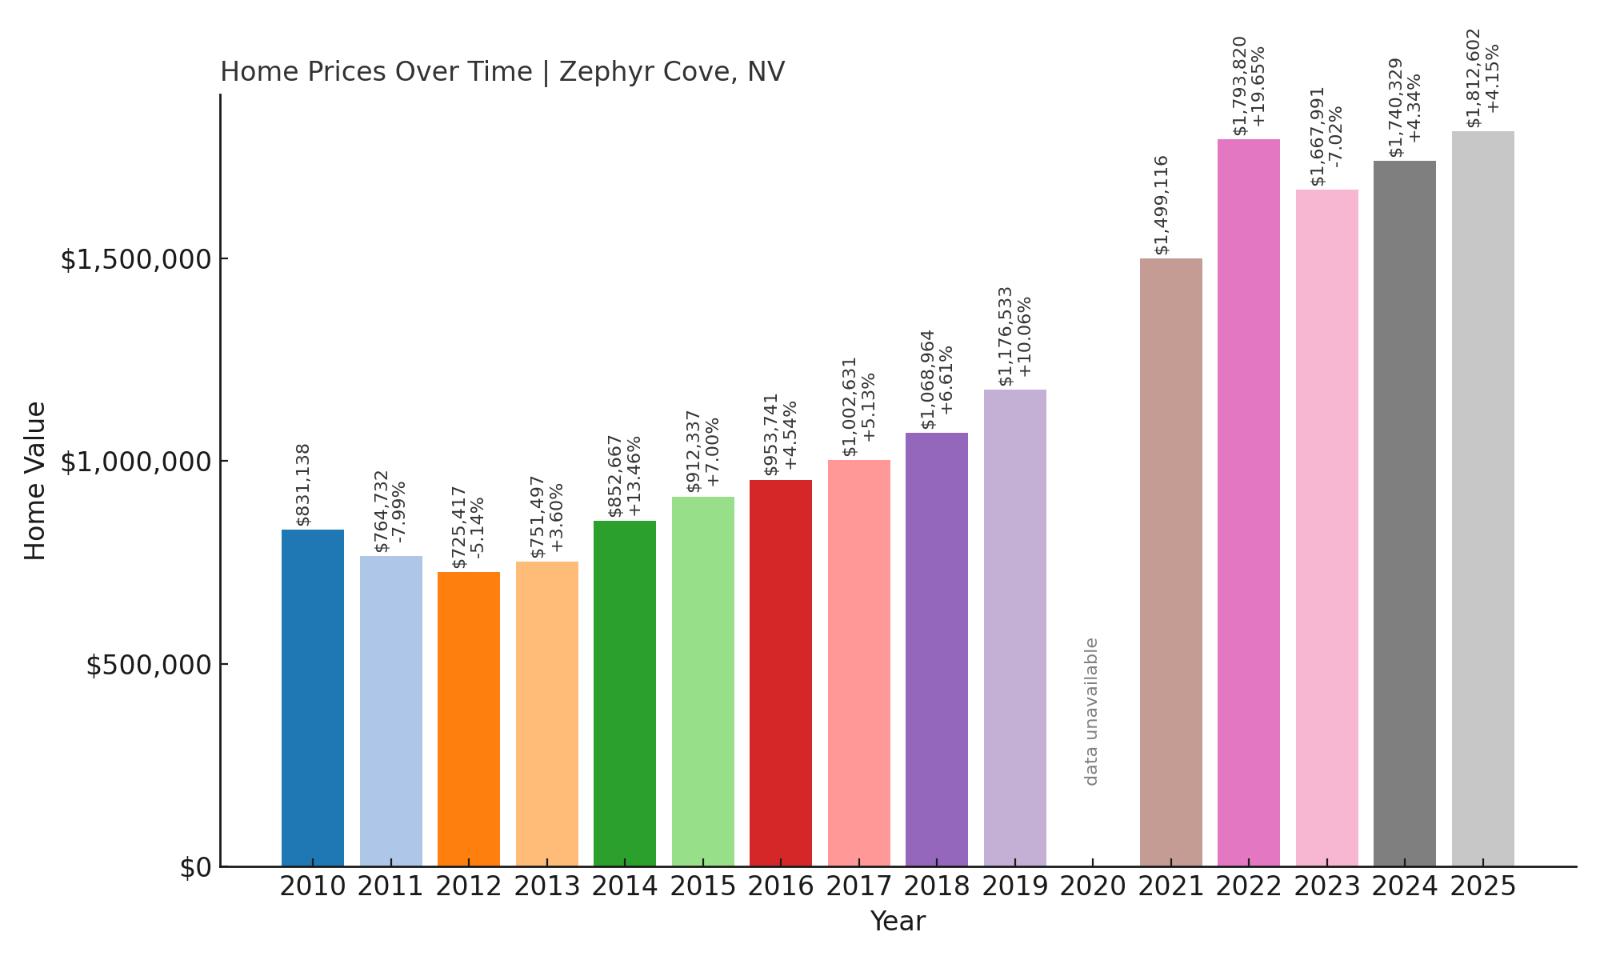
- 2010: $831,138
- 2011: $764,732 (-$66,406, -7.99% from previous year)
- 2012: $725,417 (-$39,315, -5.14% from previous year)
- 2013: $751,497 (+$26,080, +3.60% from previous year)
- 2014: $852,667 (+$101,170, +13.46% from previous year)
- 2015: $912,337 (+$59,670, +7.00% from previous year)
- 2016: $953,741 (+$41,404, +4.54% from previous year)
- 2017: $1,002,631 (+$48,890, +5.13% from previous year)
- 2018: $1,068,964 (+$66,333, +6.61% from previous year)
- 2019: $1,176,533 (+$107,569, +10.06% from previous year)
- 2021: $1,499,116
- 2022: $1,793,820 (+$294,704, +19.65% from previous year)
- 2023: $1,667,991 (-$125,829, -7.02% from previous year)
- 2024: $1,740,329 (+$72,338, +4.34% from previous year)
- 2025: $1,812,602 (+$72,273, +4.15% from previous year)
Zephyr Cove tops this list with a 118% increase since 2010. It saw massive appreciation in 2022 and has continued its upward trend despite brief cooling in 2023.
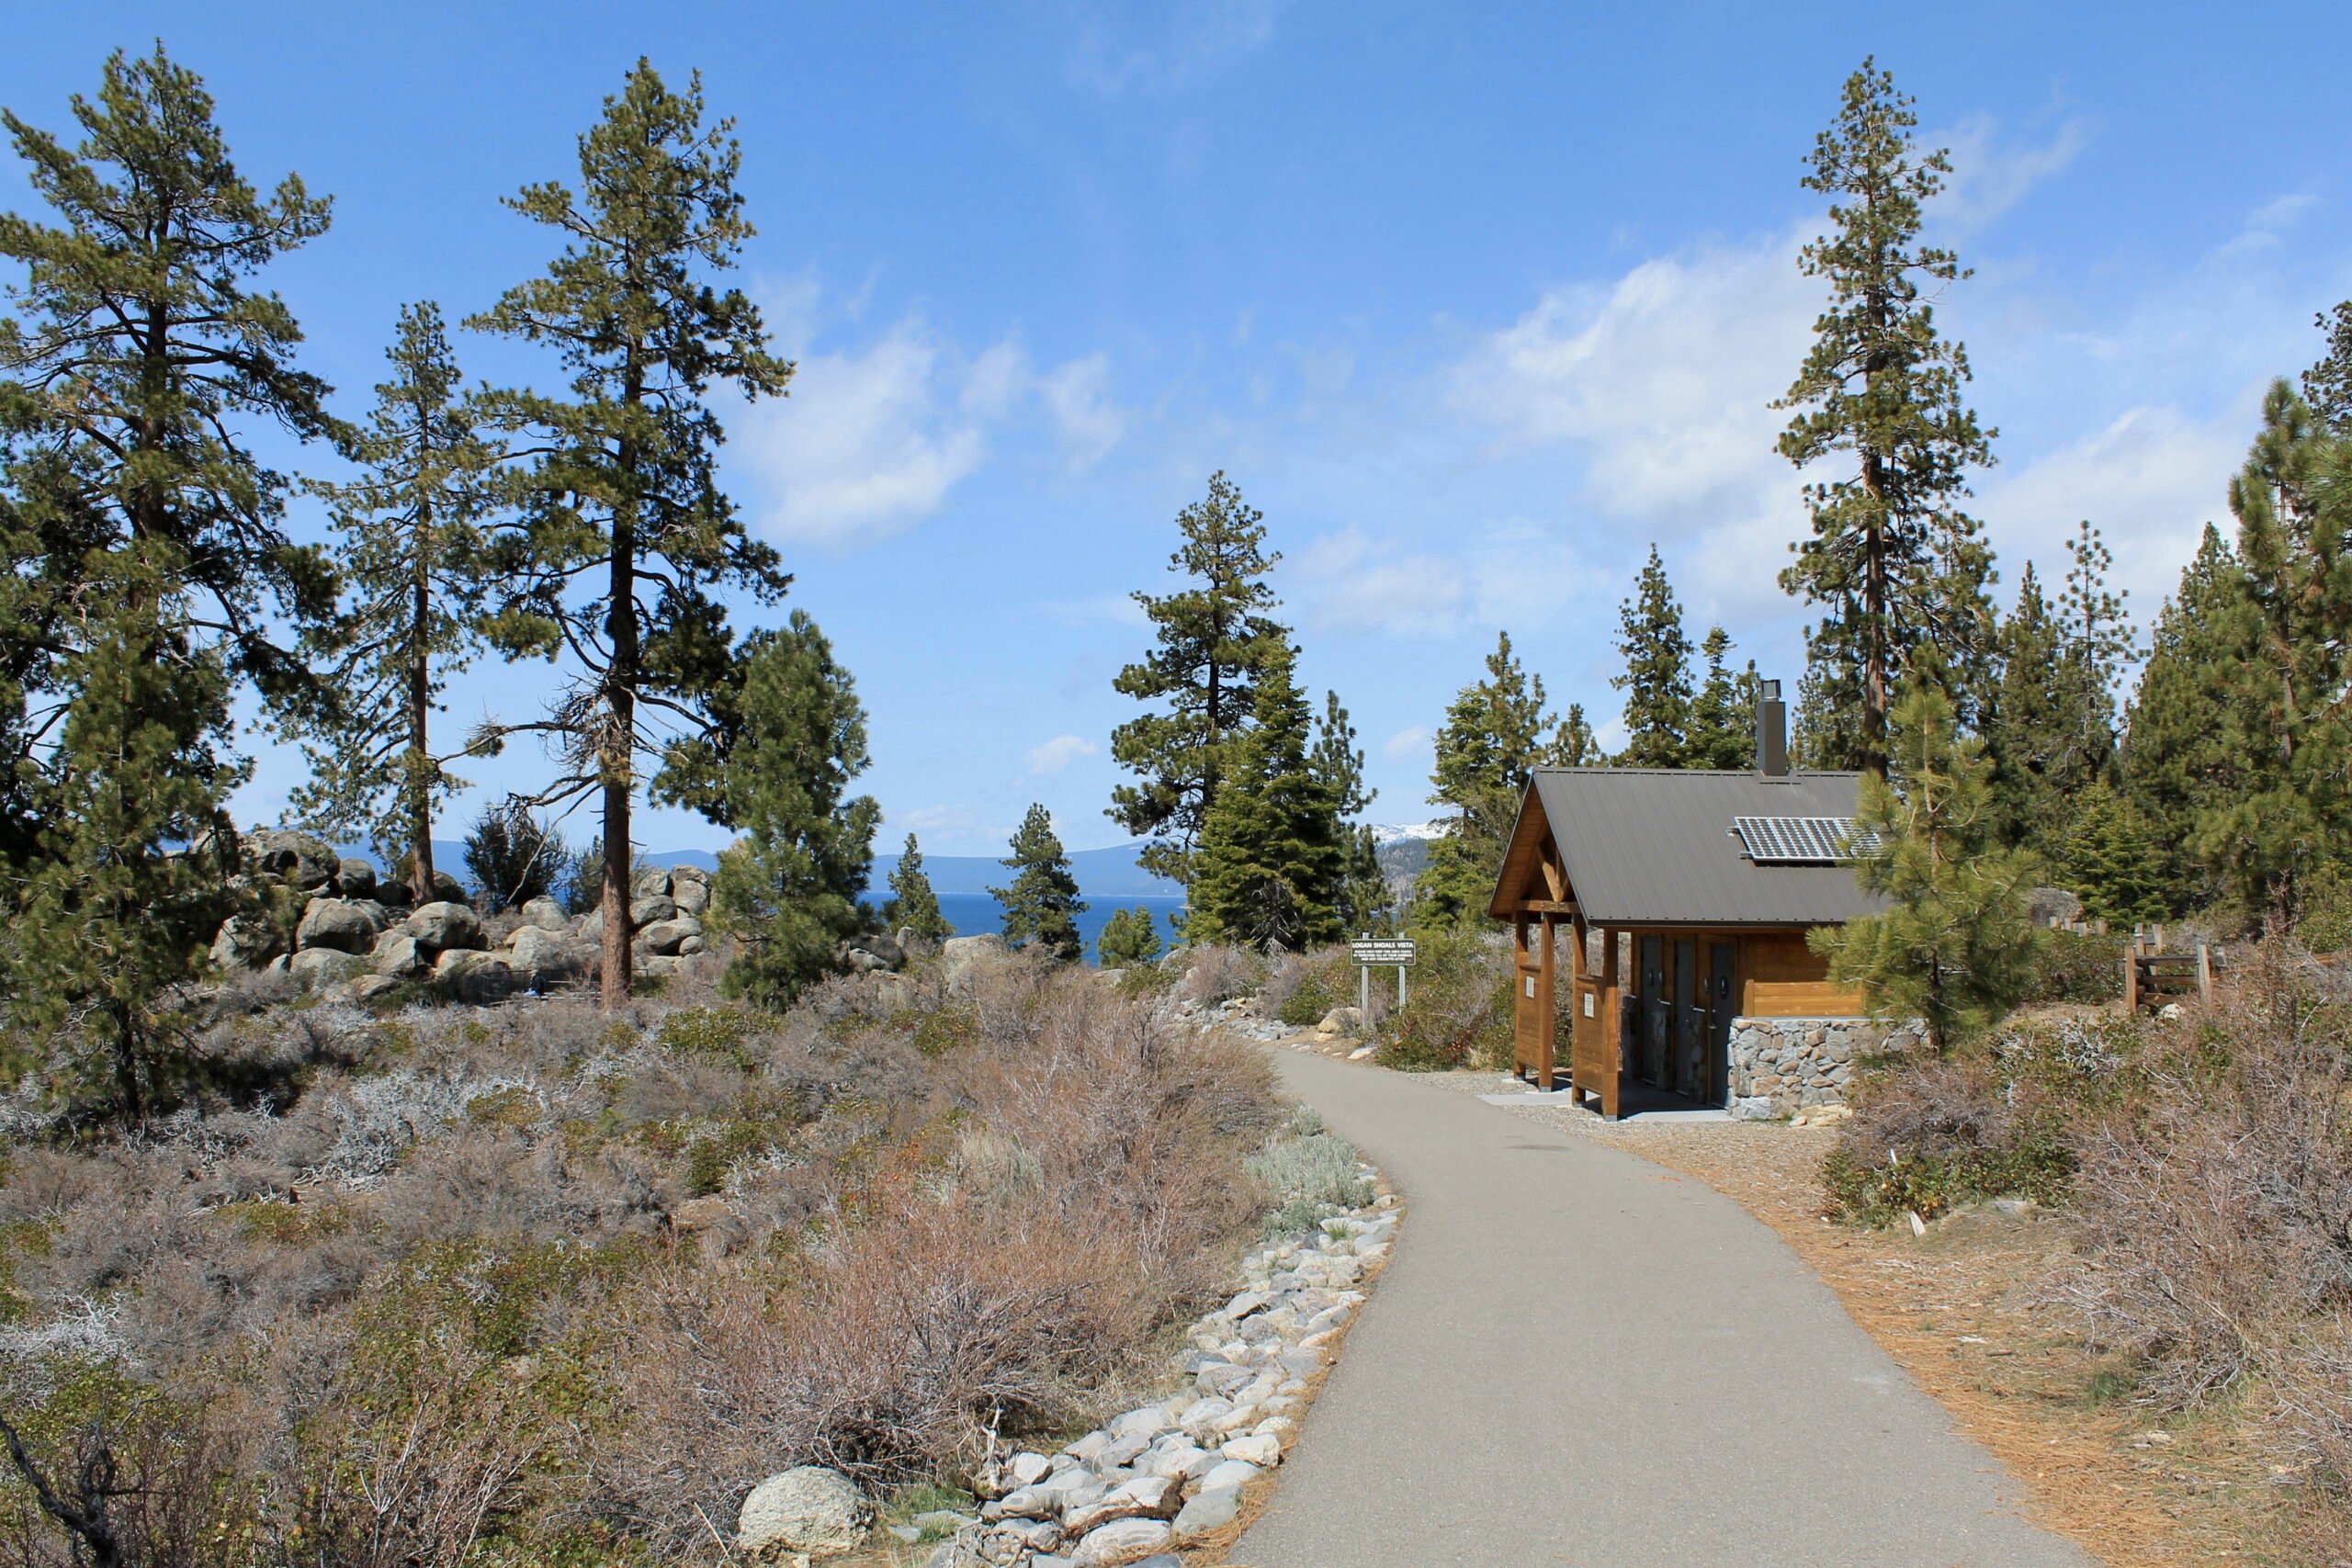
Zephyr Cove – The Pinnacle of Tahoe Luxury

Zephyr Cove is the crown jewel of Nevada’s Lake Tahoe towns. With private beaches, luxury homes, and postcard-worthy views, it’s the definition of premium real estate.
Its desirability among the ultra-wealthy, combined with limited housing inventory, keeps demand and prices extremely high. Even small homes in Zephyr Cove can fetch seven figures thanks to location alone.