🔥 Would you like to save this?
Washington’s most expensive towns aren’t just rich in views—they’re rich in property value too. According to the Zillow Home Value Index, 35 communities across the state now rank at the top for home prices in 2025. From waterfront enclaves to tech-fueled suburbs, these places reflect long-term growth, lifestyle demand, and real estate markets that never really cooled off. Some climbed fast, others stayed pricey all along—but all of them now carry the state’s biggest price tags.
35. Friday Harbor – 95% Home Price Increase Since 2010
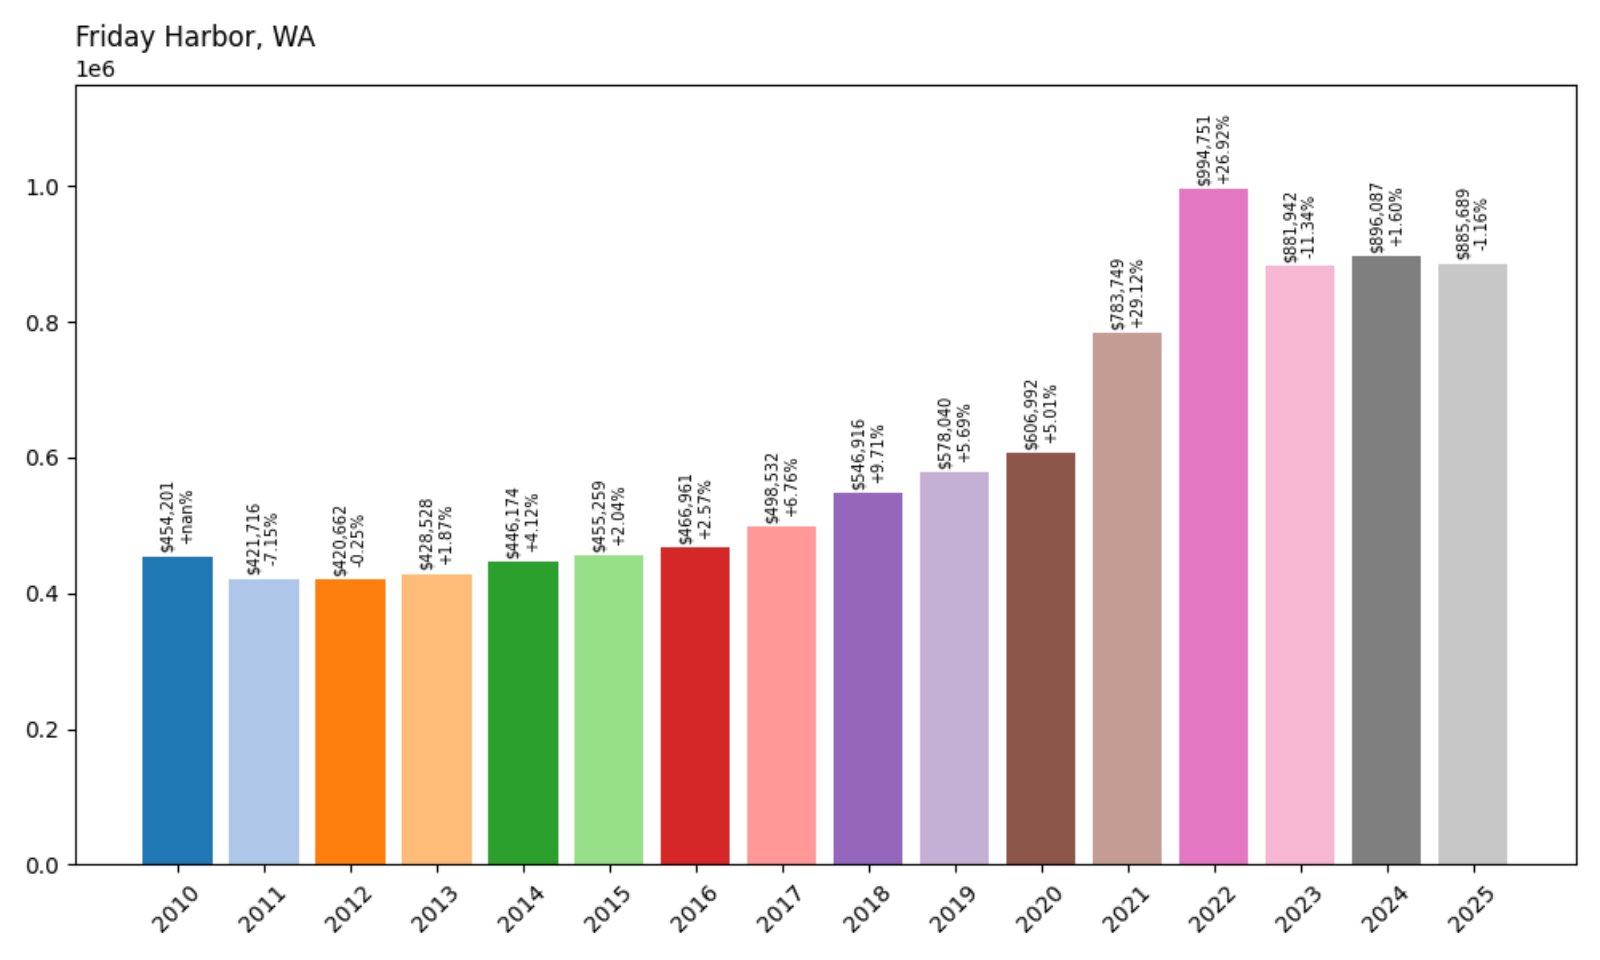
- 2010: $454,201
- 2011: $421,716 (−$32,485, −7.15%)
- 2012: $420,662 (−$1,054, −0.25%)
- 2013: $428,528 (+$7,866, +1.87%)
- 2014: $446,174 (+$17,645, +4.12%)
- 2015: $455,259 (+$9,085, +2.04%)
- 2016: $466,961 (+$11,702, +2.57%)
- 2017: $498,532 (+$31,571, +6.76%)
- 2018: $546,916 (+$48,384, +9.71%)
- 2019: $578,040 (+$31,124, +5.69%)
- 2020: $606,992 (+$28,952, +5.01%)
- 2021: $783,749 (+$176,757, +29.12%)
- 2022: $994,751 (+$211,002, +26.92%)
- 2023: $881,942 (−$112,809, −11.34%)
- 2024: $896,087 (+$14,145, +1.60%)
- 2025: $885,689 (−$10,398, −1.16%)
Friday Harbor home prices have nearly doubled since 2010, despite cooling slightly in the past two years. The biggest gains came between 2020 and 2022, when remote work fueled demand for scenic, less crowded areas. Though 2023 saw a drop, home values remain high, and the 2025 average still hovers near $886K — a strong showing for a remote island town.
In order to come up with the very specific design ideas, we create most designs with the assistance of state-of-the-art AI interior design software. Also, assume links that take you off the site are affiliate links such as links to Amazon. this means we may earn a commission if you buy something.
Friday Harbor – Island Living With Premium Appeal
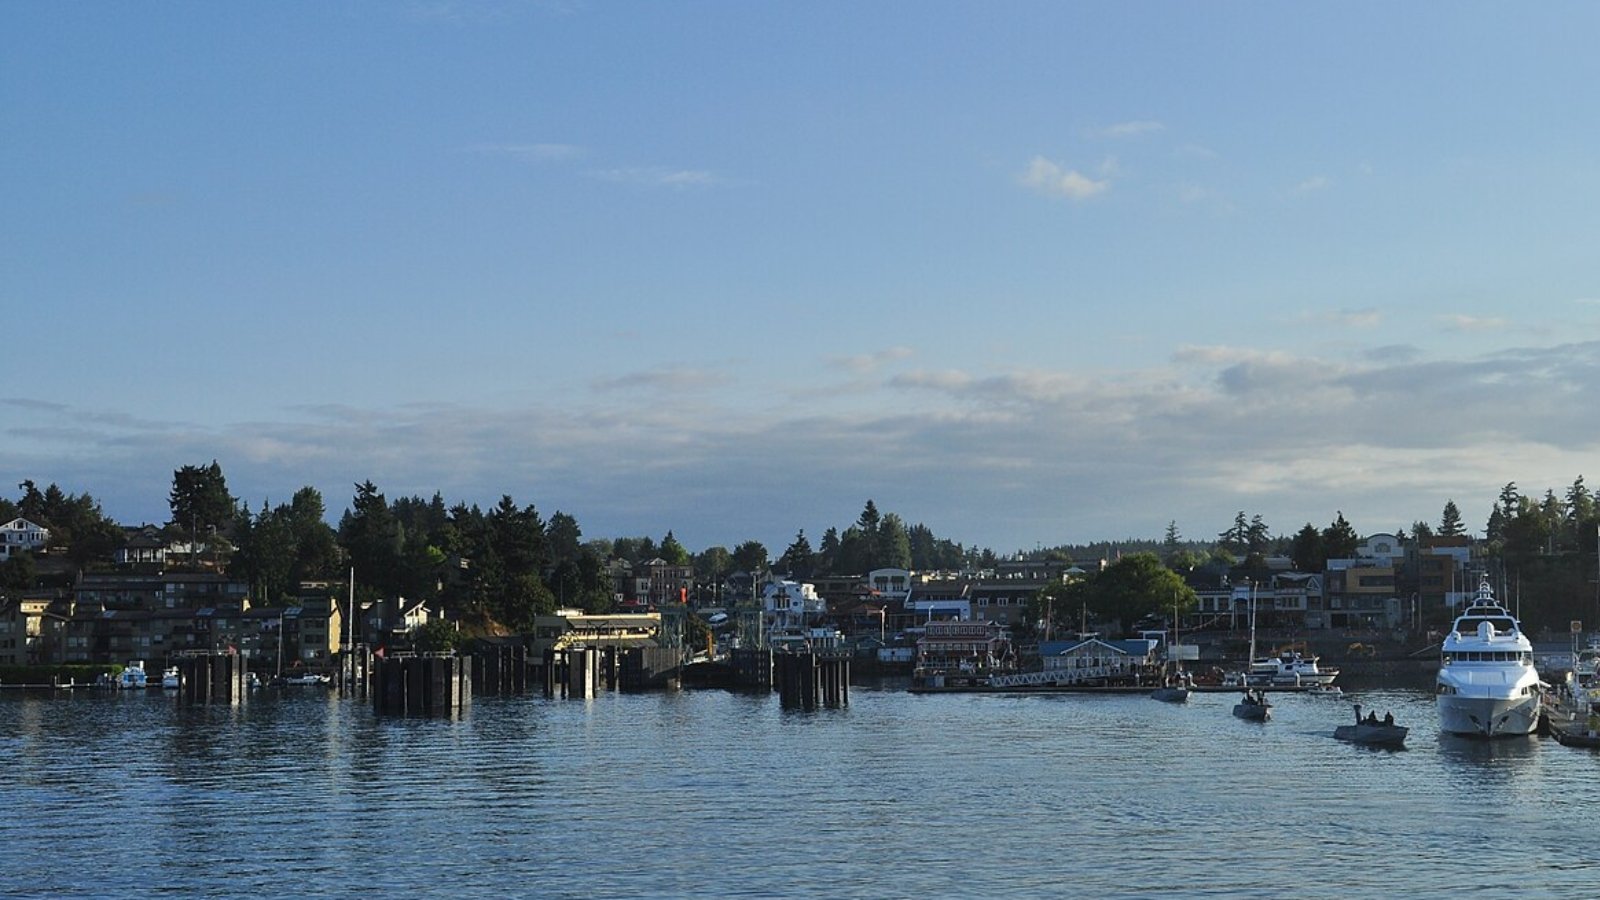
Located in the scenic San Juan Islands, Friday Harbor offers a peaceful lifestyle surrounded by natural beauty. The island is accessible by ferry, and its relative remoteness hasn’t slowed demand. Home prices rose sharply during the pandemic, driven by second-home buyers and retirees. Despite recent declines, the town remains among the priciest in Washington due to its exclusivity and limited housing supply.
The harbor itself is a draw for yachters and whale watchers alike, and the charming downtown features art galleries, local cafés, and waterfront views. There’s also a regional airport, which adds convenience for visitors and part-time residents. These amenities, paired with serene island life, help sustain high property values even as the broader market cools.
34. Eastsound – 95% Home Price Increase Since 2010
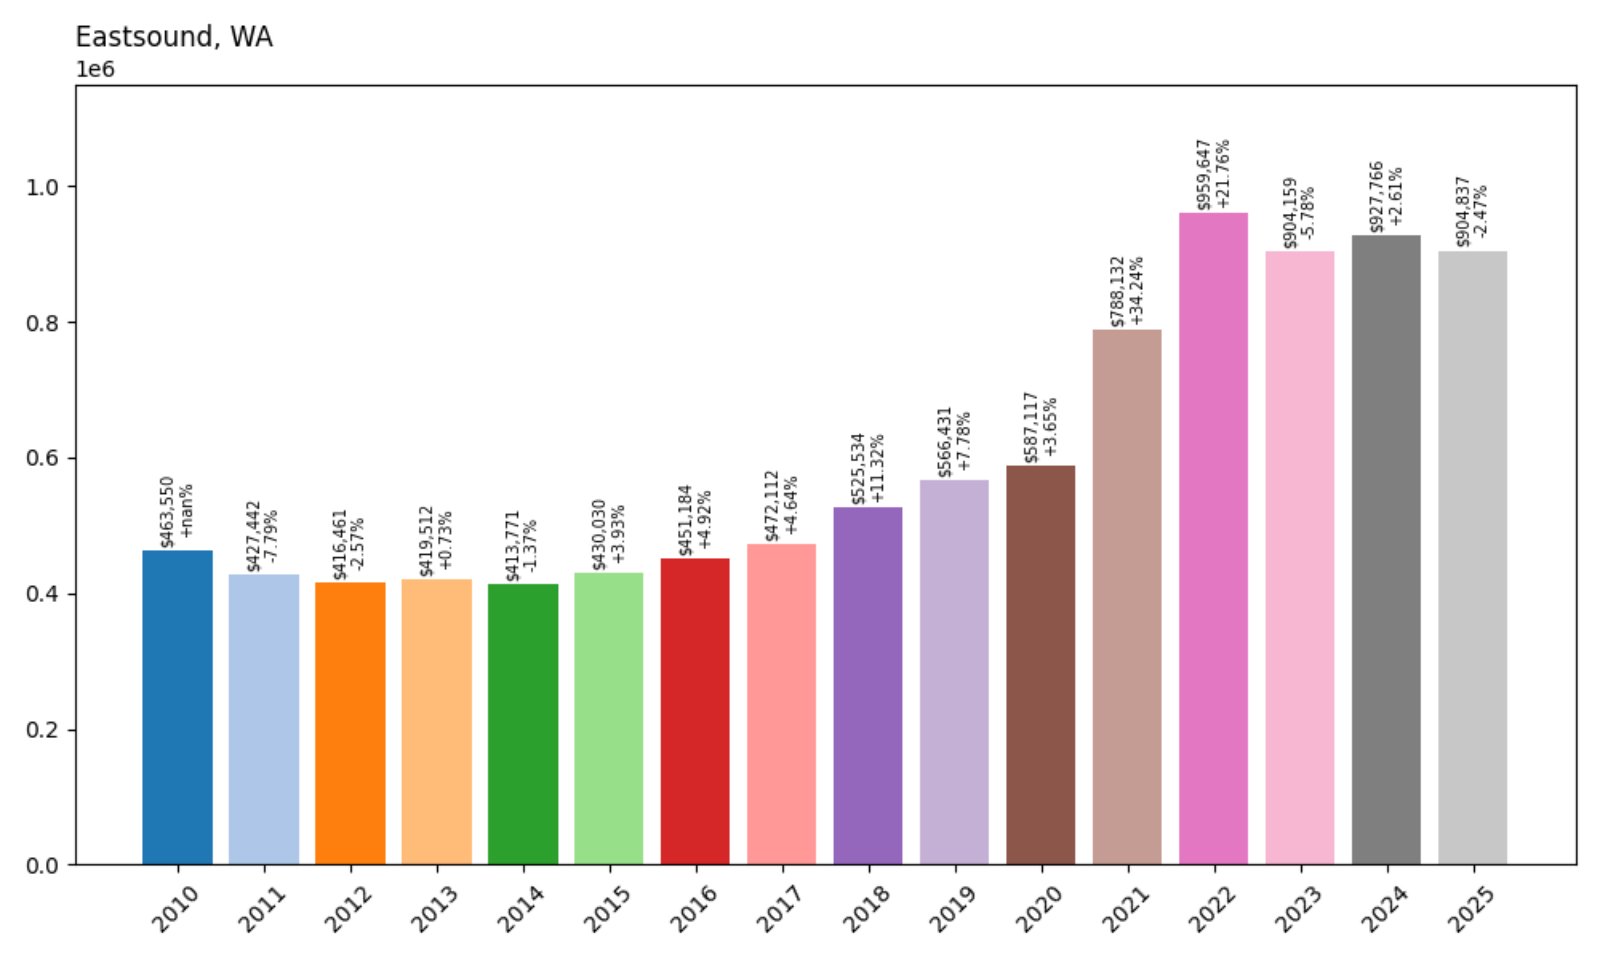
- 2010: $463,550
- 2011: $427,442 (−$36,108, −7.79%)
- 2012: $416,461 (−$10,981, −2.57%)
- 2013: $419,512 (+$3,051, +0.73%)
- 2014: $413,771 (−$5,742, −1.37%)
- 2015: $430,030 (+$16,259, +3.93%)
- 2016: $451,184 (+$21,154, +4.92%)
- 2017: $472,112 (+$20,928, +4.64%)
- 2018: $525,534 (+$53,423, +11.32%)
- 2019: $566,431 (+$40,897, +7.78%)
- 2020: $587,117 (+$20,686, +3.65%)
- 2021: $788,132 (+$201,015, +34.24%)
- 2022: $959,647 (+$171,515, +21.76%)
- 2023: $904,159 (−$55,489, −5.78%)
- 2024: $927,766 (+$23,607, +2.61%)
- 2025: $904,837 (−$22,929, −2.47%)
Since 2010, Eastsound’s home values have climbed steadily, nearly doubling by 2025. After peaking in 2022, prices tapered slightly, but the town has held onto most of its gains. At over $900K, the average home price remains well above the state median, signaling continued demand for this Orcas Island destination.
Eastsound – Orcas Island’s Pricey Heart
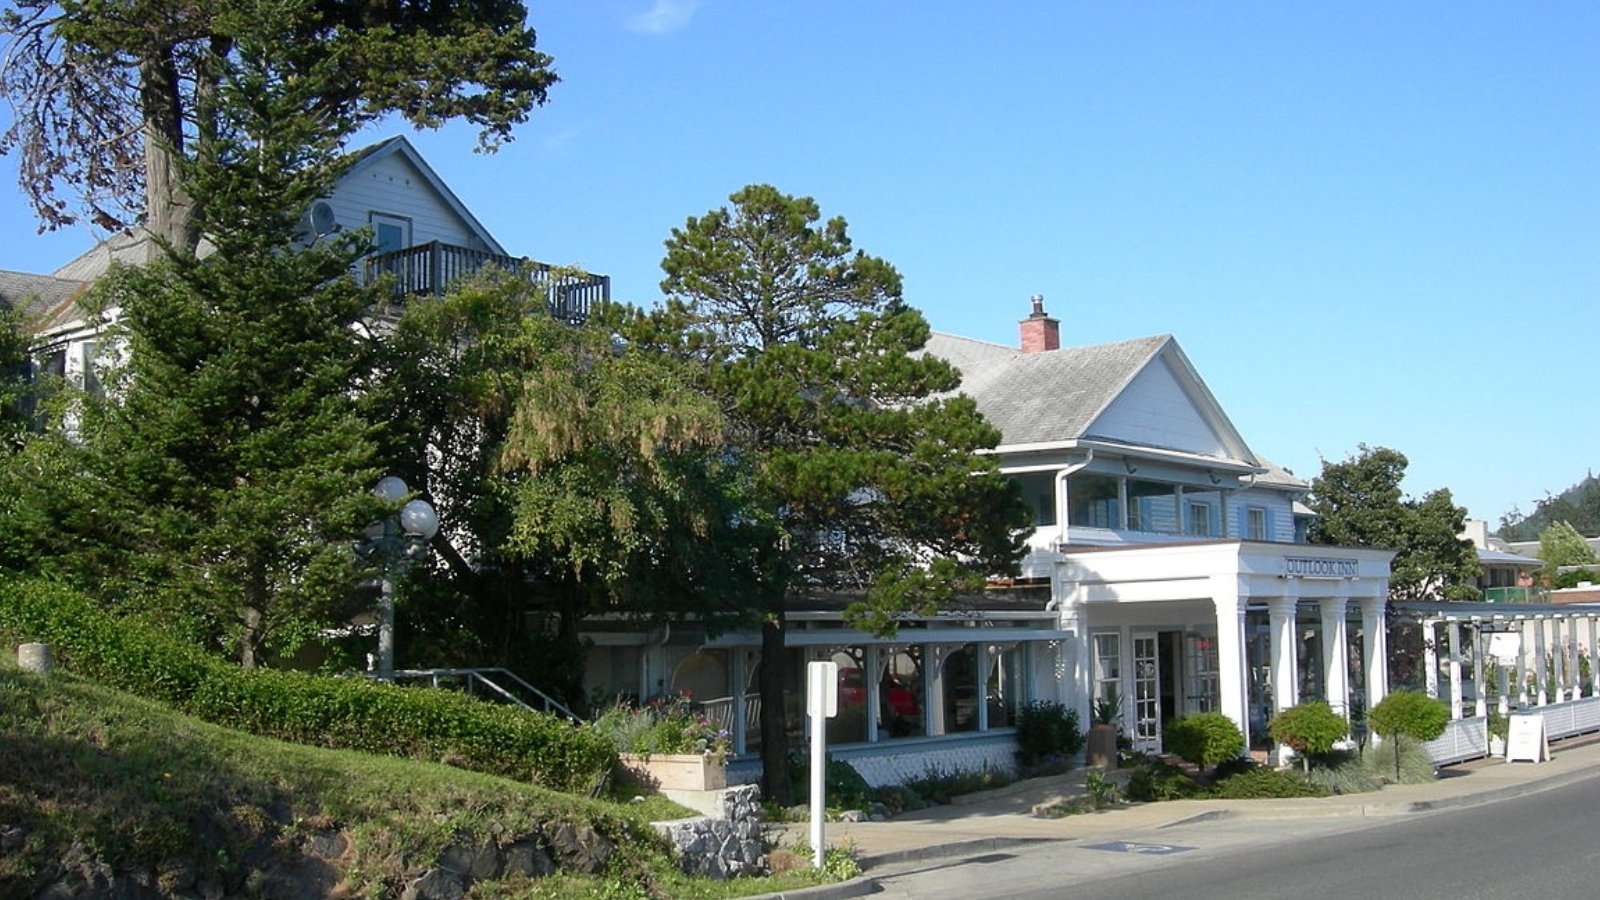
As the largest town on Orcas Island, Eastsound attracts buyers with its village charm, panoramic views, and proximity to outdoor adventures. Its housing market benefited from a post-2020 migration of remote workers and retirees seeking tranquility without giving up modern conveniences. The area’s tourism economy also supports year-round activity and income potential.
Limited inventory and strict development regulations contribute to high property values. Though the market cooled slightly in 2023–2025, Eastsound’s desirability remains strong, especially for second-home buyers. With ferry access and local art, dining, and music scenes, the town combines island seclusion with cultural vibrancy.
33. Ravensdale – 127% Home Price Increase Since 2010
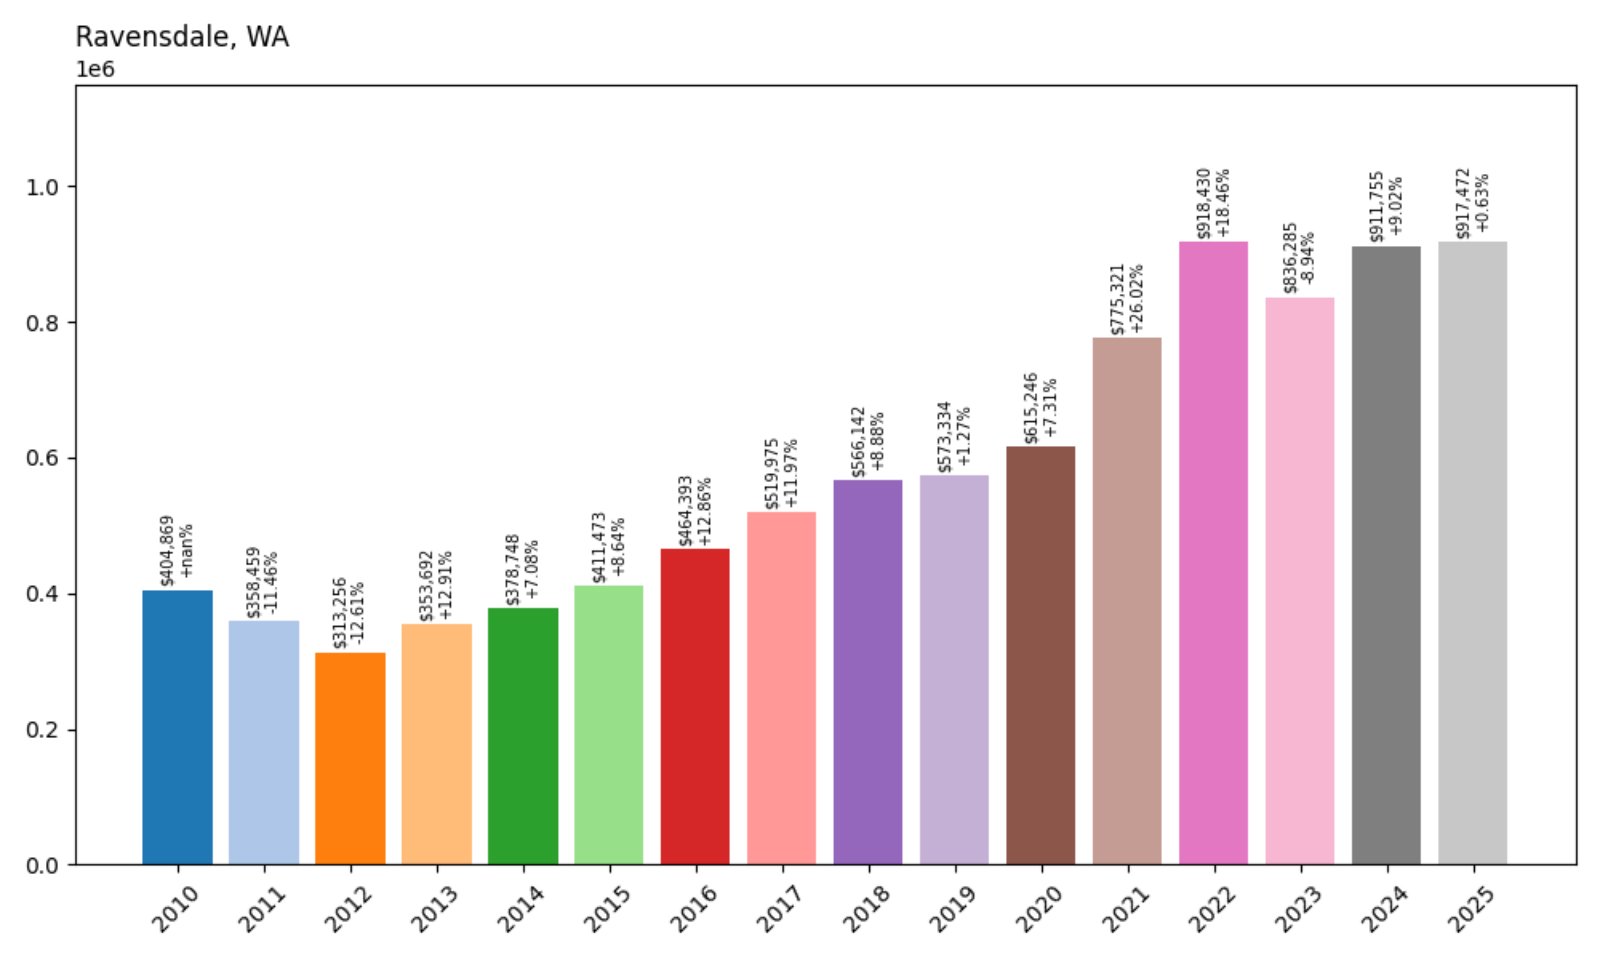
- 2010: $404,869
- 2011: $358,459 (−$46,410, −11.46%)
- 2012: $313,256 (−$45,203, −12.61%)
- 2013: $353,692 (+$40,436, +12.91%)
- 2014: $378,748 (+$25,057, +7.08%)
- 2015: $411,473 (+$32,725, +8.64%)
- 2016: $464,393 (+$52,920, +12.86%)
- 2017: $519,975 (+$55,583, +11.97%)
- 2018: $566,142 (+$46,167, +8.88%)
- 2019: $573,334 (+$7,192, +1.27%)
- 2020: $615,246 (+$41,912, +7.31%)
- 2021: $775,321 (+$160,075, +26.02%)
- 2022: $918,430 (+$143,109, +18.46%)
- 2023: $836,285 (−$82,145, −8.94%)
- 2024: $911,755 (+$75,471, +9.02%)
- 2025: $917,472 (+$5,717, +0.63%)
Ravensdale’s average home price has soared from just over $400K in 2010 to more than $917K in 2025. The town’s most explosive growth came between 2020 and 2022, with prices rising by over $300K in just two years. While 2023 brought a brief correction, prices rebounded steadily in 2024 and 2025.
Ravensdale – High-End Growth in the Cascade Foothills
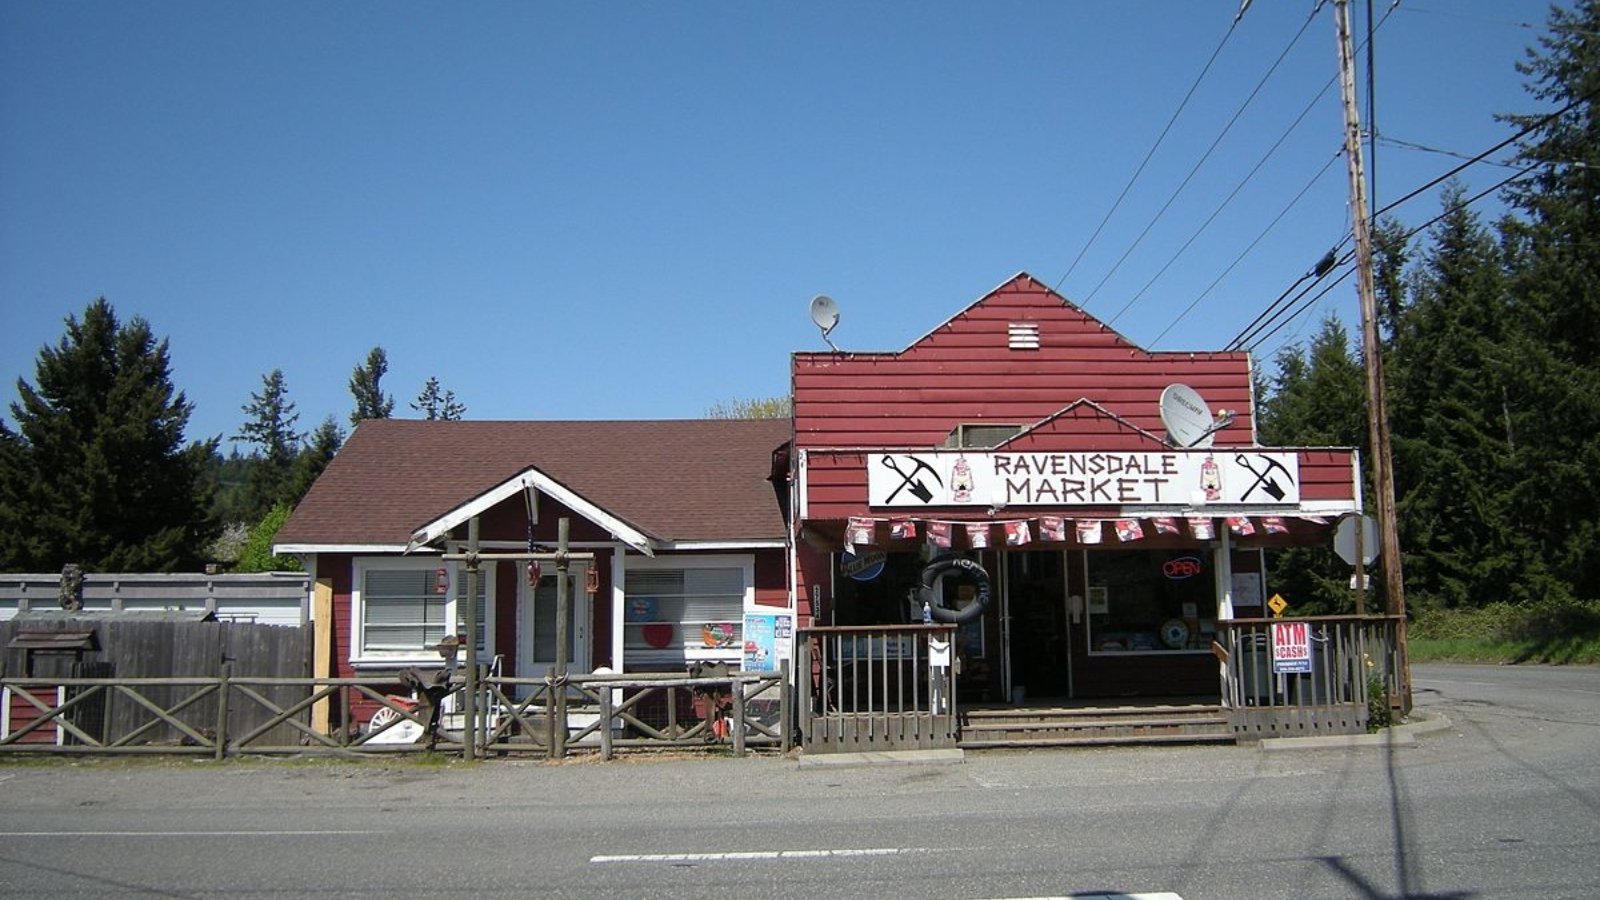
Set just southeast of Maple Valley, Ravensdale offers a semi-rural setting within commuting distance of the Seattle metro. Once an under-the-radar spot, it has gained attention from buyers seeking larger homes and land without sacrificing access to city amenities. As other King County towns saw housing costs surge, Ravensdale became a natural next stop.
The combination of scenic surroundings and a small-town feel makes it appealing to both growing families and professionals. The town sits near recreation areas like Lake Wilderness and the Cedar River watershed. With more space and newer housing developments, it’s no surprise prices have risen sharply in recent years.
32. Vashon – 104% Home Price Increase Since 2010
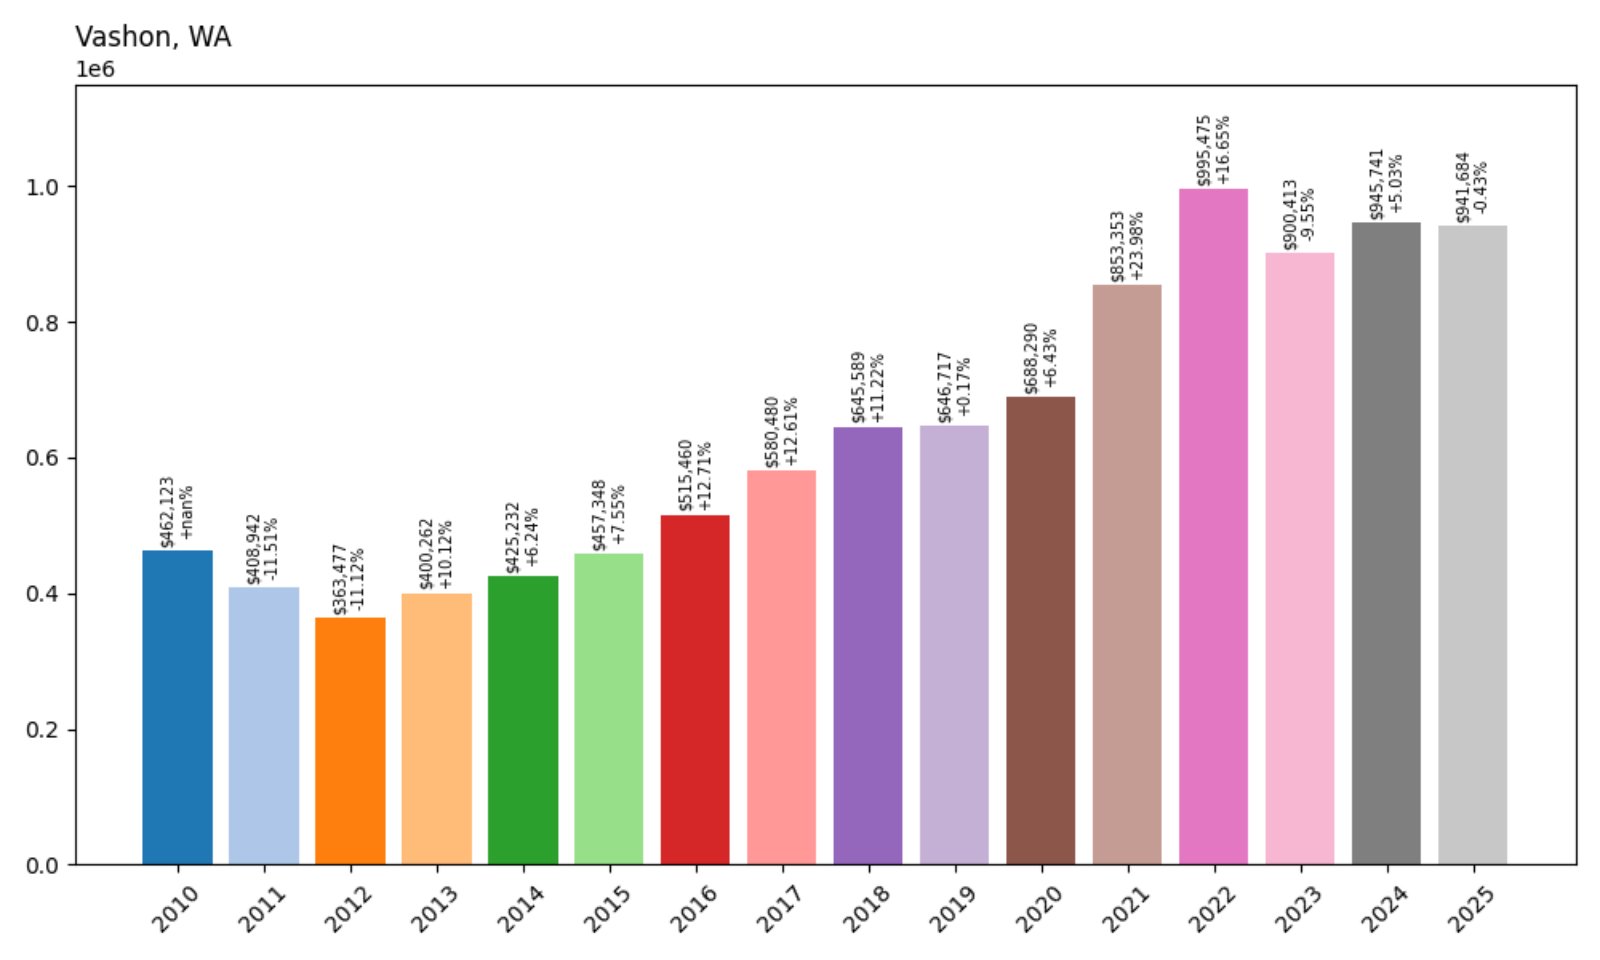
- 2010: $462,123
- 2011: $408,942 (−$53,182, −11.51%)
- 2012: $363,477 (−$45,465, −11.12%)
- 2013: $400,262 (+$36,785, +10.12%)
- 2014: $425,232 (+$24,970, +6.24%)
- 2015: $457,348 (+$32,115, +7.55%)
- 2016: $515,460 (+$58,112, +12.71%)
- 2017: $580,480 (+$65,021, +12.61%)
- 2018: $645,589 (+$65,109, +11.22%)
- 2019: $646,717 (+$1,127, +0.17%)
- 2020: $688,290 (+$41,574, +6.43%)
- 2021: $853,353 (+$165,062, +23.98%)
- 2022: $995,475 (+$142,123, +16.65%)
- 2023: $900,413 (−$95,062, −9.55%)
- 2024: $945,741 (+$45,327, +5.03%)
- 2025: $941,684 (−$4,057, −0.43%)
Vashon home prices have more than doubled since 2010, rising from $462K to over $941K in 2025. Though the market cooled in 2023, prices remain well above their pre-pandemic levels, and the town continues to appeal to those seeking both privacy and community.
Vashon – A Unique Island With Persistent Demand
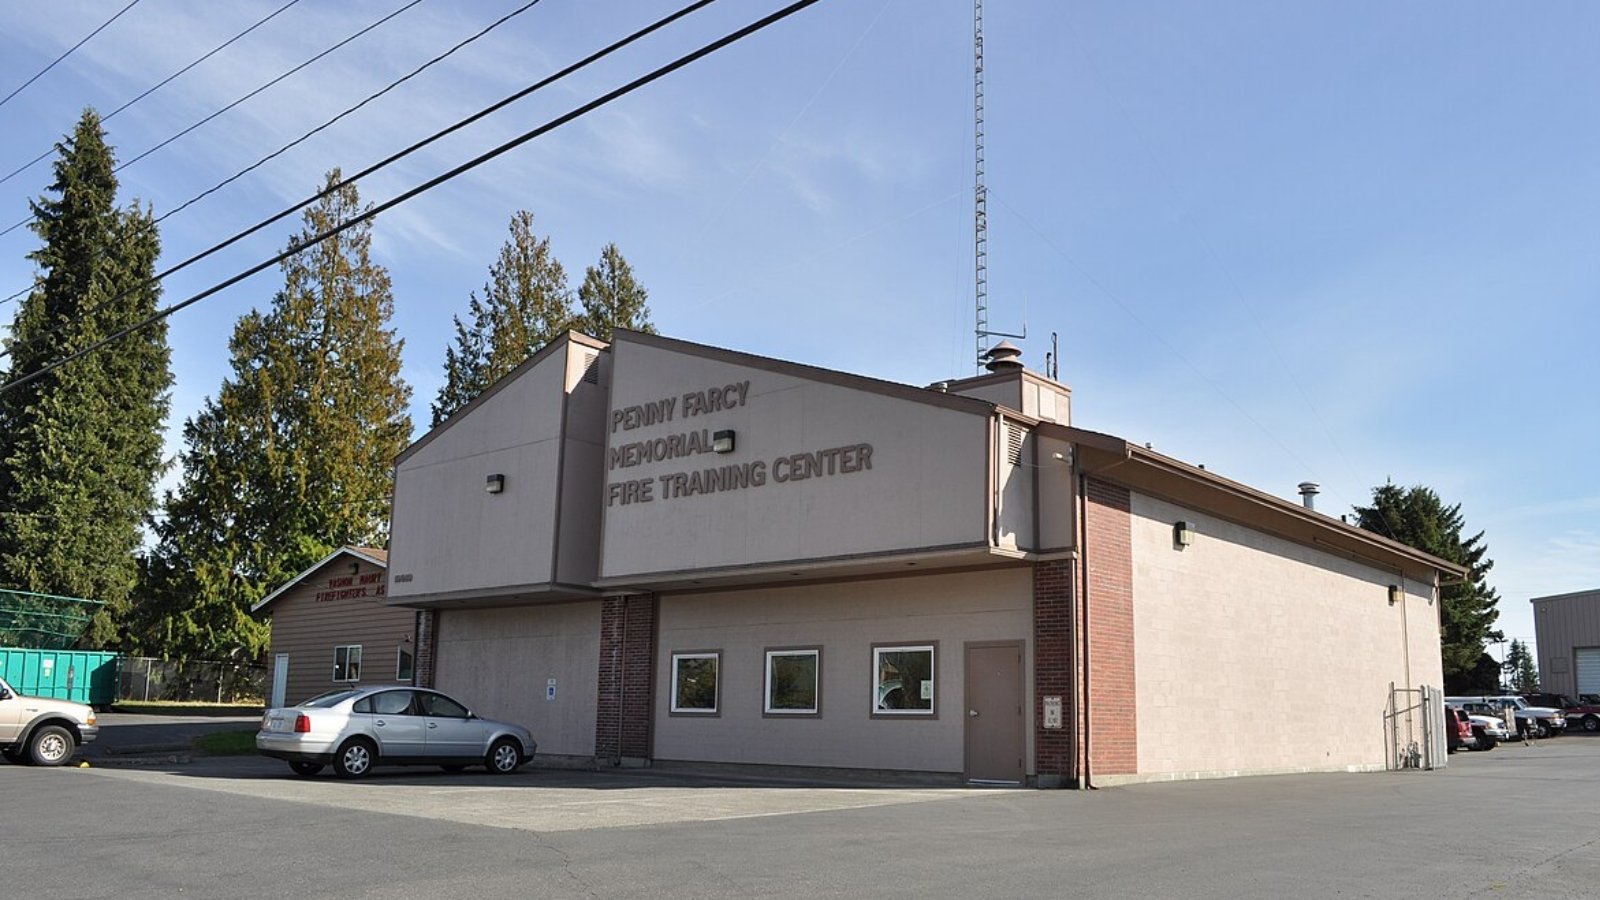
Accessible only by ferry, Vashon Island blends rural charm with close proximity to Seattle and Tacoma. The town has long attracted artists, farmers, and remote professionals. Its lack of bridges has preserved its small-town feel, even as demand pushed prices skyward.
Buyers often seek out Vashon for its slower pace, strong community ties, and scenic waterfront properties. With limited housing stock and high interest in sustainable living, the area remains a premium market despite slight recent declines. Vashon’s character-rich homes and environmental focus help keep prices resilient.
31. Mukilteo – 139% Home Price Increase Since 2010
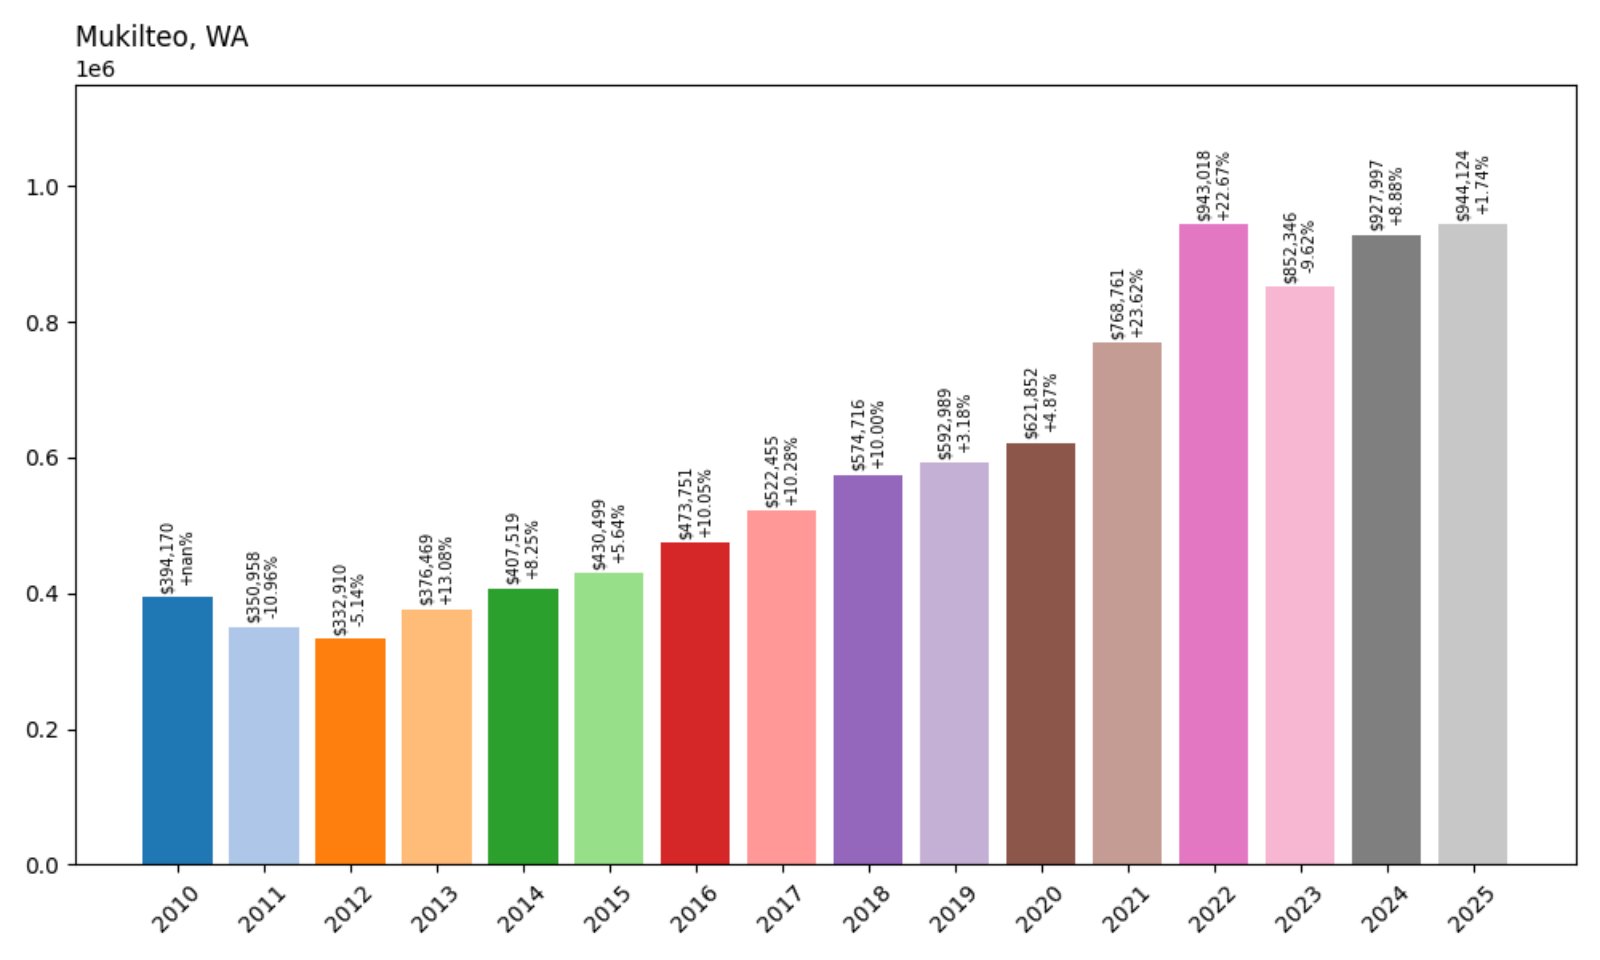
- 2010: $394,170
- 2011: $350,958 (−$43,212, −10.96%)
- 2012: $332,910 (−$18,047, −5.14%)
- 2013: $376,469 (+$43,559, +13.08%)
- 2014: $407,519 (+$31,049, +8.25%)
- 2015: $430,499 (+$22,981, +5.64%)
- 2016: $473,751 (+$43,252, +10.05%)
- 2017: $522,455 (+$48,704, +10.28%)
- 2018: $574,716 (+$52,260, +10.00%)
- 2019: $592,989 (+$18,273, +3.18%)
- 2020: $621,852 (+$28,863, +4.87%)
- 2021: $768,761 (+$146,909, +23.62%)
- 2022: $943,018 (+$174,257, +22.67%)
- 2023: $852,346 (−$90,673, −9.62%)
- 2024: $927,997 (+$75,651, +8.88%)
- 2025: $944,124 (+$16,127, +1.74%)
Home values in Mukilteo have more than doubled since 2010, with steady gains across most years and a significant surge in the early 2020s. Despite a drop in 2023, prices recovered strongly in 2024 and edged up again in 2025, bringing the average home value to just over $944K.
Mukilteo – Puget Sound Views Drive Long-Term Growth
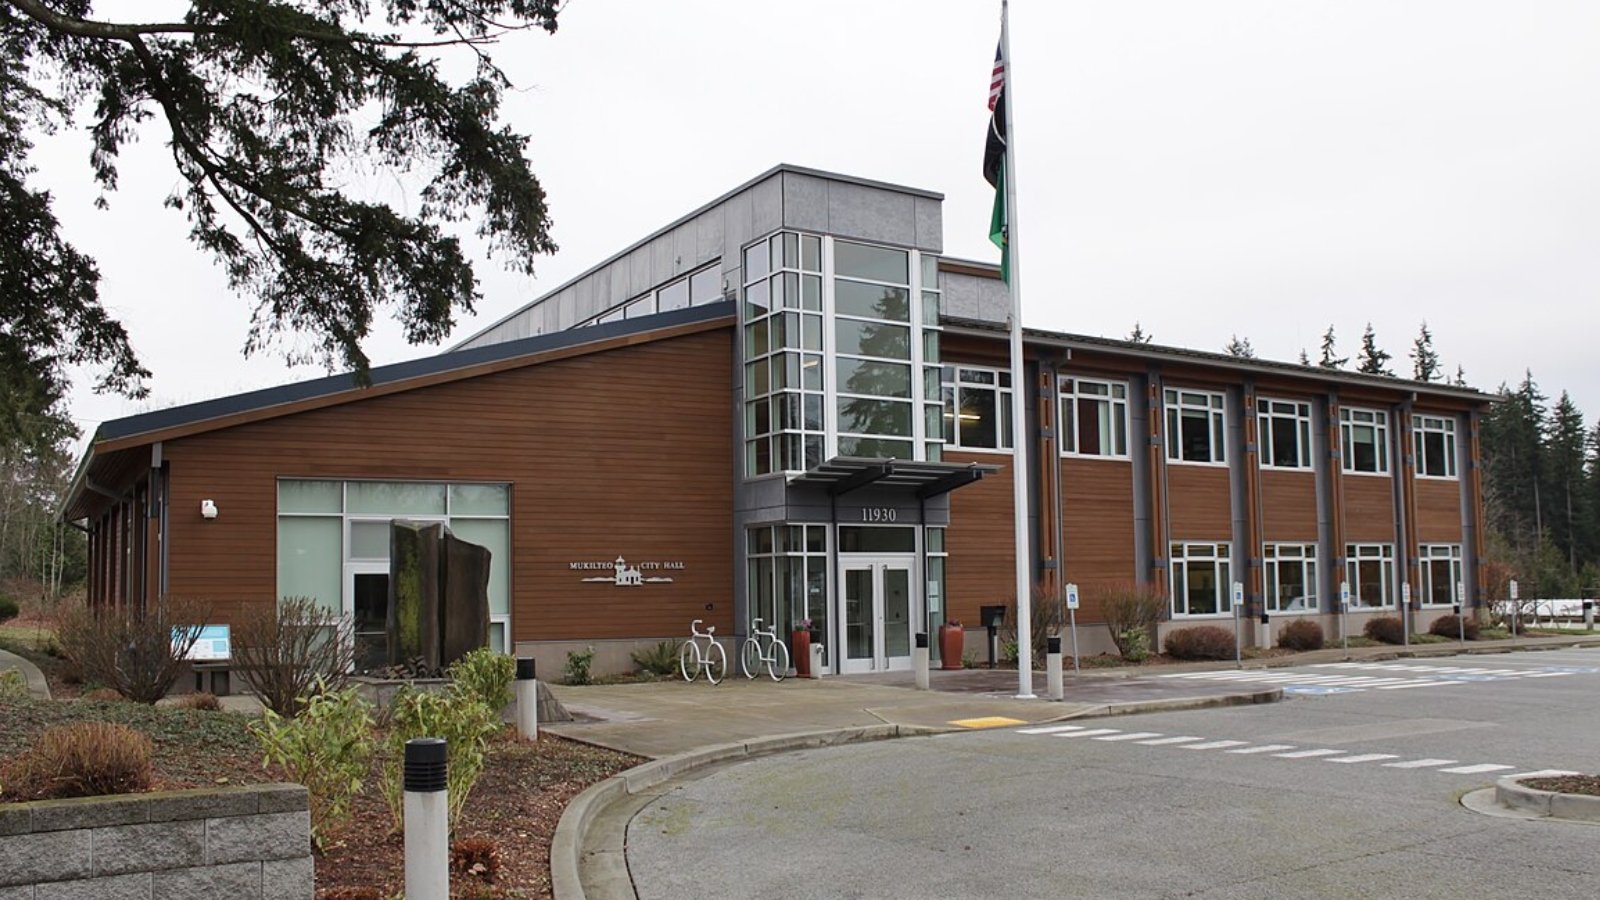
Perched along the shores of Puget Sound, Mukilteo has long drawn attention for its ferry terminal, waterfront parks, and proximity to major employers like Boeing. The city offers scenic views, excellent schools, and convenient commuter access to Everett and Seattle, which helps sustain real estate demand.
In recent years, price growth was especially strong as more buyers looked for suburban homes with water access. Mukilteo’s historic lighthouse park, recreational trails, and strong public amenities make it an attractive long-term investment. Its relatively high prices reflect that demand — and show no signs of retreating in 2025.
30. Edmonds – 161% Home Price Increase Since 2010
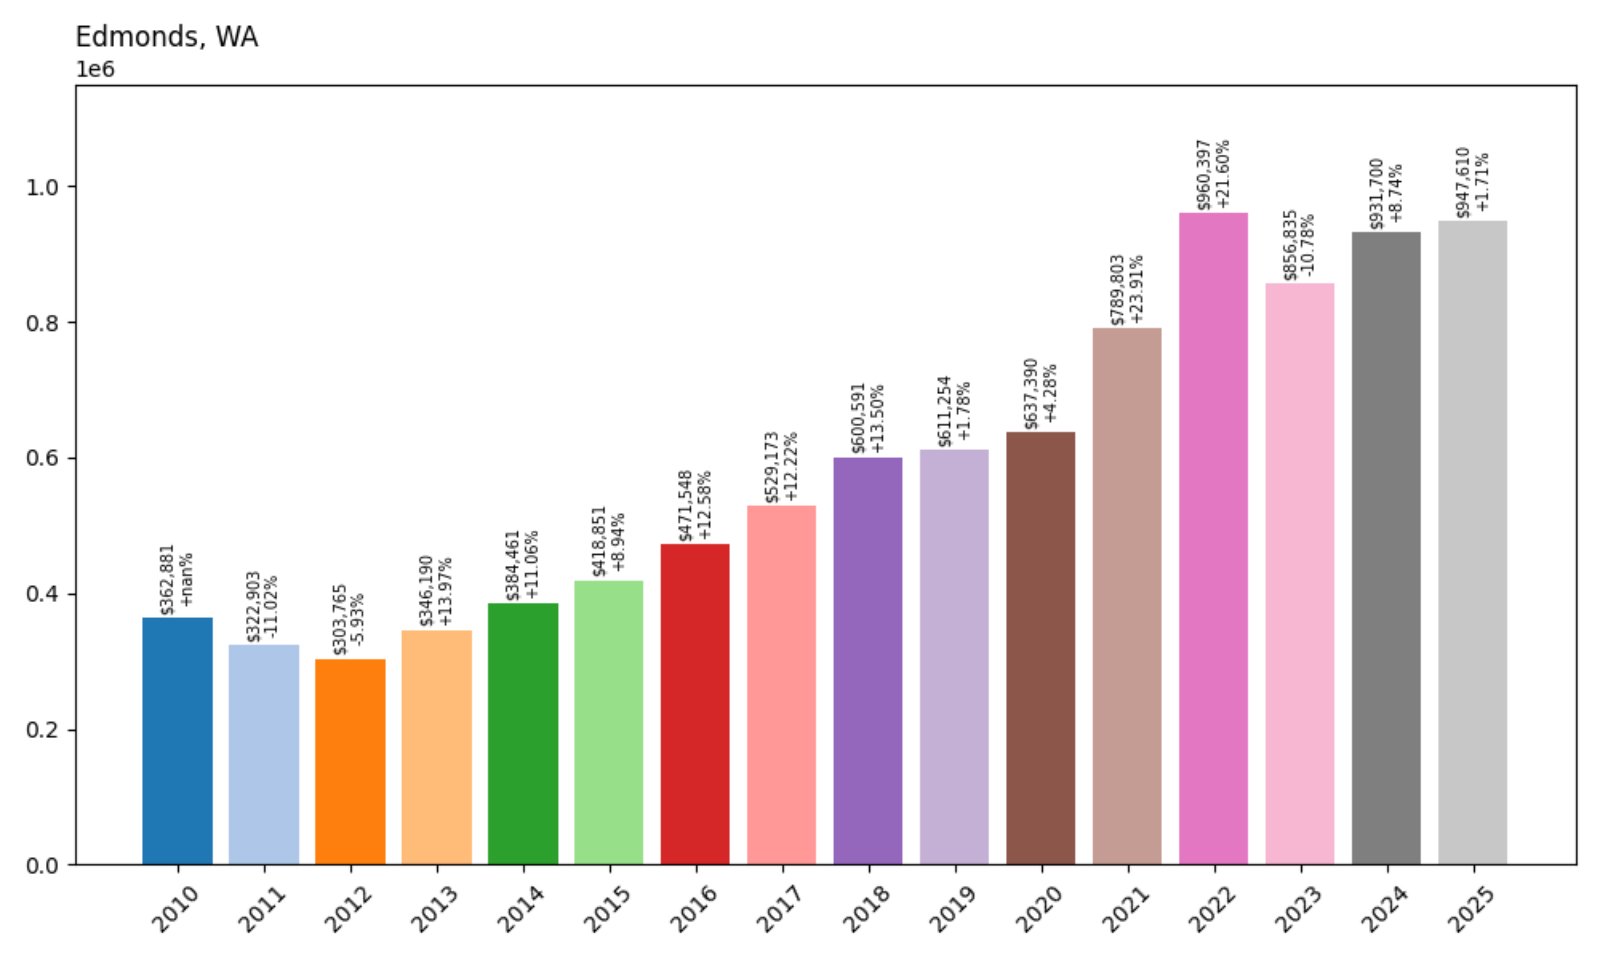
- 2010: $362,881
- 2011: $322,903 (−$39,978, −11.02%)
- 2012: $303,765 (−$19,138, −5.93%)
- 2013: $346,190 (+$42,425, +13.97%)
- 2014: $384,461 (+$38,272, +11.06%)
- 2015: $418,851 (+$34,390, +8.94%)
- 2016: $471,548 (+$52,697, +12.58%)
- 2017: $529,173 (+$57,625, +12.22%)
- 2018: $600,591 (+$71,418, +13.50%)
- 2019: $611,254 (+$10,663, +1.78%)
- 2020: $637,390 (+$26,136, +4.28%)
- 2021: $789,803 (+$152,413, +23.91%)
- 2022: $960,397 (+$170,595, +21.60%)
- 2023: $856,835 (−$103,562, −10.78%)
- 2024: $931,700 (+$74,864, +8.74%)
- 2025: $947,610 (+$15,911, +1.71%)
Edmonds home prices have surged by over 160% since 2010, thanks to consistent demand and desirable waterfront access. While the market adjusted in 2023, it rebounded in the two years that followed. The average home now costs nearly $948K, reflecting the town’s premium market position.
Edmonds – A Coastal Hub With Lasting Buyer Interest

Edmonds has carved out a niche as one of the most desirable coastal suburbs near Seattle. With sweeping views of the Olympic Mountains, walkable downtown streets, and a busy ferry terminal, it offers a small-town feel with strong transportation links. This accessibility makes it a magnet for both commuters and retirees.
Real estate in Edmonds benefits from the town’s mix of culture and scenery — including its marina, art galleries, and well-known farmer’s market. The market saw a dip in 2023, but values recovered quickly due to limited inventory and sustained interest in view properties. Its location and amenities continue to command top dollar.
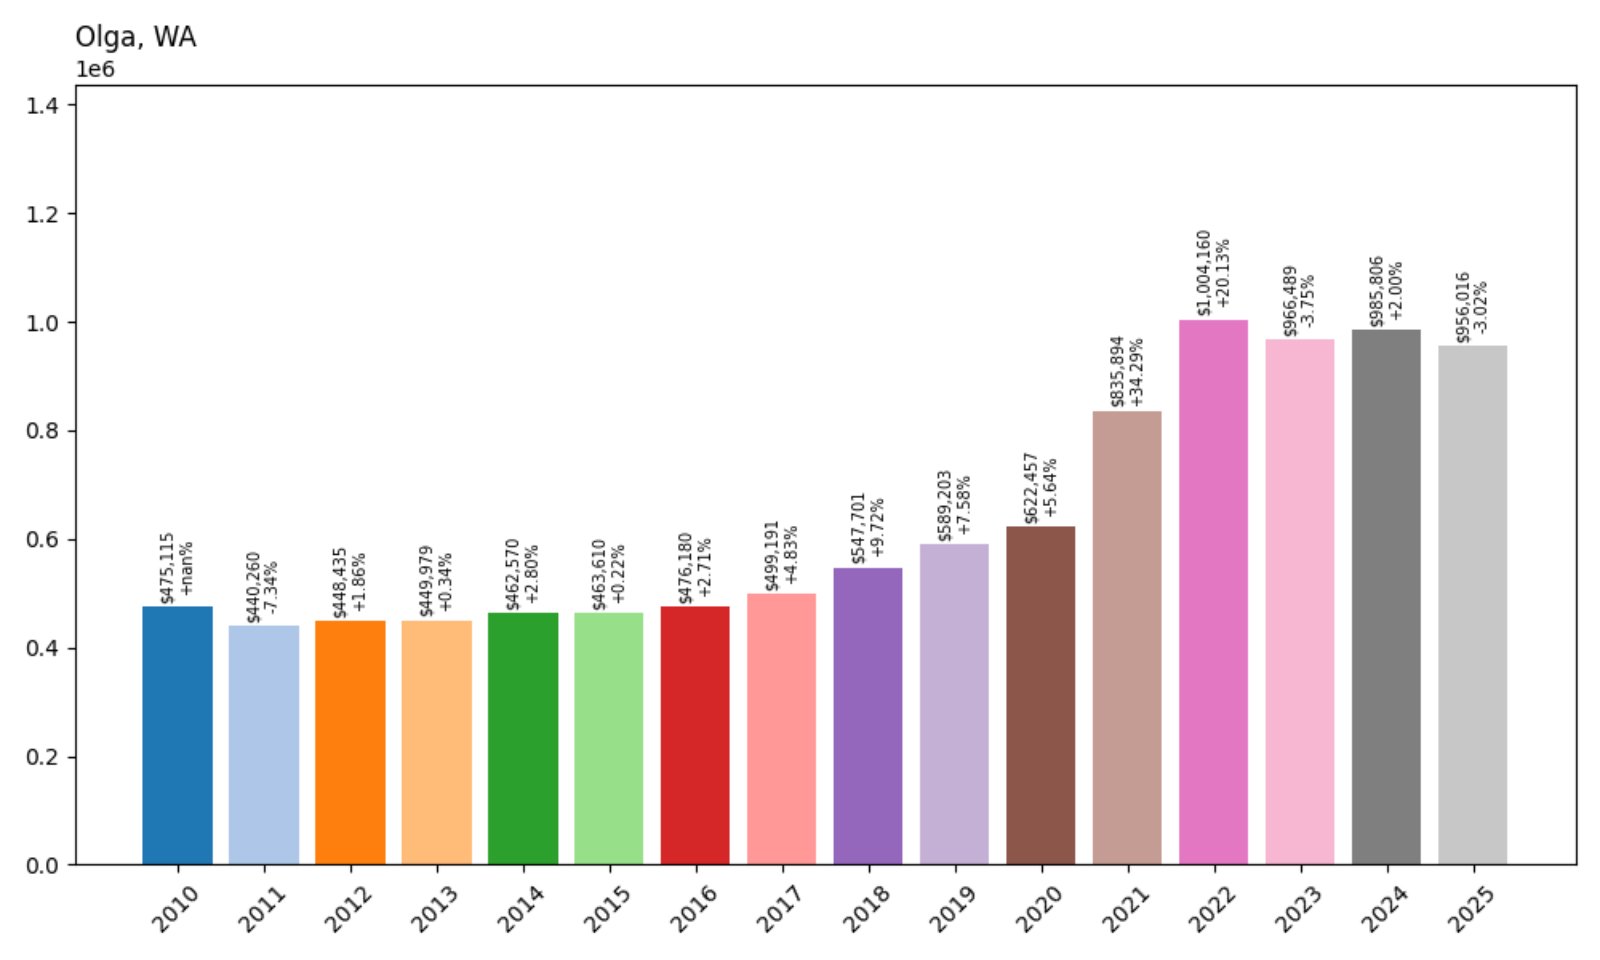
29. Olga – 101% Home Price Increase Since 2010
🔥 Would you like to save this?
- 2010: $475,115
- 2011: $440,260 (−$34,855, −7.34%)
- 2012: $448,435 (+$8,174, +1.86%)
- 2013: $449,979 (+$1,544, +0.34%)
- 2014: $462,570 (+$12,591, +2.80%)
- 2015: $463,610 (+$1,040, +0.22%)
- 2016: $476,180 (+$12,570, +2.71%)
- 2017: $499,191 (+$23,011, +4.83%)
- 2018: $547,701 (+$48,510, +9.72%)
- 2019: $589,203 (+$41,502, +7.58%)
- 2020: $622,457 (+$33,253, +5.64%)
- 2021: $835,894 (+$213,437, +34.29%)
- 2022: $1,004,160 (+$168,266, +20.13%)
- 2023: $966,489 (−$37,671, −3.75%)
- 2024: $985,806 (+$19,317, +2.00%)
- 2025: $956,016 (−$29,790, −3.02%)
Home prices in Olga have more than doubled over the past 15 years, climbing from $475K in 2010 to just under $956K in 2025. Growth peaked in 2021–2022, with smaller declines following. The area remains highly valued despite recent dips, driven by limited availability and natural appeal.
Olga – High Prices on a Remote Island Edge
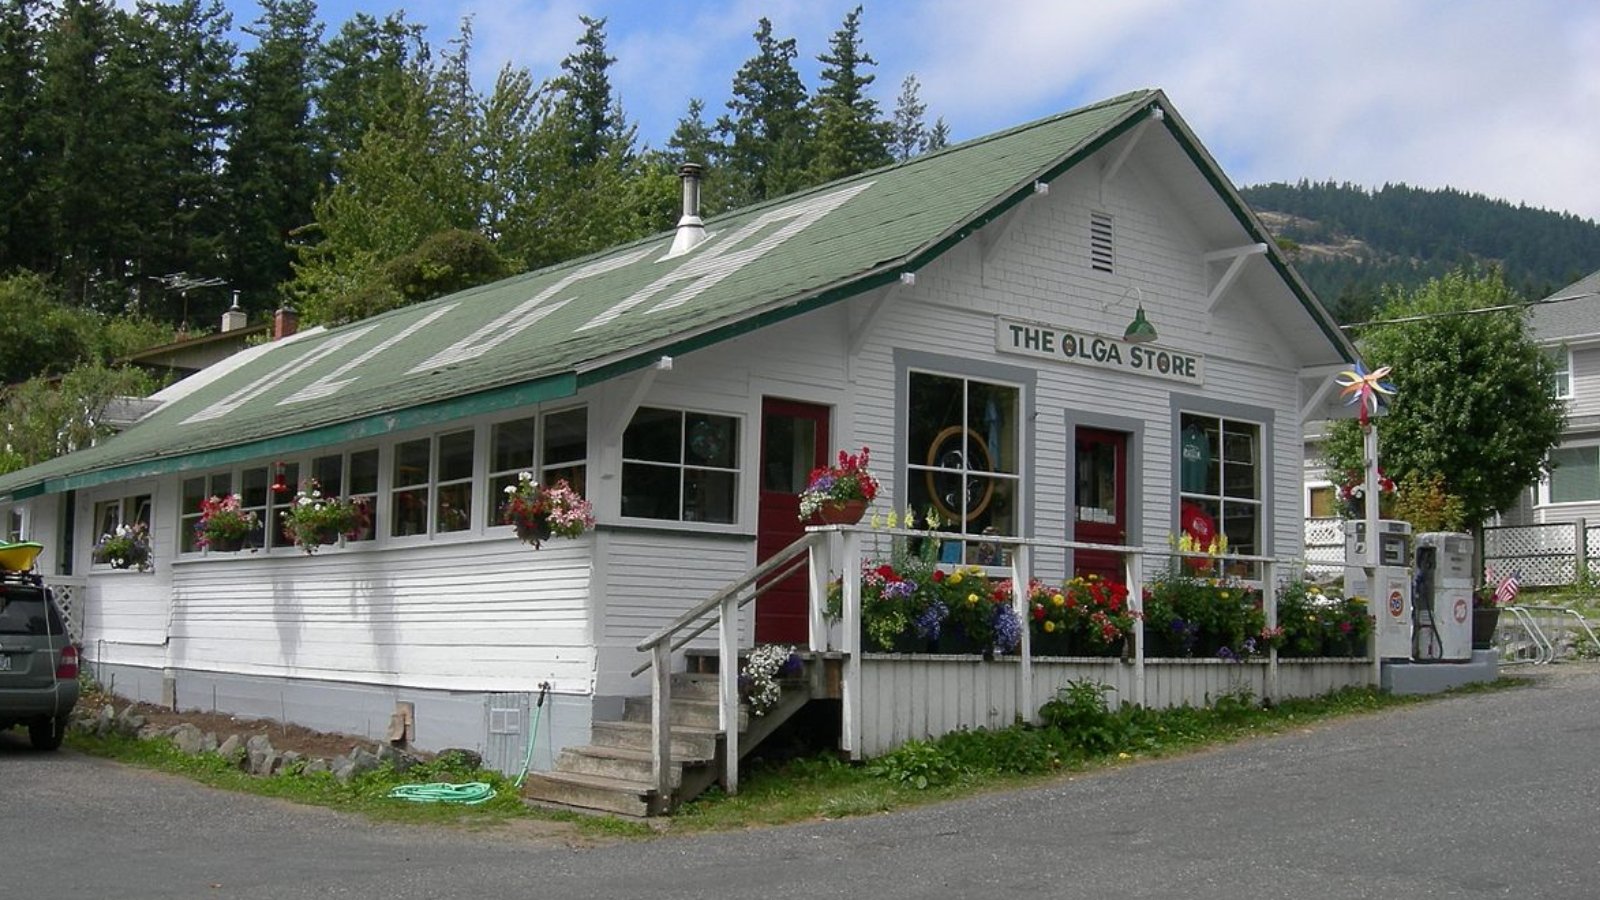
Olga is a quiet, artistic enclave located on Orcas Island, popular with vacation home buyers and remote workers. Its rustic charm, scenic vistas, and small community feel make it an attractive location for those seeking a slower pace of life — but with serious property value.
Most of the homes here are custom-built or one-of-a-kind, and development is limited. That scarcity helps explain the sustained high prices, especially during the post-2020 housing boom. Even with a slight retreat from peak values, Olga’s market reflects its continued desirability among second-home buyers and retirees.
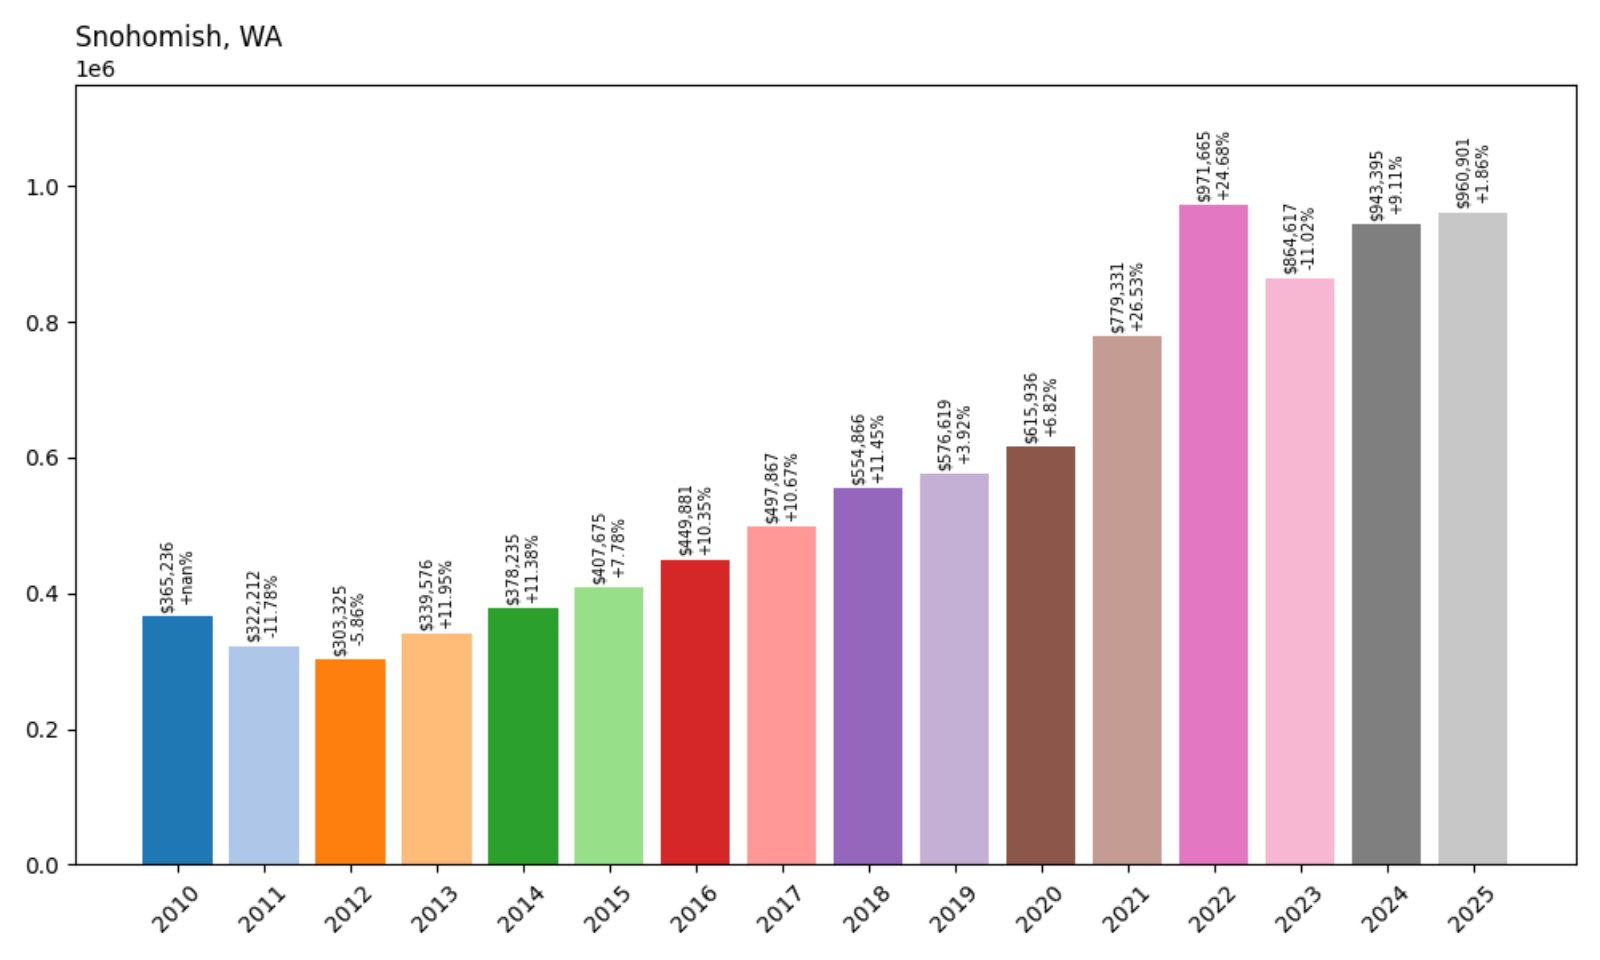
28. Snohomish – 163% Home Price Increase Since 2010
- 2010: $365,236
- 2011: $322,212 (−$43,024, −11.78%)
- 2012: $303,325 (−$18,887, −5.86%)
- 2013: $339,576 (+$36,251, +11.95%)
- 2014: $378,235 (+$38,658, +11.38%)
- 2015: $407,675 (+$29,440, +7.78%)
- 2016: $449,881 (+$42,206, +10.35%)
- 2017: $497,867 (+$47,986, +10.67%)
- 2018: $554,866 (+$57,000, +11.45%)
- 2019: $576,619 (+$21,752, +3.92%)
- 2020: $615,936 (+$39,317, +6.82%)
- 2021: $779,331 (+$163,395, +26.53%)
- 2022: $971,665 (+$192,335, +24.68%)
- 2023: $864,617 (−$107,049, −11.02%)
- 2024: $943,395 (+$78,778, +9.11%)
- 2025: $960,901 (+$17,506, +1.86%)
Snohomish home values have increased by over 160% since 2010. The biggest gains occurred between 2020 and 2022, when prices surged more than $350K. Although 2023 brought a dip, the town quickly recovered in 2024 and held steady in 2025, reflecting its resilience.
Snohomish – History and Demand Keep Prices Up

Famous for its antique shops, historic downtown, and annual events, Snohomish offers both charm and practicality. It’s well-positioned between rural and urban, with easy access to Everett, Lake Stevens, and the Seattle metro. These qualities make it attractive for families and commuters alike.
Housing demand here has remained high, especially for homes with land or historic character. A strong sense of place, good schools, and scenic farmland help support rising prices. Even with some fluctuations, Snohomish continues to see strong interest in 2025.
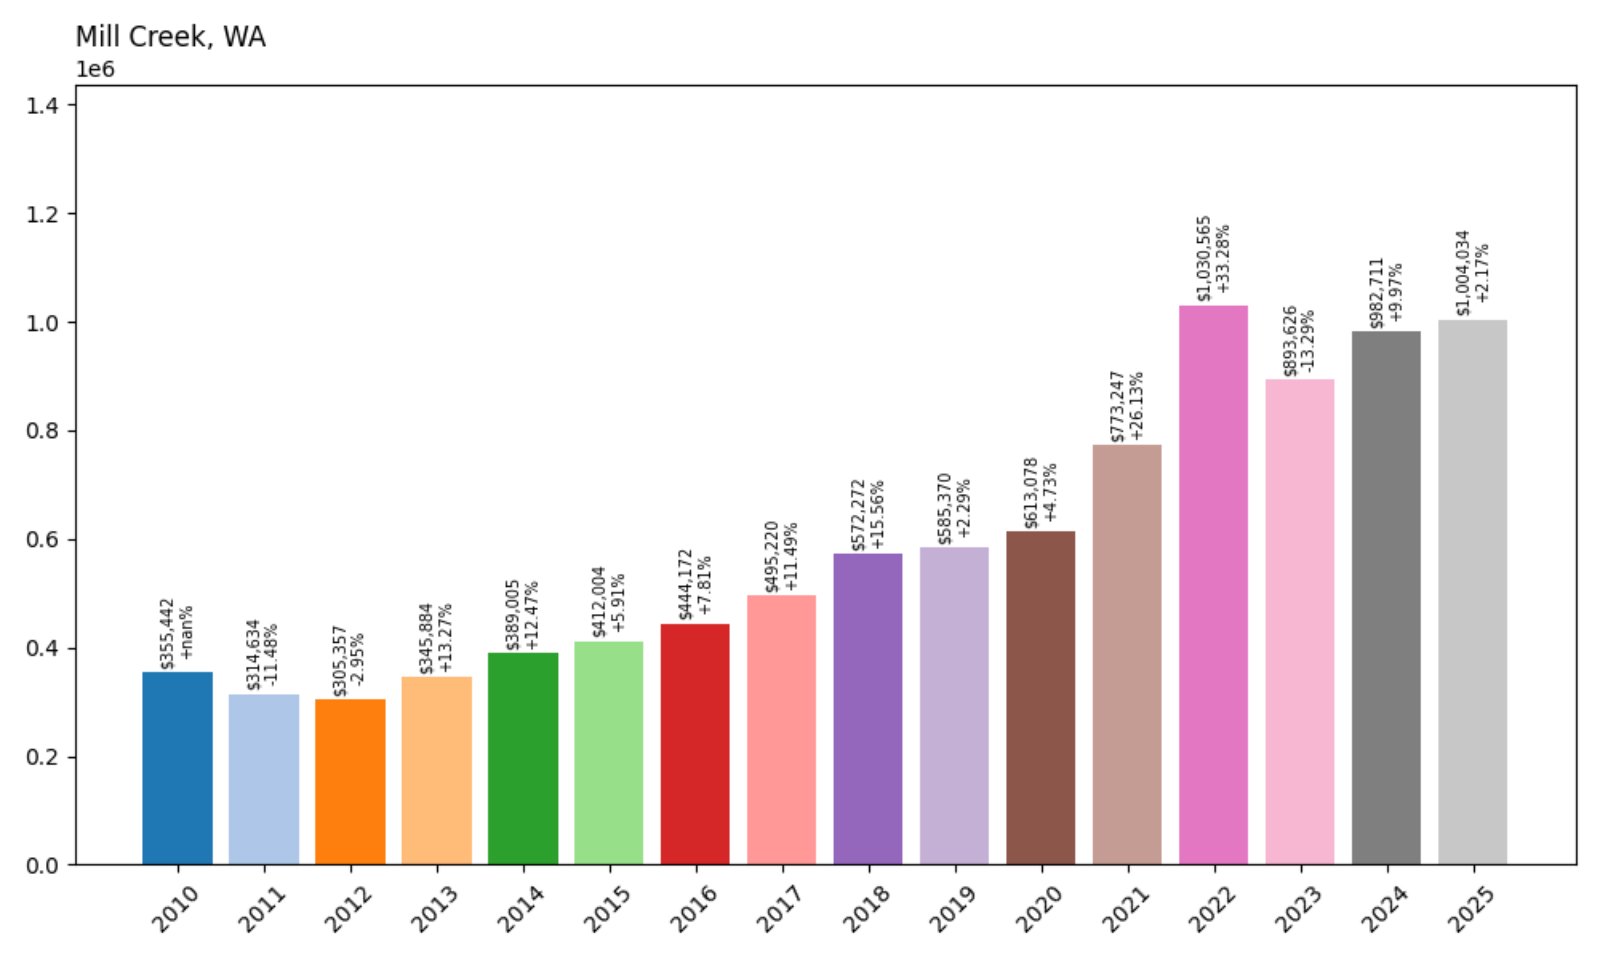
27. Mill Creek – 183% Home Price Increase Since 2010
- 2010: $355,442
- 2011: $314,634 (−$40,807, −11.48%)
- 2012: $305,357 (−$9,277, −2.95%)
- 2013: $345,884 (+$40,527, +13.27%)
- 2014: $389,005 (+$43,120, +12.47%)
- 2015: $412,004 (+$22,999, +5.91%)
- 2016: $444,172 (+$32,169, +7.81%)
- 2017: $495,220 (+$51,048, +11.49%)
- 2018: $572,272 (+$77,052, +15.56%)
- 2019: $585,370 (+$13,098, +2.29%)
- 2020: $613,078 (+$27,709, +4.73%)
- 2021: $773,247 (+$160,168, +26.13%)
- 2022: $1,030,565 (+$257,318, +33.28%)
- 2023: $893,626 (−$136,938, −13.29%)
- 2024: $982,711 (+$89,085, +9.97%)
- 2025: $1,004,034 (+$21,323, +2.17%)
Mill Creek’s home values have nearly tripled since 2010. After a significant spike in 2021–2022, prices dipped in 2023 but recovered quickly. The town now averages over $1 million per home in 2025, placing it among the top-tier markets in Snohomish County.
Mill Creek – Master-Planned, High-Value Living
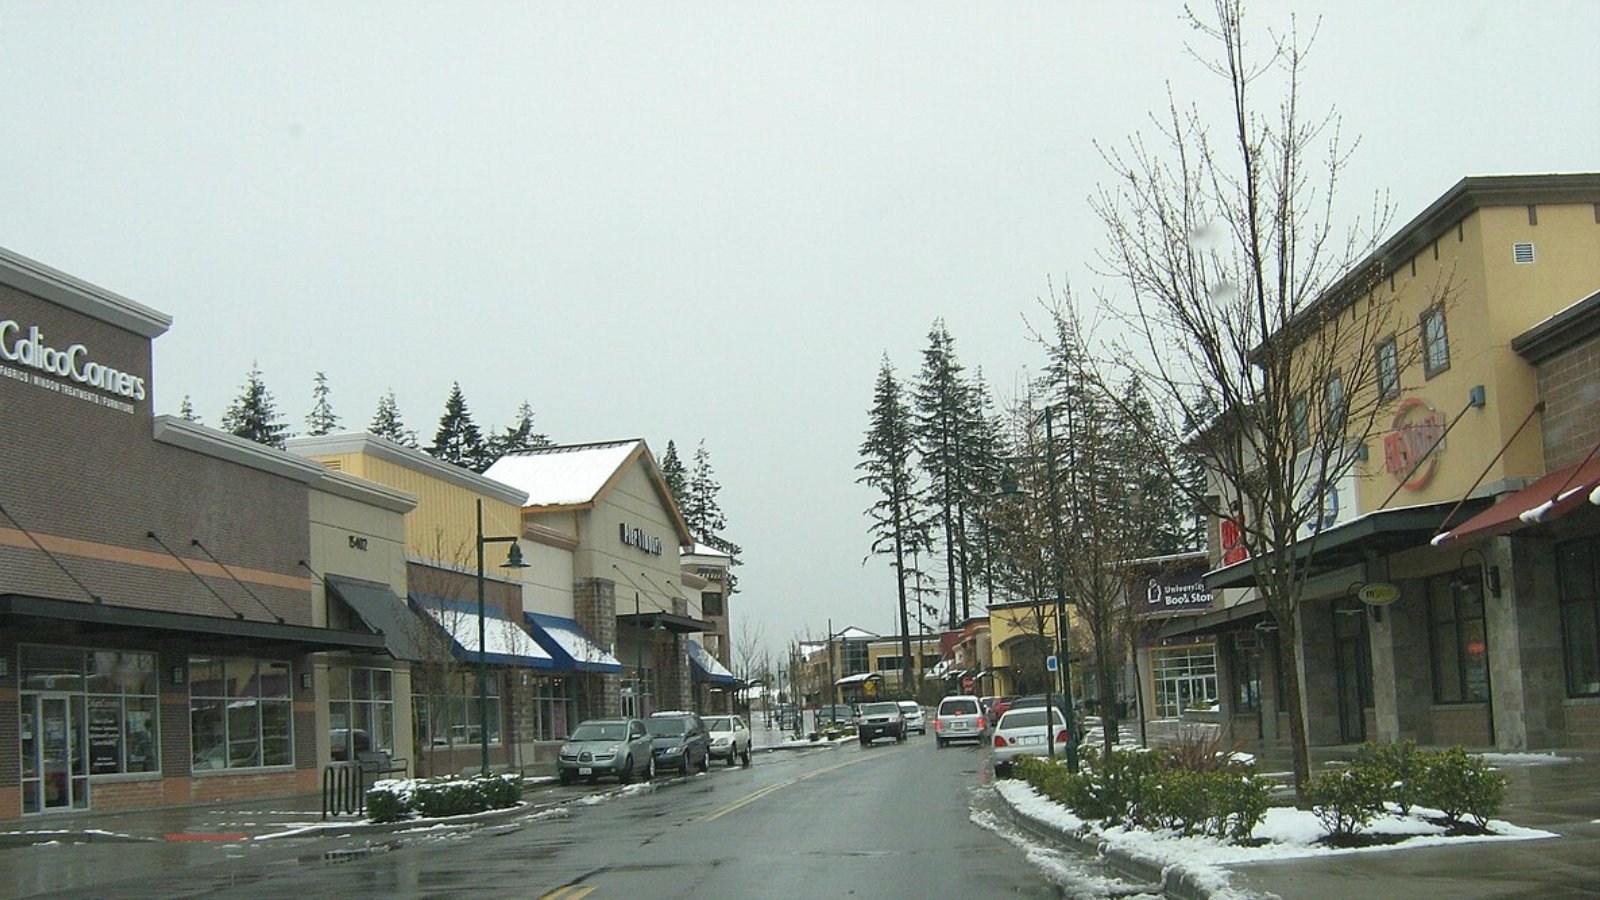
Mill Creek stands out for its well-maintained neighborhoods, planned communities, and walkable town center. Residents enjoy extensive greenbelts, nature trails, and quick access to I-5 and Highway 527. This blend of convenience and quality has driven strong price appreciation over the past decade.
Buyers are drawn to its high-performing schools, golf course neighborhoods, and proximity to major employers. As the Seattle housing market expanded northward, Mill Creek became a top pick for those wanting a suburban lifestyle without long commutes — and home values reflect that demand.
26. Duvall – 153% Home Price Increase Since 2010
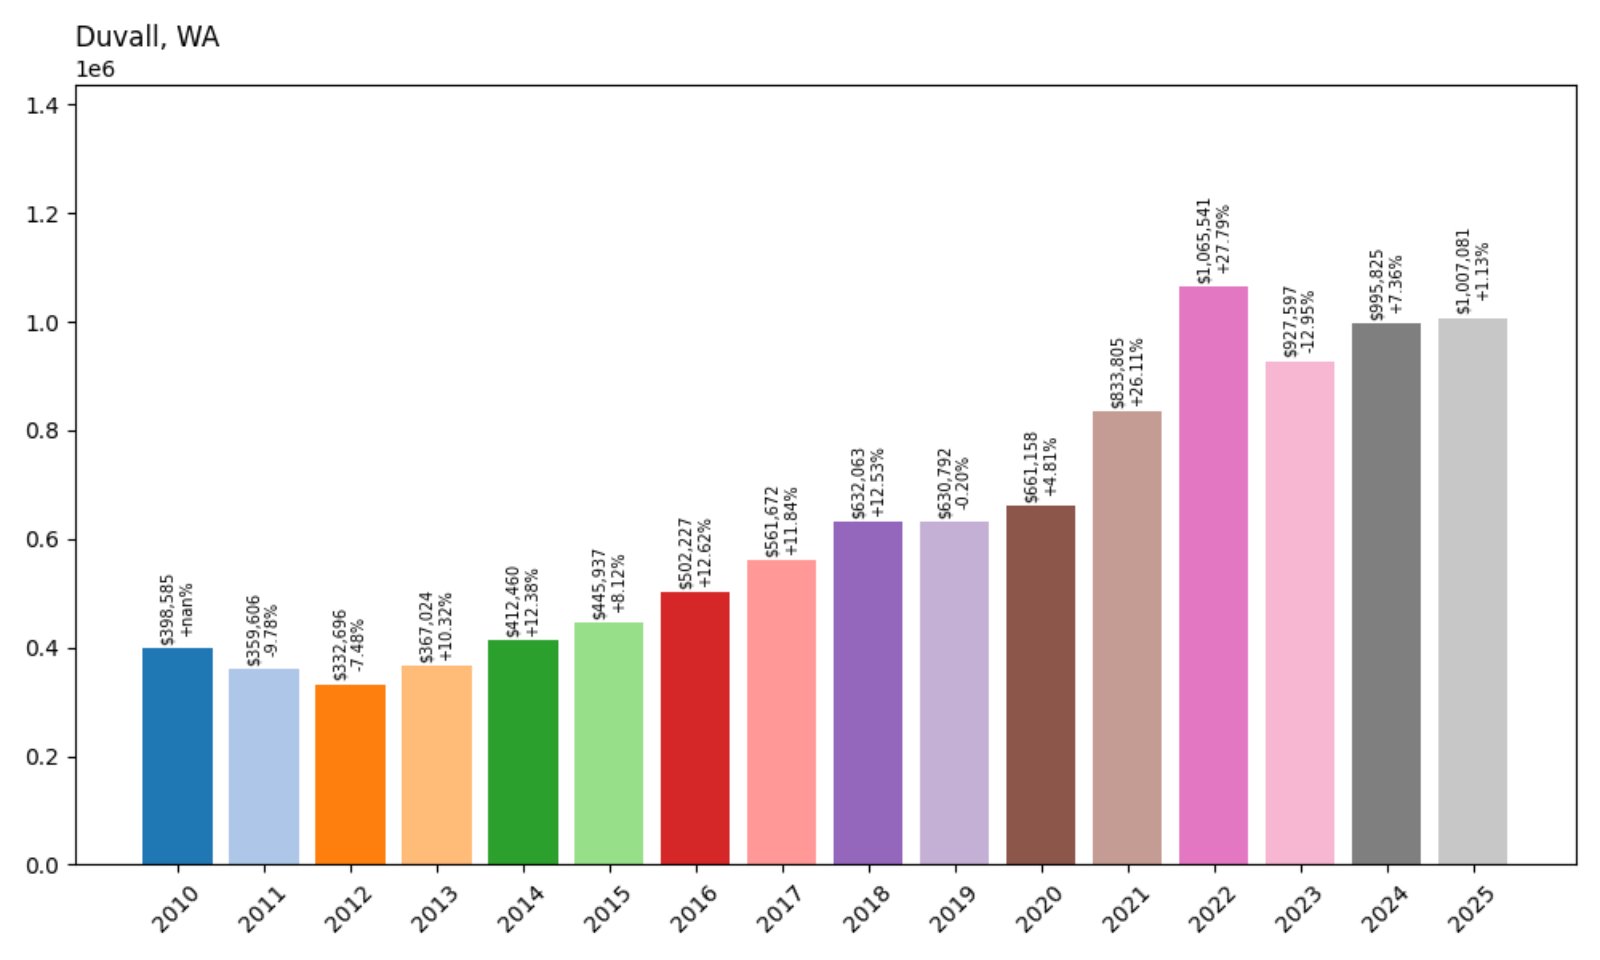
- 2010: $398,585
- 2011: $359,606 (−$38,978, −9.78%)
- 2012: $332,696 (−$26,910, −7.48%)
- 2013: $367,024 (+$34,327, +10.32%)
- 2014: $412,460 (+$45,436, +12.38%)
- 2015: $445,937 (+$33,478, +8.12%)
- 2016: $502,227 (+$56,290, +12.62%)
- 2017: $561,672 (+$59,445, +11.84%)
- 2018: $632,063 (+$70,391, +12.53%)
- 2019: $630,792 (−$1,272, −0.20%)
- 2020: $661,158 (+$30,367, +4.81%)
- 2021: $833,805 (+$172,647, +26.11%)
- 2022: $1,065,541 (+$231,736, +27.79%)
- 2023: $927,597 (−$137,944, −12.95%)
- 2024: $995,825 (+$68,229, +7.36%)
- 2025: $1,007,081 (+$11,256, +1.13%)
Duvall’s housing market has more than doubled since 2010, with prices rising from just under $400K to over $1 million in 2025. The biggest jumps happened between 2020 and 2022, though prices dipped afterward. The 2025 value shows stability returning to this fast-growing community.
Duvall – A Riverside Town With Rising Demand
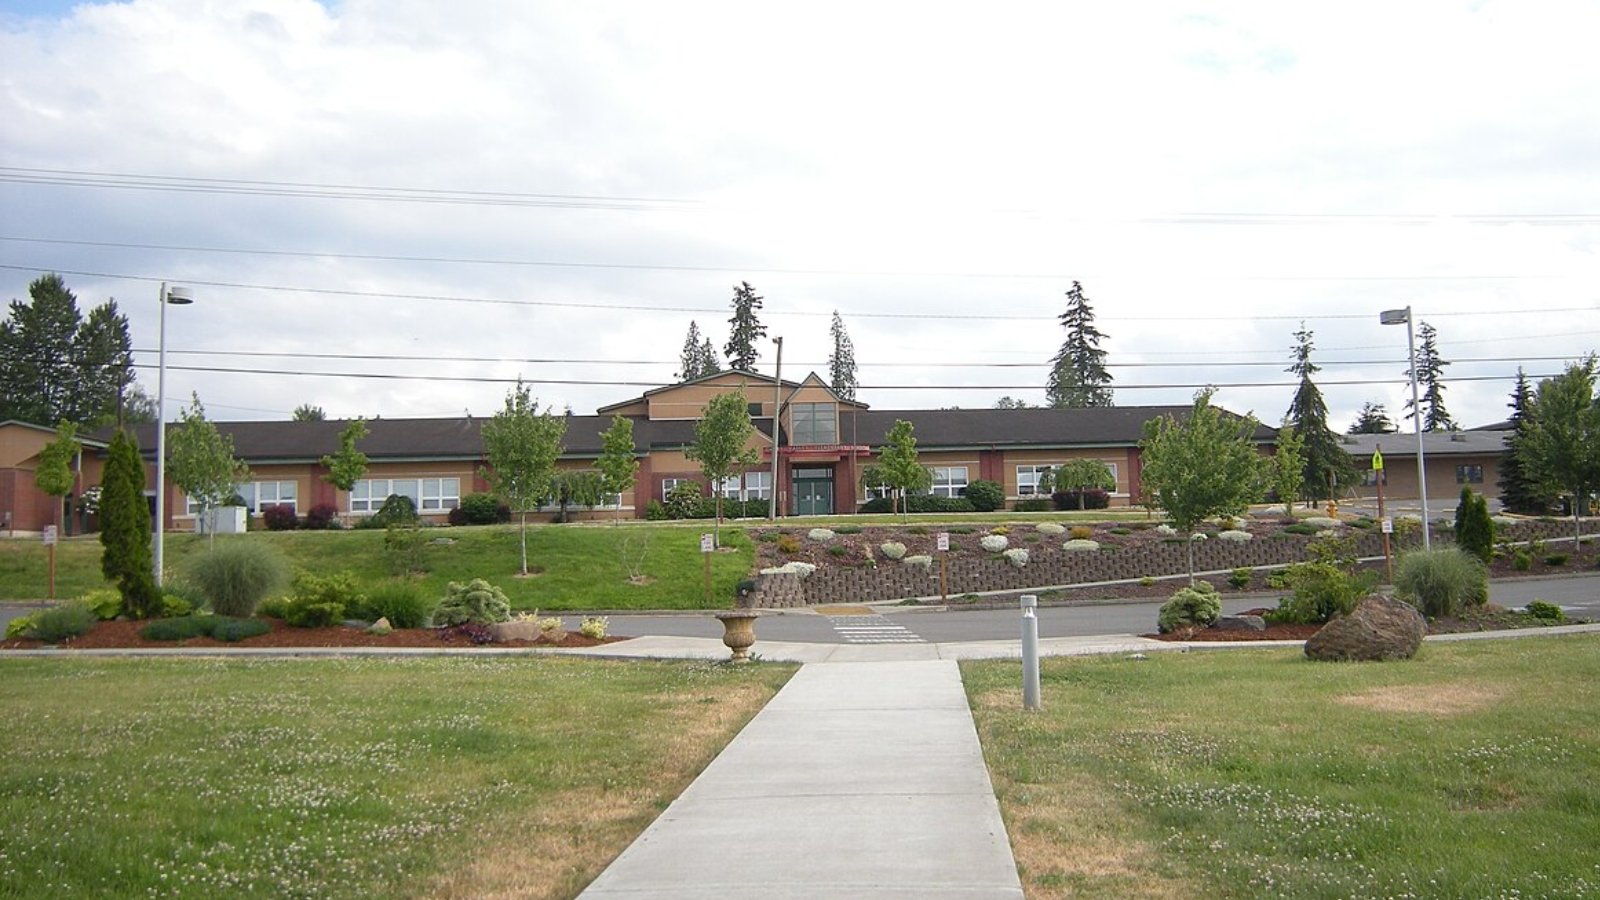
Duvall, situated in the Snoqualmie Valley northeast of Redmond, has become increasingly popular with families and remote workers. Its location offers a peaceful atmosphere with access to the tech corridor, which fueled price spikes during the remote work shift of the early 2020s.
Locals enjoy riverfront parks, mountain views, and a charming downtown with year-round community events. Growth in nearby employment hubs has led to more homebuilding and interest in Duvall’s larger lots and newer homes. Though prices corrected briefly, the 2025 numbers suggest strong long-term value.
25. Brier – 183% Home Price Increase Since 2010
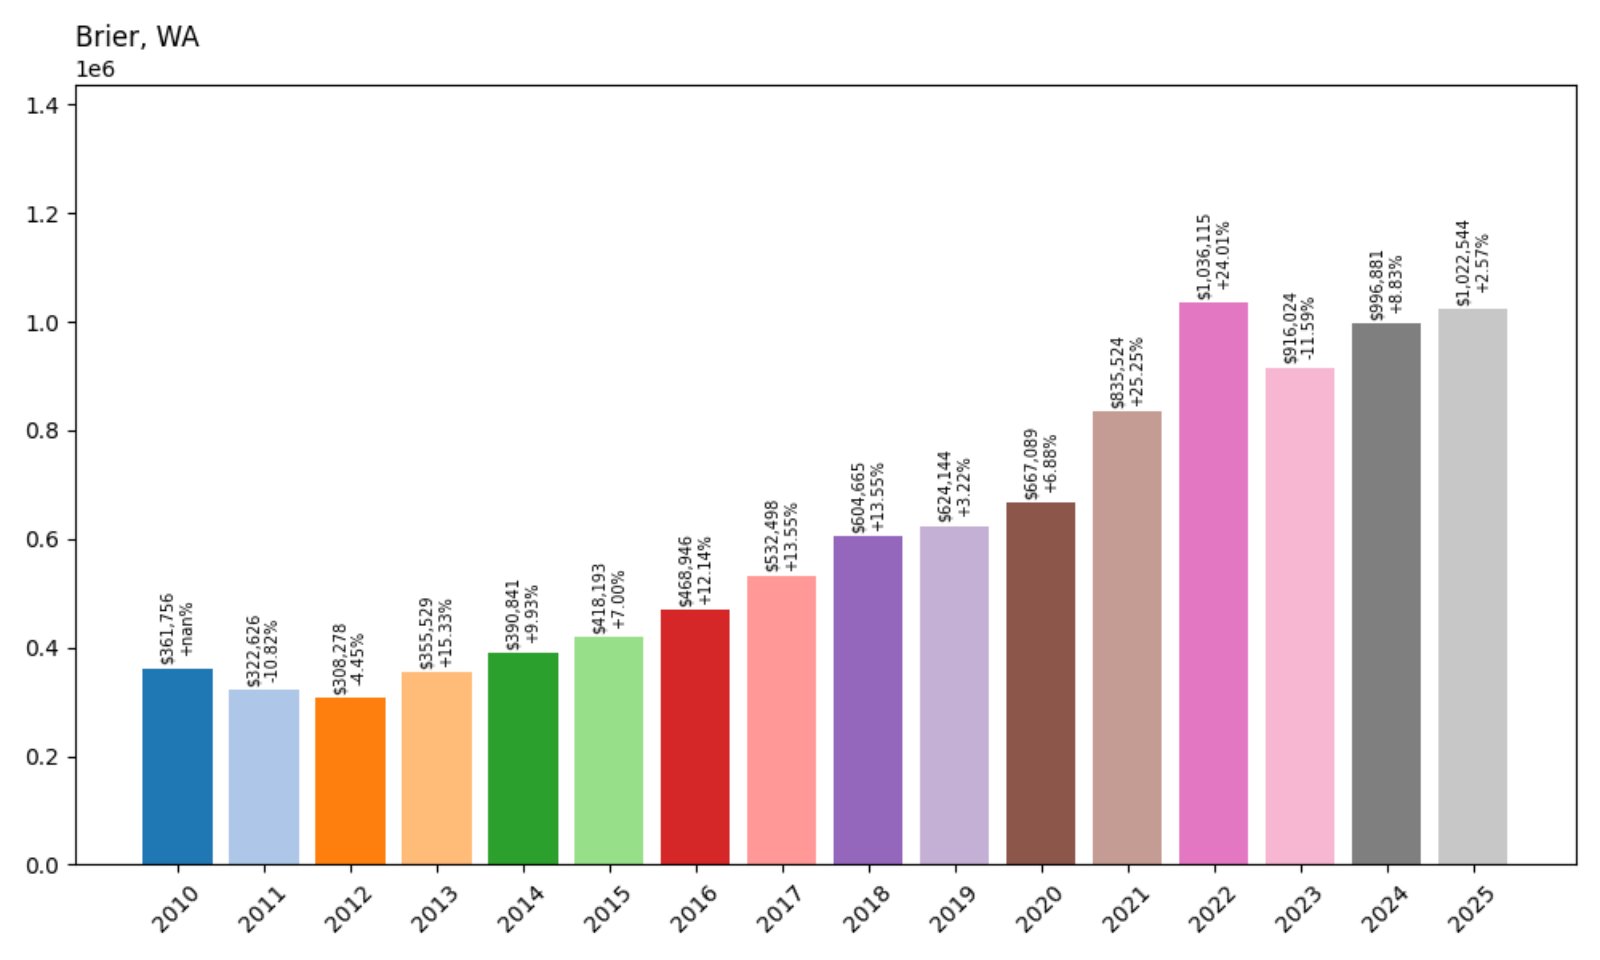
- 2010: $361,756
- 2011: $322,626 (−$39,130, −10.82%)
- 2012: $308,278 (−$14,348, −4.45%)
- 2013: $355,529 (+$47,250, +15.33%)
- 2014: $390,841 (+$35,313, +9.93%)
- 2015: $418,193 (+$27,352, +7.00%)
- 2016: $468,946 (+$50,752, +12.14%)
- 2017: $532,498 (+$63,552, +13.55%)
- 2018: $604,665 (+$72,167, +13.55%)
- 2019: $624,144 (+$19,479, +3.22%)
- 2020: $667,089 (+$42,944, +6.88%)
- 2021: $835,524 (+$168,436, +25.25%)
- 2022: $1,036,115 (+$200,590, +24.01%)
- 2023: $916,024 (−$120,091, −11.59%)
- 2024: $996,881 (+$80,857, +8.83%)
- 2025: $1,022,544 (+$25,663, +2.57%)
Home values in Brier have nearly tripled since 2010, with particularly sharp growth between 2020 and 2022. While the market cooled in 2023, prices climbed again in the following two years, landing at over $1 million in 2025. This long-term trend highlights Brier’s increasing appeal.
Brier – Quiet and Pricey Just North of Seattle
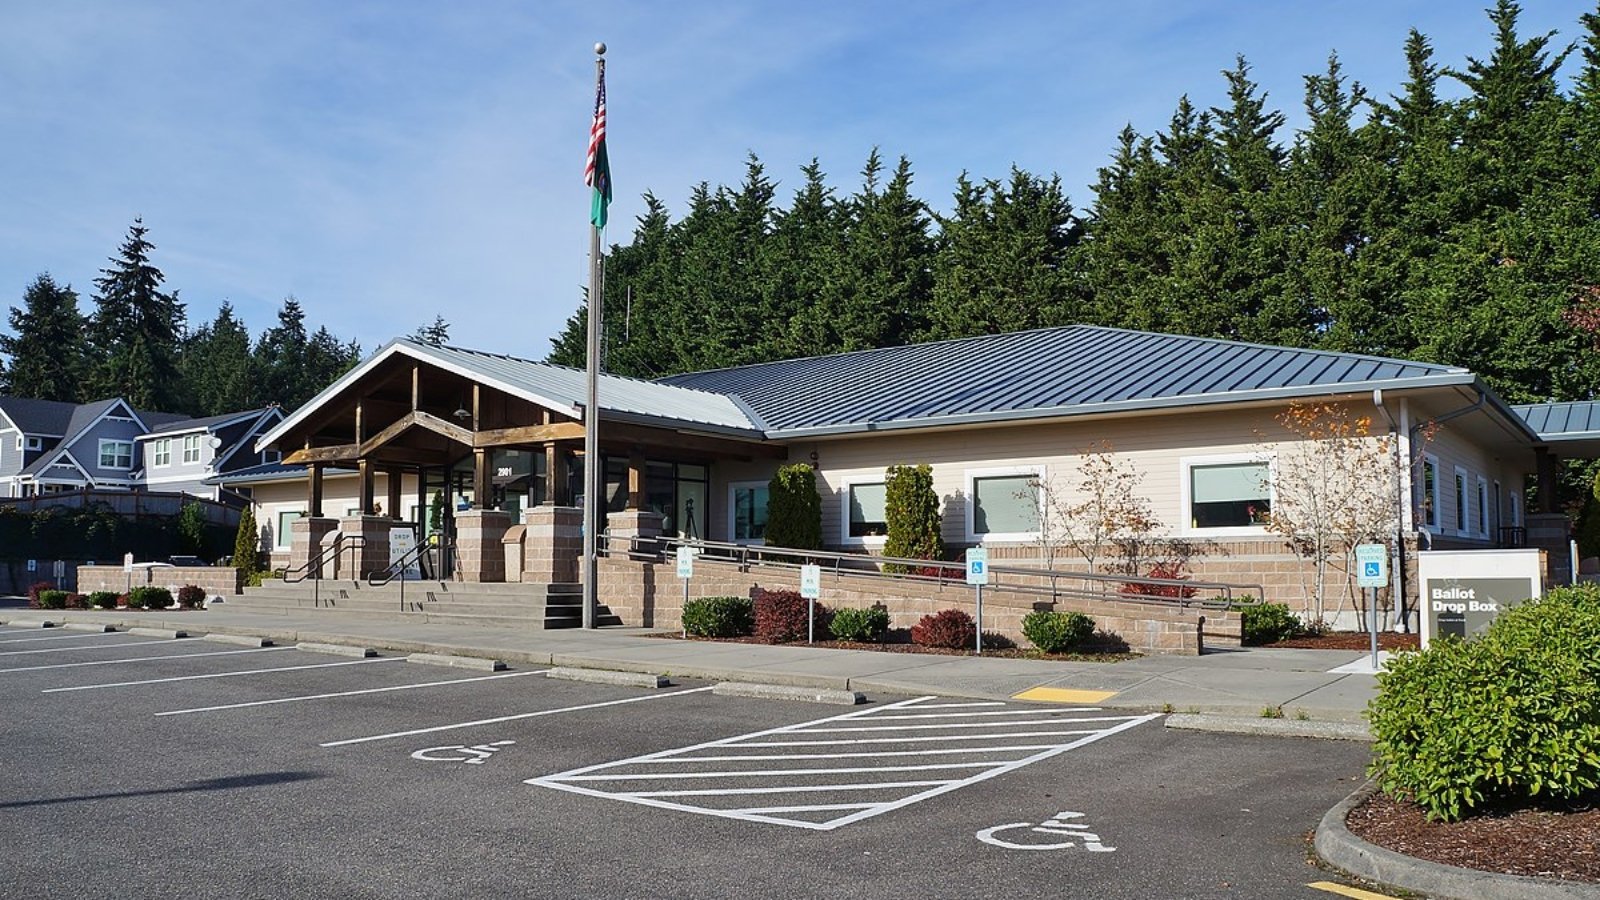
Brier offers a residential escape that’s still within commuting distance of Seattle, Lynnwood, and Bothell. Known for large lots, tree-lined streets, and a lack of commercial sprawl, Brier has become a preferred choice for buyers looking for peace and space without giving up urban access.
Homebuyers have fueled price growth as they looked for alternatives to denser suburbs. The town’s appeal lies in its balance — quiet and residential, but not isolated. With limited new construction, inventory remains tight, supporting high prices as demand persists in 2025.
24. North Bend – 159% Home Price Increase Since 2010
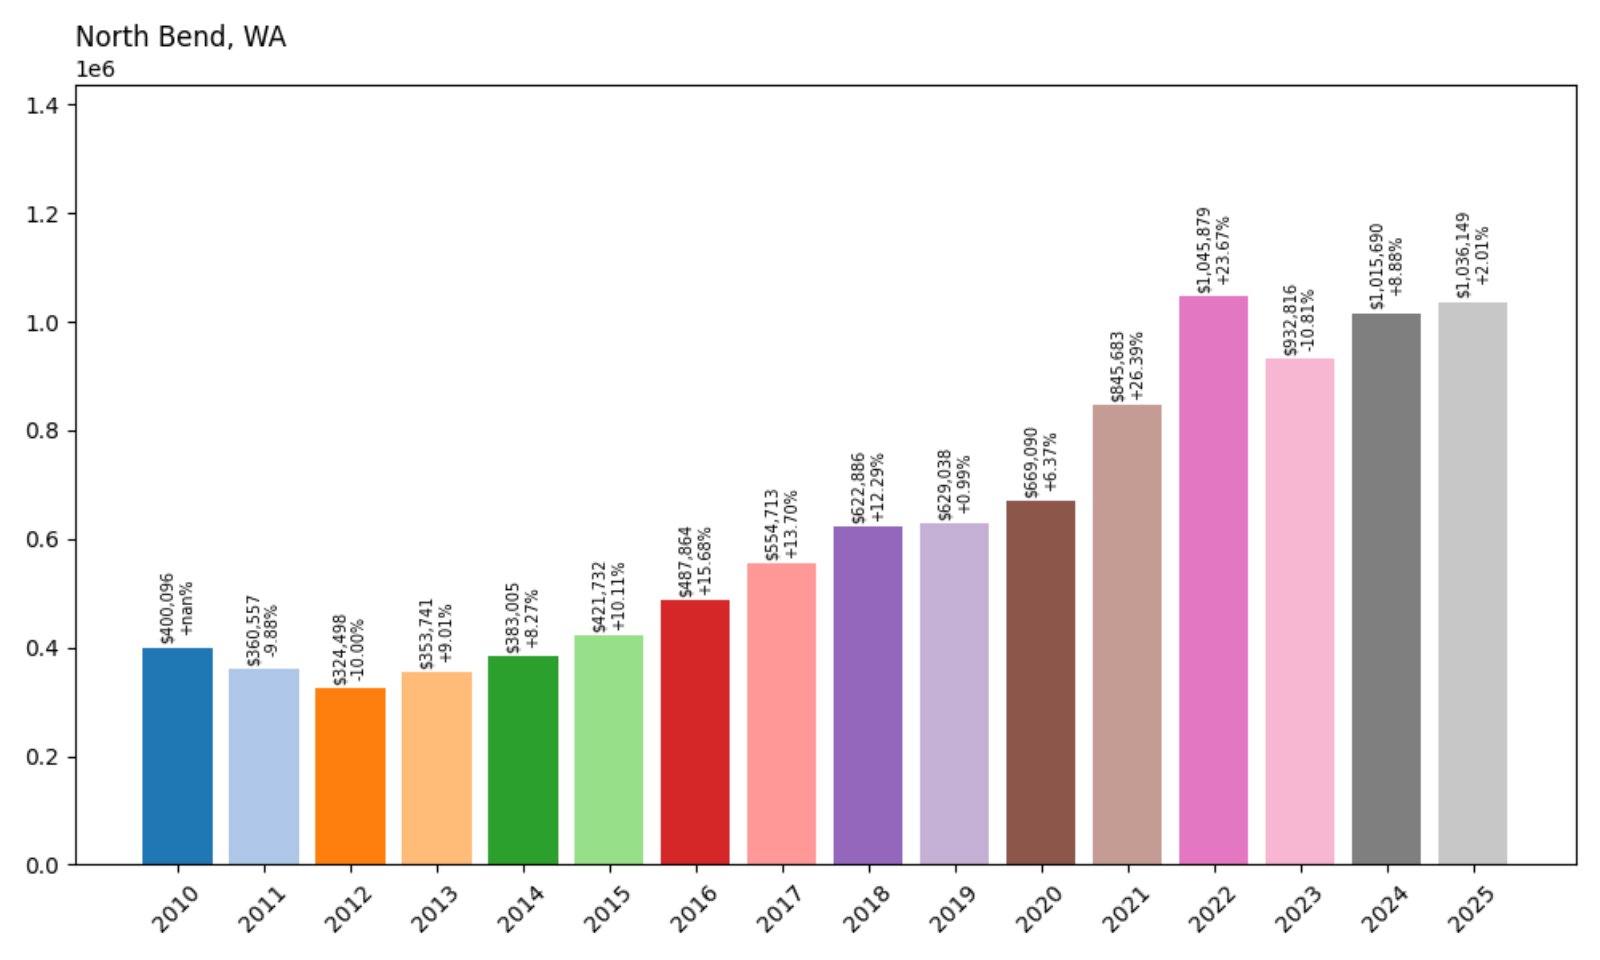
- 2010: $400,096
- 2011: $360,557 (−$39,539, −9.88%)
- 2012: $324,498 (−$36,059, −10.00%)
- 2013: $353,741 (+$29,243, +9.01%)
- 2014: $383,005 (+$29,263, +8.27%)
- 2015: $421,732 (+$38,727, +10.11%)
- 2016: $487,864 (+$66,132, +15.68%)
- 2017: $554,713 (+$66,849, +13.70%)
- 2018: $622,886 (+$68,173, +12.29%)
- 2019: $629,038 (+$6,152, +0.99%)
- 2020: $669,090 (+$40,052, +6.37%)
- 2021: $845,683 (+$176,593, +26.39%)
- 2022: $1,045,879 (+$200,196, +23.67%)
- 2023: $932,816 (−$113,062, −10.81%)
- 2024: $1,015,690 (+$82,874, +8.88%)
- 2025: $1,036,149 (+$20,459, +2.01%)
North Bend home values have jumped more than 150% since 2010, with dramatic gains during the housing surge of 2020–2022. While 2023 saw some price adjustment, the town’s average home value remains over $1 million in 2025 and shows signs of sustained strength.
North Bend – Mountain Views and Suburban Pricing
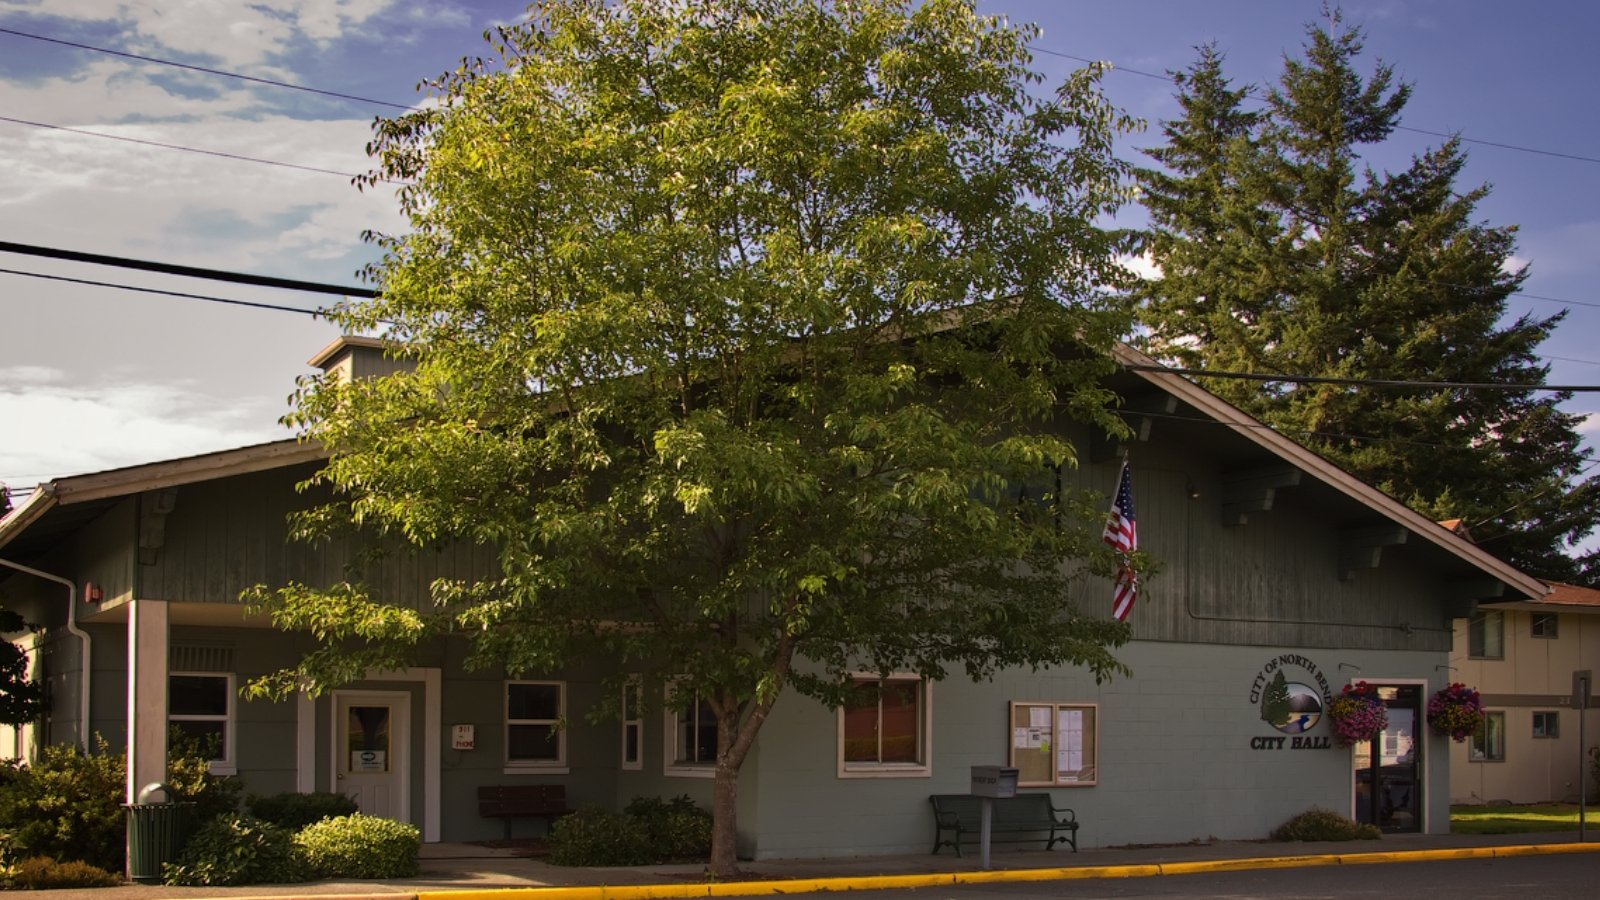
Located near the base of Mount Si, North Bend has become a top pick for buyers who want to live near nature without giving up proximity to Seattle. Its location along I-90 makes it one of the more scenic and accessible eastern suburbs in King County.
Outdoor enthusiasts love the area’s hiking, climbing, and river access. The town also gained national attention as a filming location for the TV series *Twin Peaks*. Combined with newer developments and demand for space, these features continue to support North Bend’s high home values in 2025.
23. Normandy Park – 129% Home Price Increase Since 2010

🔥 Would you like to save this?
- 2010: $459,595
- 2011: $422,211 (−$37,384, −8.13%)
- 2012: $396,190 (−$26,021, −6.16%)
- 2013: $427,311 (+$31,120, +7.85%)
- 2014: $464,144 (+$36,833, +8.62%)
- 2015: $495,681 (+$31,537, +6.79%)
- 2016: $550,506 (+$54,825, +11.06%)
- 2017: $603,919 (+$53,413, +9.70%)
- 2018: $659,955 (+$56,035, +9.28%)
- 2019: $672,879 (+$12,924, +1.96%)
- 2020: $727,055 (+$54,177, +8.05%)
- 2021: $895,284 (+$168,229, +23.14%)
- 2022: $1,039,782 (+$144,498, +16.14%)
- 2023: $949,893 (−$89,889, −8.64%)
- 2024: $1,042,791 (+$92,897, +9.78%)
- 2025: $1,054,393 (+$11,602, +1.11%)
Normandy Park’s home values have surged by nearly 130% since 2010. While the town saw a slight dip in 2023, values climbed again through 2025, stabilizing well above $1 million. The consistent upward trend reflects demand for coastal proximity and suburban lifestyle.
Normandy Park – Waterfront Tranquility Near the City
Just south of Seattle, Normandy Park offers beachfront access, quiet streets, and sweeping views of Puget Sound. It’s one of the few towns close to the airport that maintains a residential feel, making it attractive to professionals and retirees alike.
The city includes several private beach clubs and parks, adding to its premium atmosphere. Despite its small size, Normandy Park consistently commands high home values due to its scenic shoreline, strong schools, and relative exclusivity in the South King County area.
22. Carnation – 132% Home Price Increase Since 2010
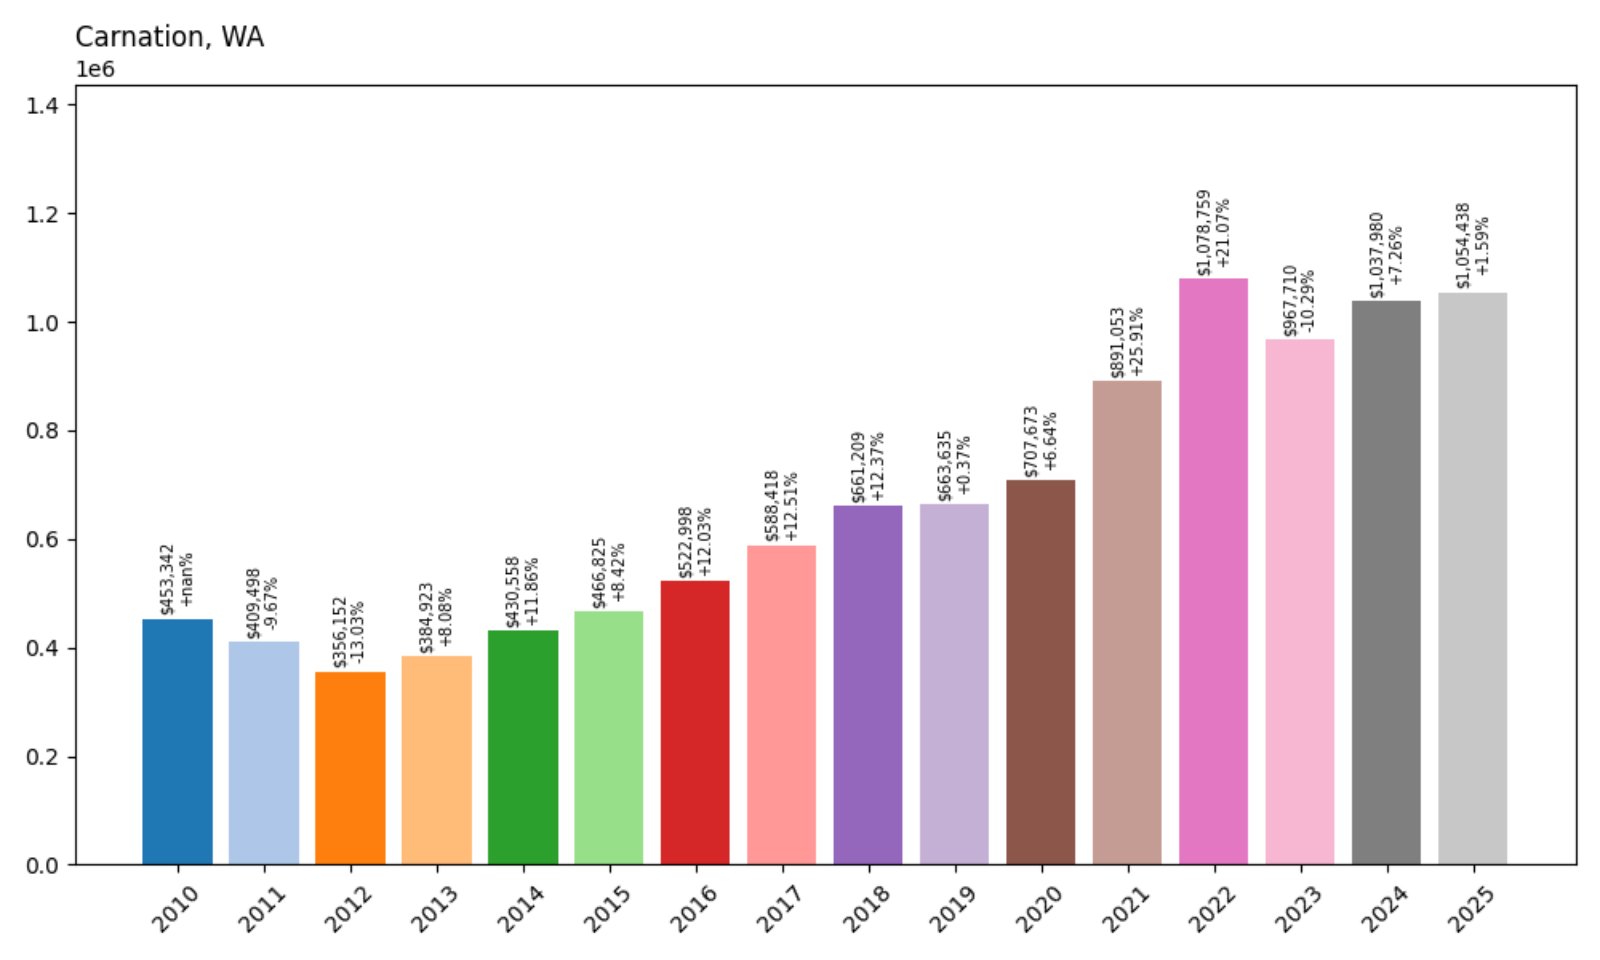
- 2010: $453,342
- 2011: $409,498 (−$43,844, −9.67%)
- 2012: $356,152 (−$53,346, −13.03%)
- 2013: $384,923 (+$28,772, +8.08%)
- 2014: $430,558 (+$45,635, +11.86%)
- 2015: $466,825 (+$36,267, +8.42%)
- 2016: $522,998 (+$56,173, +12.03%)
- 2017: $588,418 (+$65,420, +12.51%)
- 2018: $661,209 (+$72,791, +12.37%)
- 2019: $663,635 (+$2,427, +0.37%)
- 2020: $707,673 (+$44,037, +6.64%)
- 2021: $891,053 (+$183,380, +25.91%)
- 2022: $1,078,759 (+$187,707, +21.07%)
- 2023: $967,710 (−$111,049, −10.29%)
- 2024: $1,037,980 (+$70,270, +7.26%)
- 2025: $1,054,438 (+$16,458, +1.59%)
Home prices in Carnation have more than doubled since 2010, climbing from $453K to over $1.05 million. While there was a dip in 2023, the town saw a quick rebound and continued upward movement through 2025, driven by limited housing and strong demand for rural homes close to urban jobs.
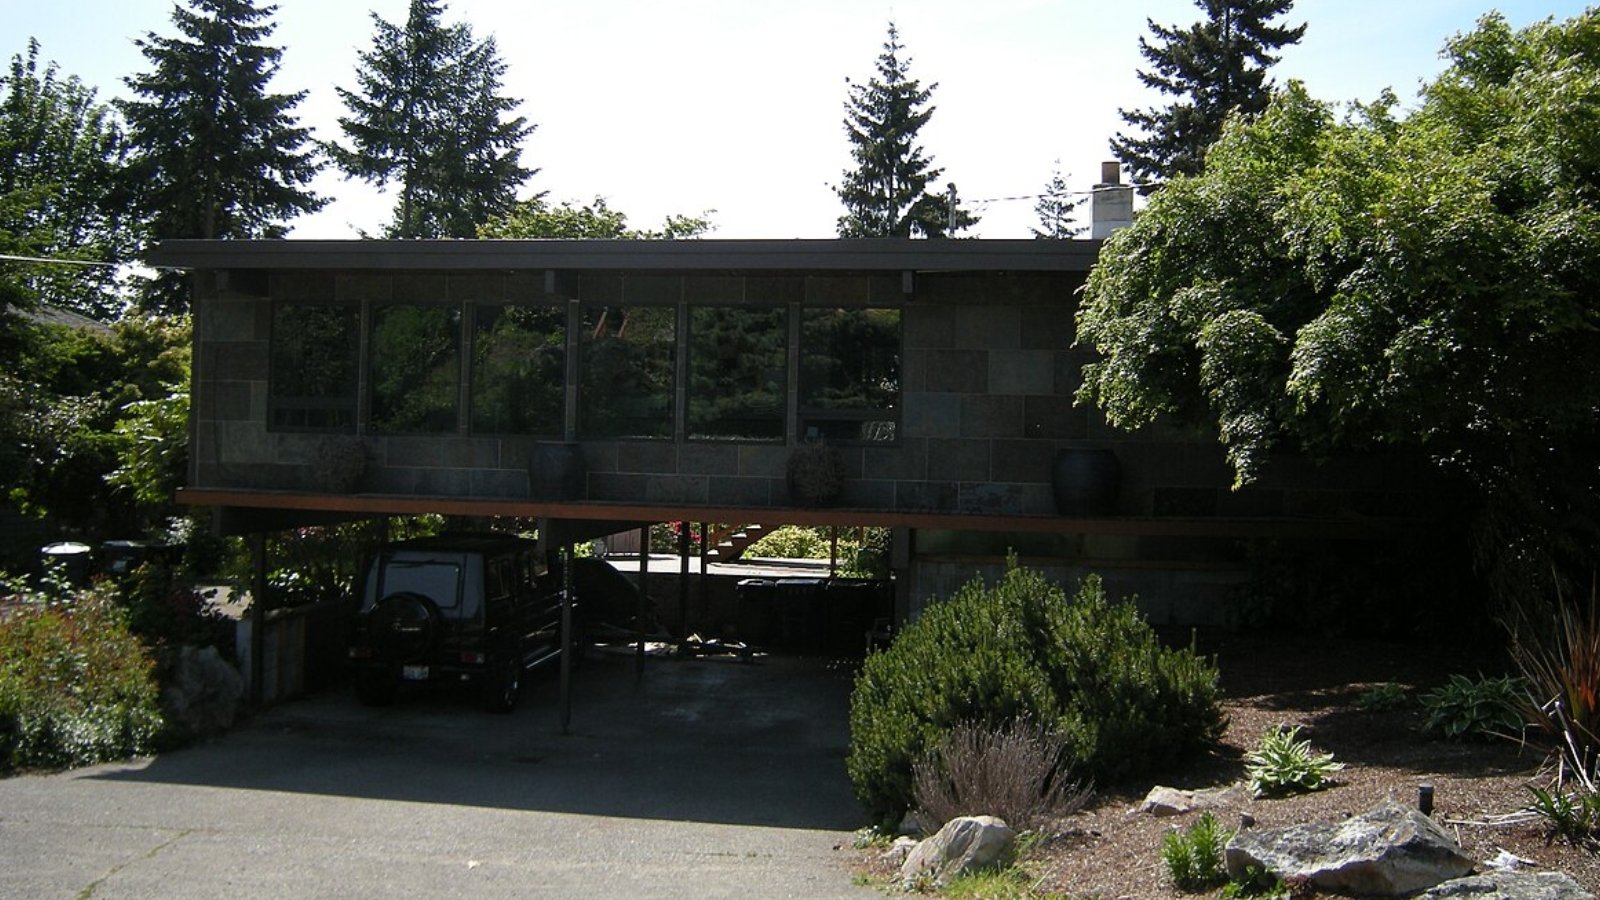
Carnation – Country Setting With Tech Corridor Access

Located in the Snoqualmie Valley east of Redmond, Carnation combines a rural atmosphere with proximity to major tech employers. It’s a top pick for those seeking larger lots and a quieter lifestyle without giving up access to the Eastside job market. Farms, nature trails, and small-town festivals add to its appeal.
The town has become increasingly attractive to remote workers and buyers priced out of more central suburbs. With fewer homes on the market and high demand for space, Carnation’s home values have surged over the past decade. Despite some recent market softening, prices remain high heading into 2025.
21. Lake Forest Park – 141% Home Price Increase Since 2010

- 2010: $442,068
- 2011: $401,706 (−$40,362, −9.13%)
- 2012: $361,467 (−$40,238, −10.02%)
- 2013: $406,560 (+$45,093, +12.47%)
- 2014: $448,496 (+$41,935, +10.31%)
- 2015: $493,268 (+$44,773, +9.98%)
- 2016: $563,326 (+$70,058, +14.20%)
- 2017: $638,913 (+$75,587, +13.42%)
- 2018: $719,586 (+$80,673, +12.63%)
- 2019: $696,825 (−$22,761, −3.16%)
- 2020: $744,373 (+$47,548, +6.82%)
- 2021: $912,243 (+$167,871, +22.55%)
- 2022: $1,092,339 (+$180,095, +19.74%)
- 2023: $975,410 (−$116,928, −10.70%)
- 2024: $1,053,989 (+$78,579, +8.06%)
- 2025: $1,064,930 (+$10,941, +1.04%)
Lake Forest Park has seen consistent appreciation since 2010, with home prices rising from $442K to more than $1.06 million. Despite a brief drop in 2023, the town regained much of its value in the following two years, underscoring its long-term appeal among Seattle-area buyers.
Lake Forest Park – Suburban Privacy and Green Space
This residential suburb north of Seattle is known for its mature trees, quiet streets, and strong community presence. Nestled along the shores of Lake Washington, Lake Forest Park blends natural scenery with accessibility, thanks to nearby Highway 522 and transit routes into the city.
Homebuyers are drawn to the area’s strong schools, lakeside parks, and low commercial development. The Burke-Gilman Trail adds outdoor appeal, while the Town Center offers essential services and shops. With limited turnover and high interest, home values in 2025 reflect continued demand for peaceful living near Seattle.
20. Kenmore – 186% Home Price Increase Since 2010

- 2010: $376,168
- 2011: $344,885 (−$31,283, −8.32%)
- 2012: $320,721 (−$24,164, −7.01%)
- 2013: $368,228 (+$47,507, +14.81%)
- 2014: $405,444 (+$37,216, +10.11%)
- 2015: $444,633 (+$39,188, +9.67%)
- 2016: $510,342 (+$65,709, +14.78%)
- 2017: $581,769 (+$71,427, +14.00%)
- 2018: $664,255 (+$82,486, +14.18%)
- 2019: $653,118 (−$11,137, −1.68%)
- 2020: $689,380 (+$36,262, +5.55%)
- 2021: $855,048 (+$165,668, +24.03%)
- 2022: $1,082,042 (+$226,994, +26.55%)
- 2023: $955,206 (−$126,835, −11.72%)
- 2024: $1,044,644 (+$89,438, +9.36%)
- 2025: $1,075,135 (+$30,491, +2.92%)
Kenmore’s home prices have surged nearly 190% since 2010, driven by steady demand and strong appreciation between 2020 and 2022. Though 2023 saw a pullback, the market rebounded in 2024 and remained on solid footing in 2025, with average prices over $1.07 million.
Kenmore – Lakeside Growth With Urban Access
Located on the northern tip of Lake Washington, Kenmore offers a mix of suburban convenience and outdoor appeal. The Burke-Gilman Trail, Kenmore Air Harbor, and ample green space make it a draw for active residents and nature lovers. At the same time, it sits within easy commuting distance of Seattle, Bellevue, and Redmond.
Kenmore’s rapid appreciation is tied to limited inventory, solid school districts, and renewed infrastructure investment. New townhomes and infill housing have helped meet some demand, but prices remain high due to the town’s strong fundamentals and desirable setting.
19. Fox Island – 115% Home Price Increase Since 2010
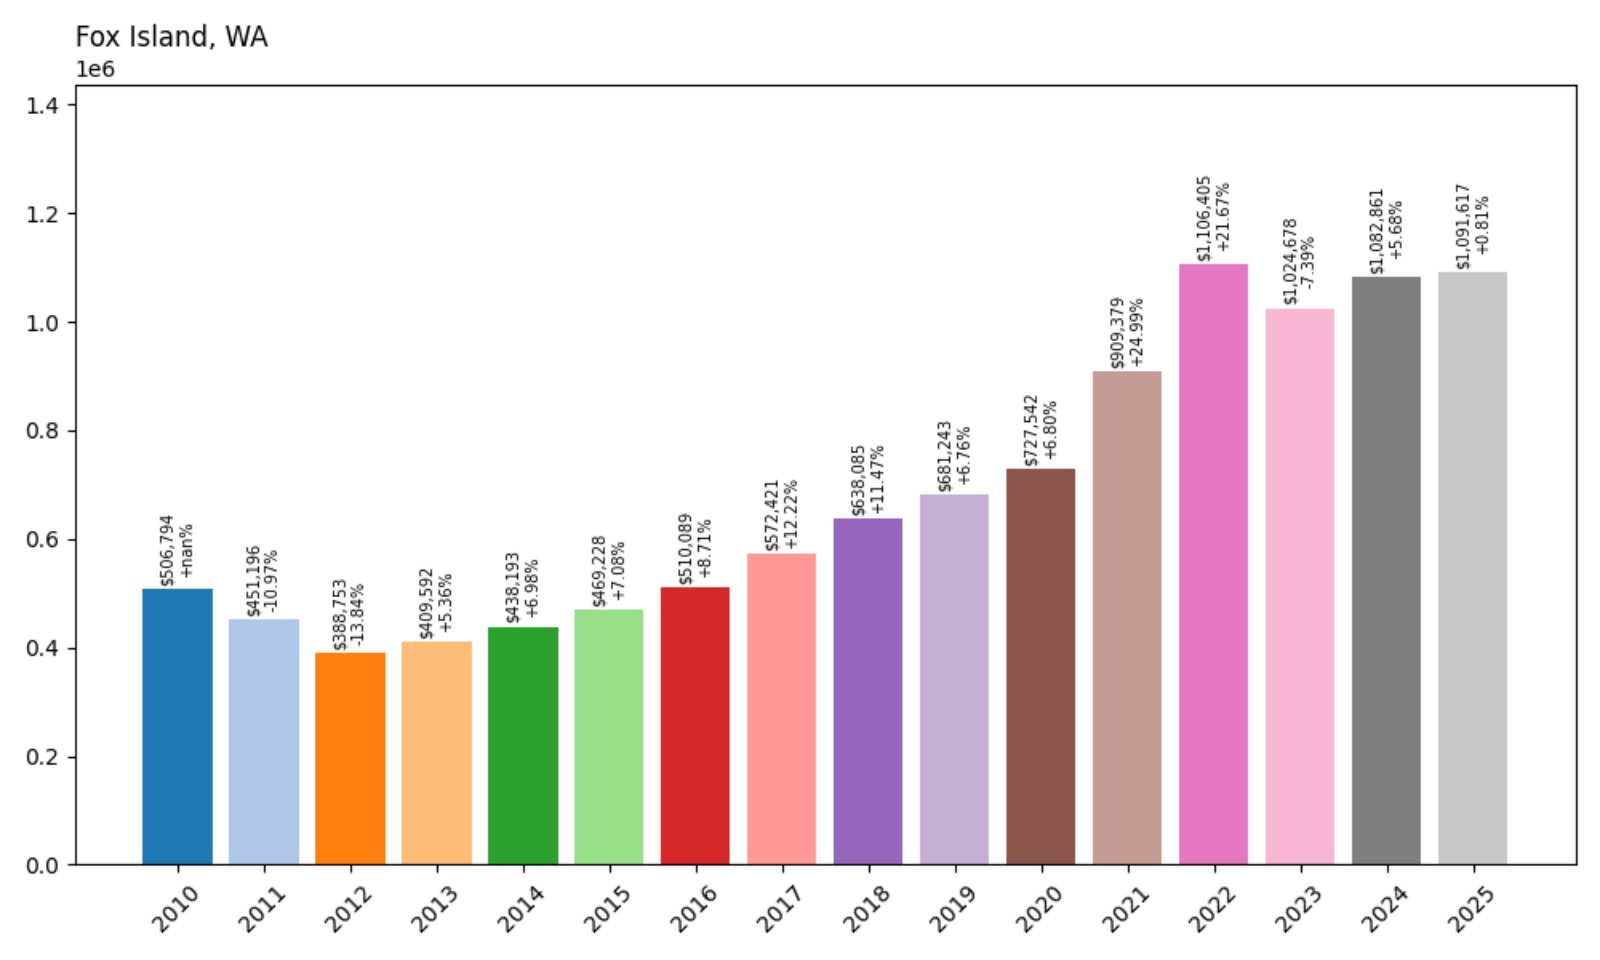
- 2010: $506,794
- 2011: $451,196 (−$55,598, −10.97%)
- 2012: $388,753 (−$62,443, −13.84%)
- 2013: $409,592 (+$20,839, +5.36%)
- 2014: $438,193 (+$28,602, +6.98%)
- 2015: $469,228 (+$31,034, +7.08%)
- 2016: $510,089 (+$40,861, +8.71%)
- 2017: $572,421 (+$62,332, +12.22%)
- 2018: $638,085 (+$65,664, +11.47%)
- 2019: $681,243 (+$43,158, +6.76%)
- 2020: $727,542 (+$46,299, +6.80%)
- 2021: $909,379 (+$181,838, +24.99%)
- 2022: $1,106,405 (+$197,026, +21.67%)
- 2023: $1,024,678 (−$81,728, −7.39%)
- 2024: $1,082,861 (+$58,183, +5.68%)
- 2025: $1,091,617 (+$8,756, +0.81%)
Fox Island home prices have increased by over 115% since 2010. Following major gains during the pandemic housing surge, the market corrected slightly in 2023 but resumed upward movement. As of 2025, home values average above $1.09 million, holding steady amid market shifts.
Fox Island – Secluded Waterfront With Lasting Value
🔥 Would you like to save this?
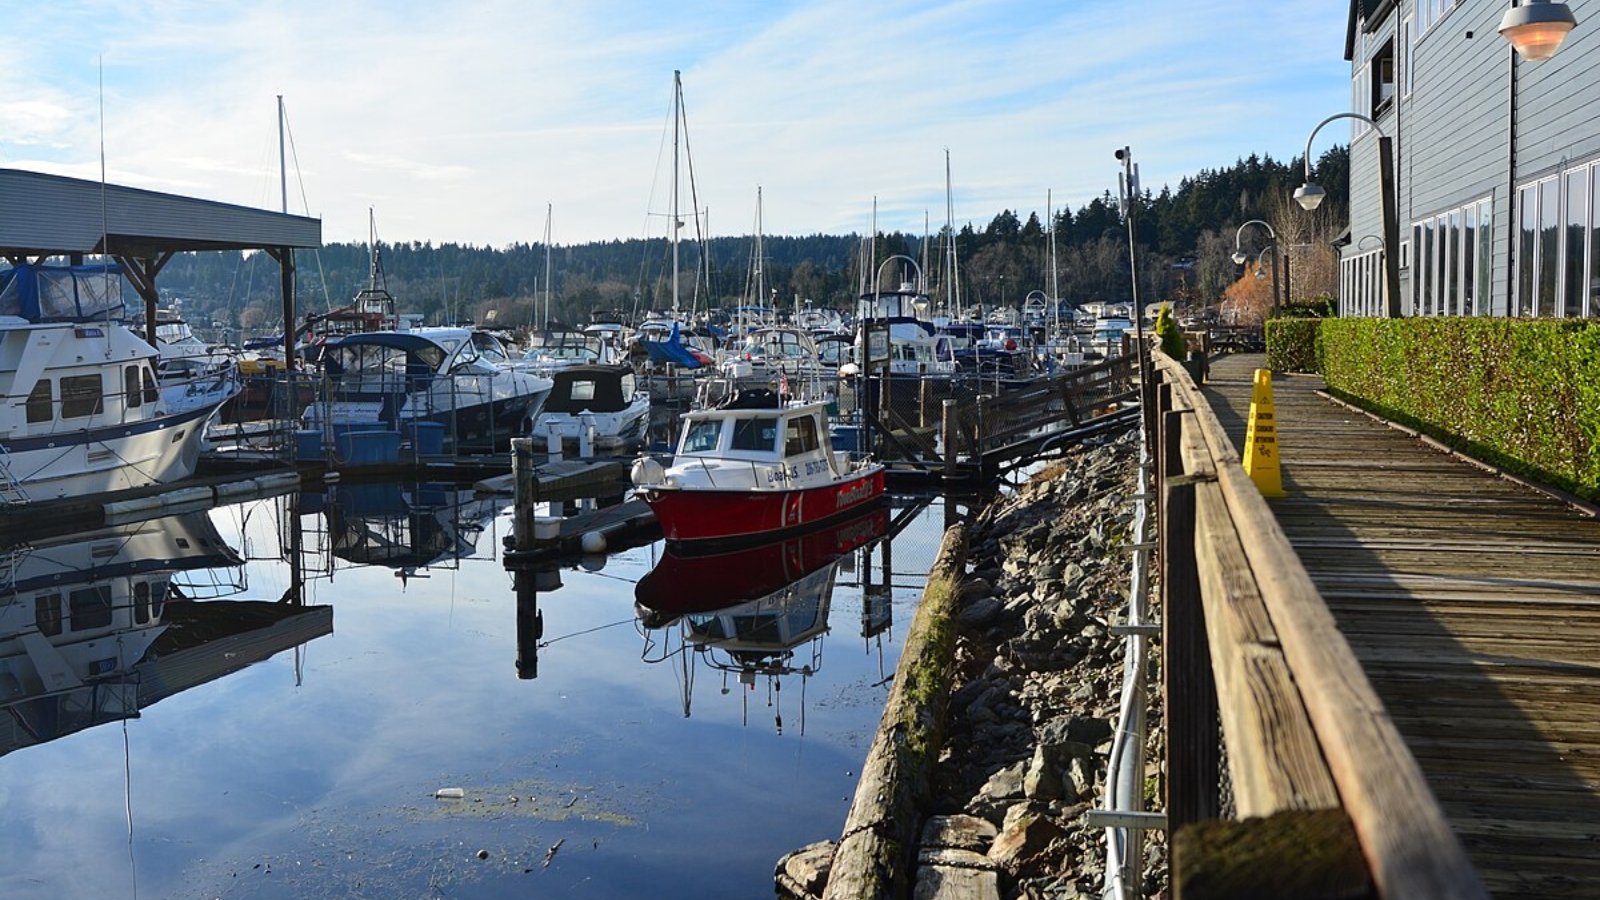
Connected to Gig Harbor by a narrow bridge, Fox Island offers secluded island living without ferry dependence. With views of Puget Sound, the Olympics, and Mount Rainier, it’s a magnet for luxury buyers and retirees seeking peace and privacy.
The market here remains competitive due to limited land and a high percentage of custom homes. Waterfront access, beaches, and parks make the island desirable year-round. Though price growth has slowed, Fox Island continues to command top-tier values among Washington’s coastal communities.
18. Bothell – 197% Home Price Increase Since 2010
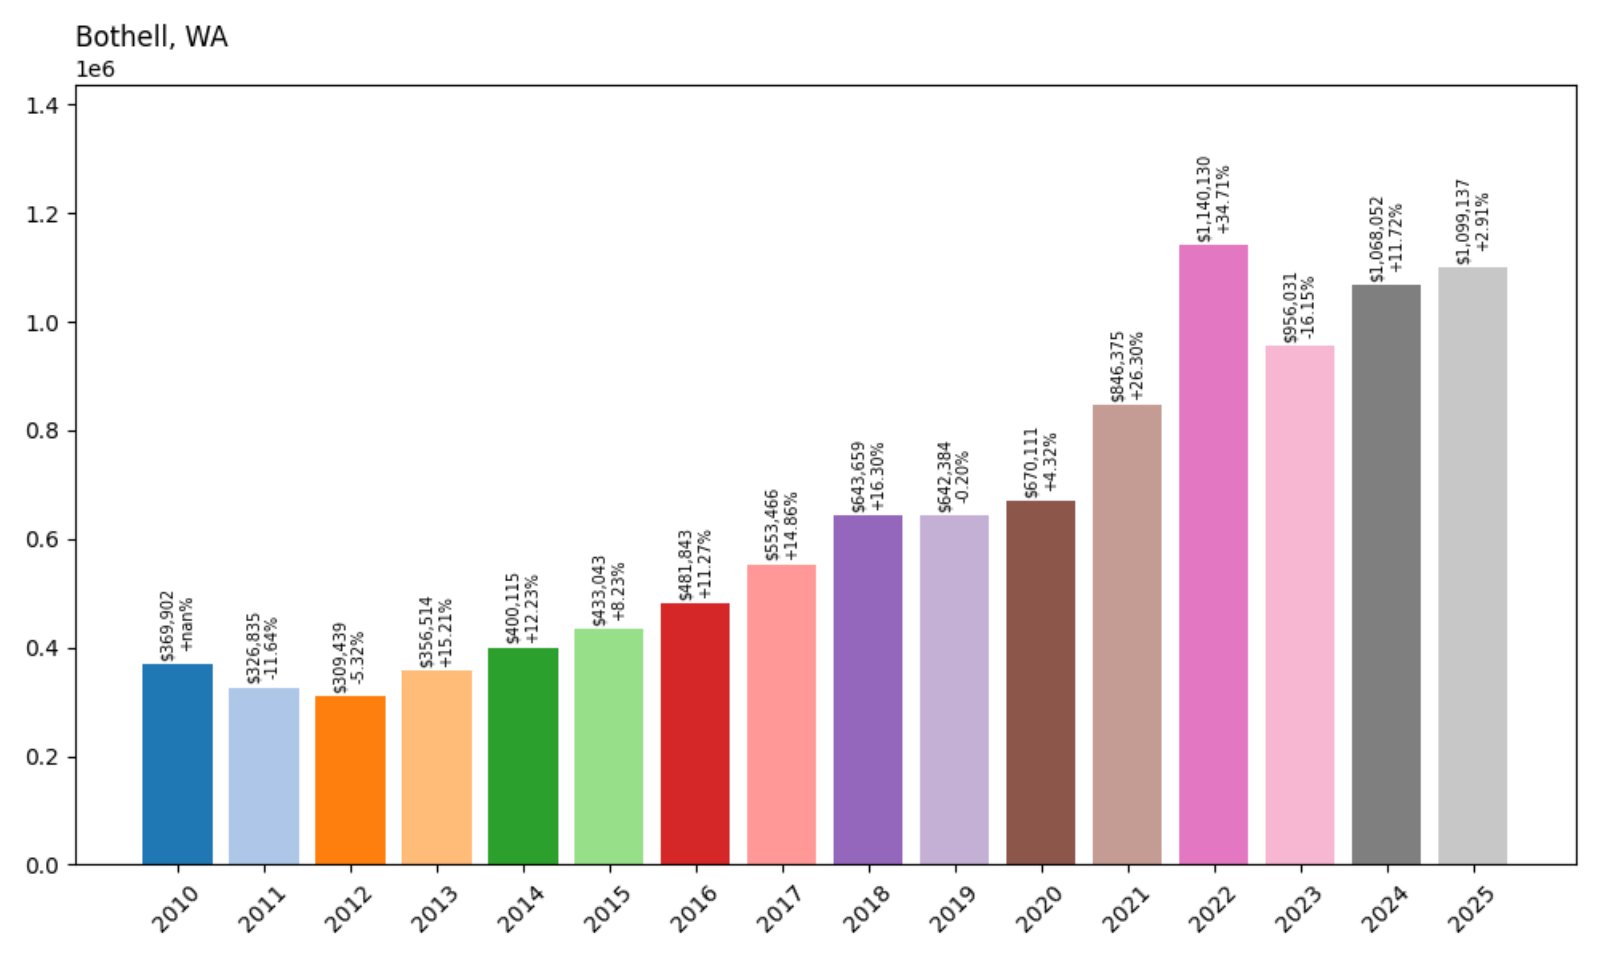
- 2010: $369,902
- 2011: $326,835 (−$43,067, −11.64%)
- 2012: $309,439 (−$17,396, −5.32%)
- 2013: $356,514 (+$47,075, +15.21%)
- 2014: $400,115 (+$43,601, +12.23%)
- 2015: $433,043 (+$32,928, +8.23%)
- 2016: $481,843 (+$48,799, +11.27%)
- 2017: $553,466 (+$71,623, +14.86%)
- 2018: $643,659 (+$90,193, +16.30%)
- 2019: $642,384 (−$1,275, −0.20%)
- 2020: $670,111 (+$27,727, +4.32%)
- 2021: $846,375 (+$176,264, +26.30%)
- 2022: $1,140,130 (+$293,754, +34.71%)
- 2023: $956,031 (−$184,099, −16.15%)
- 2024: $1,068,052 (+$112,021, +11.72%)
- 2025: $1,099,137 (+$31,085, +2.91%)
Bothell’s home prices have surged by nearly 200% since 2010, reaching over $1.09 million in 2025. The biggest jump came in 2021–2022, when prices soared by over $460K. While there was a significant correction in 2023, recovery has been steady and continues into 2025.
Bothell – Biotech Boom and Suburban Strength
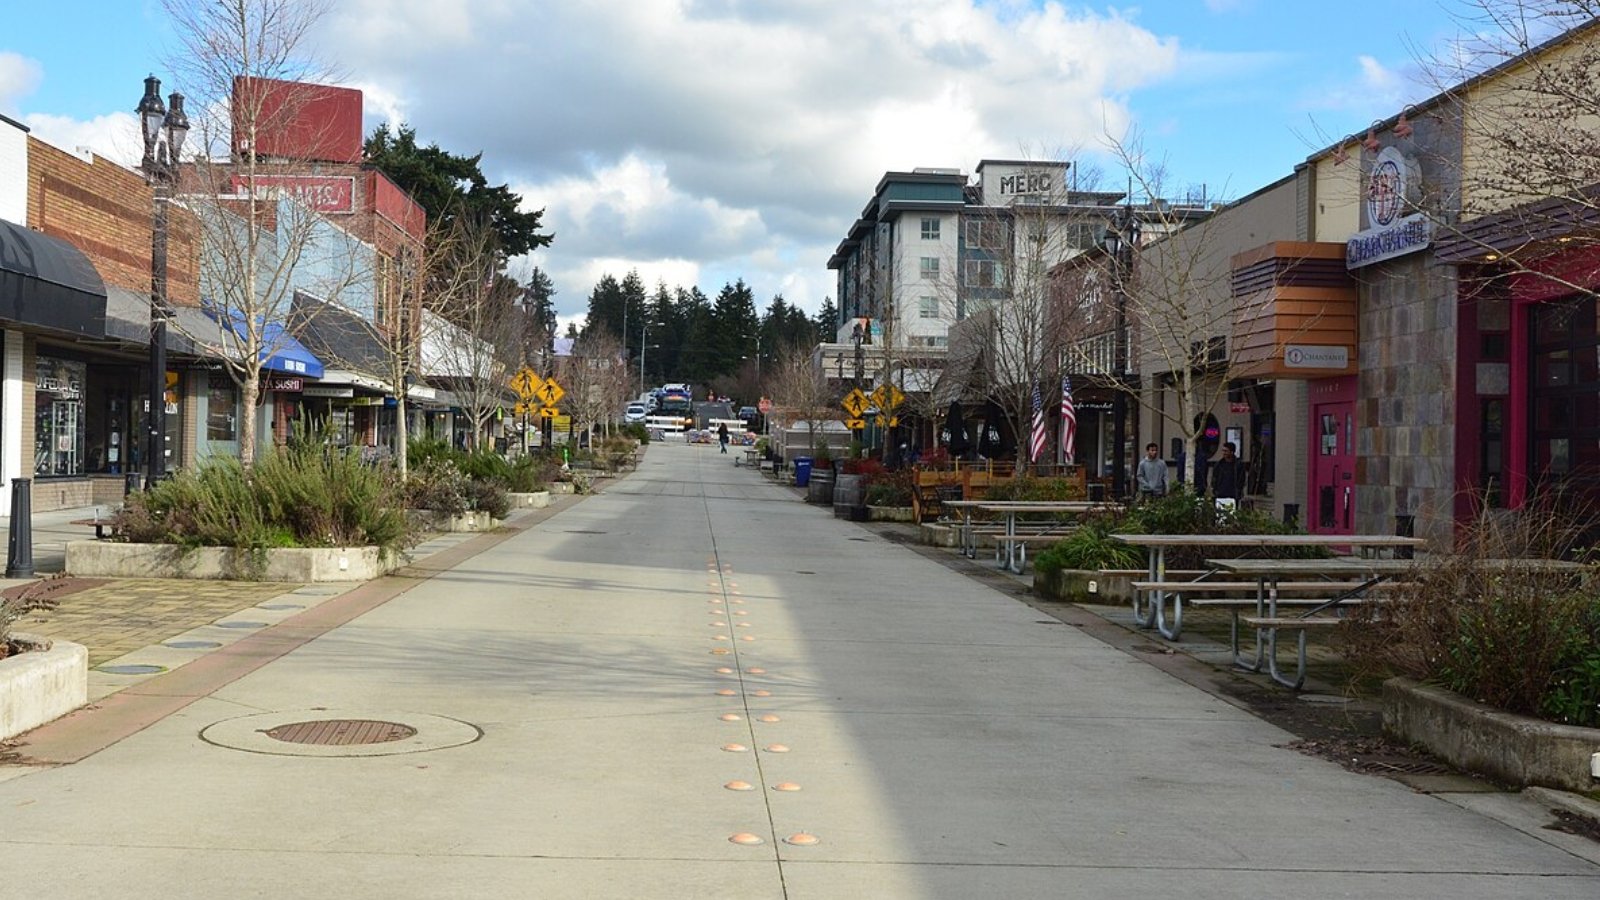
Straddling both King and Snohomish counties, Bothell has evolved into a dynamic tech and life sciences hub. With institutions like the University of Washington Bothell campus and multiple biotech firms nearby, the town has become a magnet for professionals looking for suburban space near top employers.
Strong schools, well-planned neighborhoods, and rapid commercial development contribute to the area’s appeal. As Kirkland and Bellevue prices climbed, Bothell emerged as a popular alternative, boosting demand and home values. Its growing infrastructure and job base help keep it among the most expensive towns in the region today.
17. Snoqualmie – 170% Home Price Increase Since 2010

- 2010: $426,553
- 2011: $395,862 (−$30,692, −7.20%)
- 2012: $357,929 (−$37,932, −9.58%)
- 2013: $394,068 (+$36,139, +10.10%)
- 2014: $438,926 (+$44,858, +11.38%)
- 2015: $476,410 (+$37,484, +8.54%)
- 2016: $543,818 (+$67,408, +14.15%)
- 2017: $615,570 (+$71,752, +13.19%)
- 2018: $700,978 (+$85,408, +13.87%)
- 2019: $694,168 (−$6,810, −0.97%)
- 2020: $723,850 (+$29,682, +4.28%)
- 2021: $921,487 (+$197,638, +27.30%)
- 2022: $1,208,332 (+$286,844, +31.13%)
- 2023: $1,030,992 (−$177,340, −14.68%)
- 2024: $1,122,961 (+$91,969, +8.92%)
- 2025: $1,151,435 (+$28,475, +2.54%)
Home prices in Snoqualmie have climbed more than 170% since 2010, with major growth during the 2020–2022 housing boom. While there was a setback in 2023, values quickly bounced back and continued upward into 2025, with the average home now topping $1.15 million.
Snoqualmie – Natural Beauty and High Demand
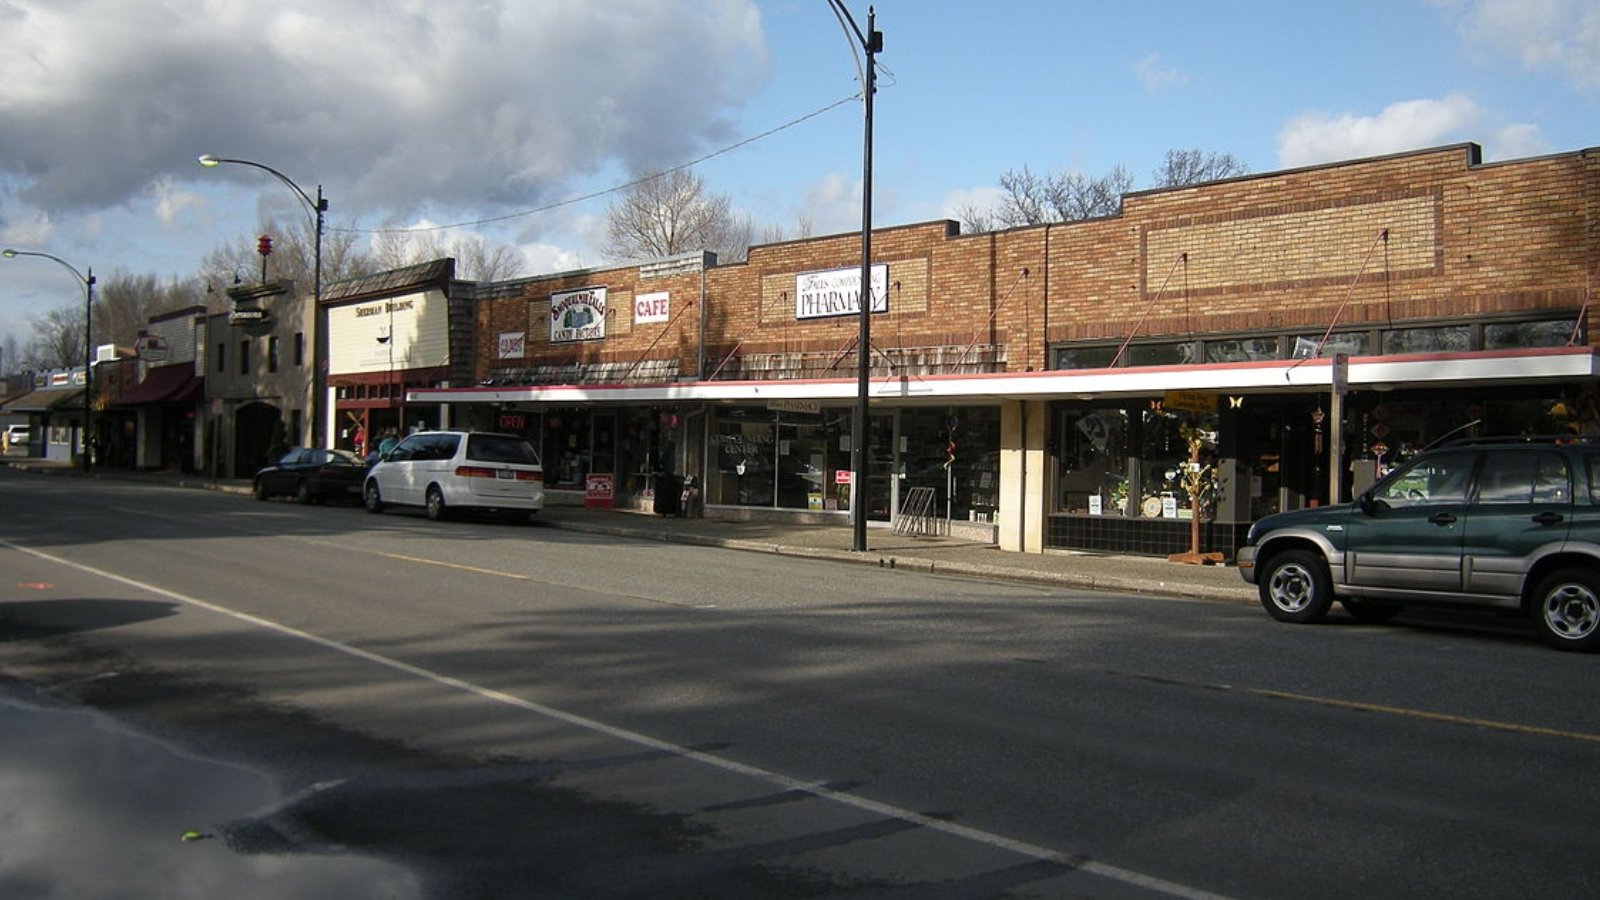
Set against the dramatic backdrop of Snoqualmie Falls and the Cascade foothills, Snoqualmie offers a rare combination of scenic beauty and suburban convenience. Its master-planned communities, golf courses, and trails have made it especially popular with families and remote workers.
The town’s location along I-90 allows for easy commuting into Bellevue or Seattle while preserving access to hiking and skiing destinations. That balance of outdoor lifestyle and accessibility helped drive strong demand, and although the market cooled slightly in 2023, it regained momentum quickly in the following years.
16. Issaquah – 165% Home Price Increase Since 2010
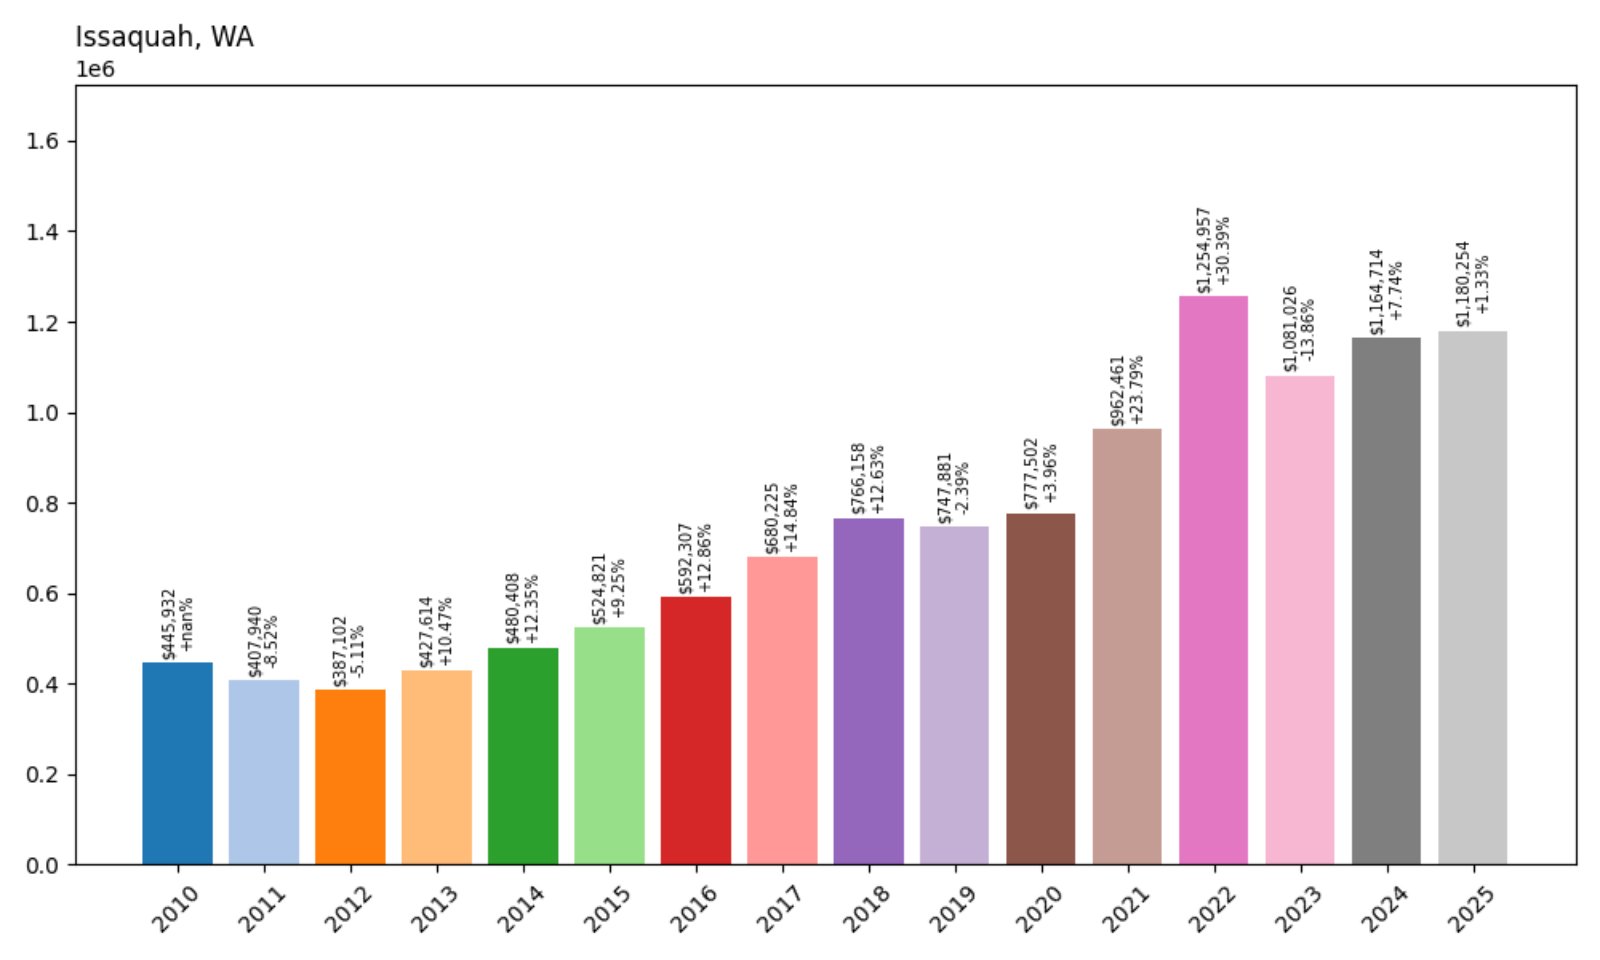
- 2010: $445,932
- 2011: $407,940 (−$37,991, −8.52%)
- 2012: $387,102 (−$20,839, −5.11%)
- 2013: $427,614 (+$40,513, +10.47%)
- 2014: $480,408 (+$52,794, +12.35%)
- 2015: $524,821 (+$44,414, +9.25%)
- 2016: $592,307 (+$67,486, +12.86%)
- 2017: $680,225 (+$87,918, +14.84%)
- 2018: $766,158 (+$85,933, +12.63%)
- 2019: $747,881 (−$18,277, −2.39%)
- 2020: $777,502 (+$29,621, +3.96%)
- 2021: $962,461 (+$184,959, +23.79%)
- 2022: $1,254,957 (+$292,496, +30.39%)
- 2023: $1,081,026 (−$173,931, −13.86%)
- 2024: $1,164,714 (+$83,688, +7.74%)
- 2025: $1,180,254 (+$15,540, +1.33%)
Issaquah’s home values have more than doubled since 2010, rising to over $1.18 million in 2025. While the town experienced a dip in 2023, growth resumed in the following years. The price trajectory reflects continued popularity and proximity to key employment centers.
Issaquah – High-Growth Hub on the Eastside
Issaquah sits just east of Bellevue along I-90 and has developed into one of King County’s most desirable suburban cities. Its walkable downtown, good schools, and extensive hiking and biking trails give it broad appeal for buyers seeking lifestyle and location.
The city has grown rapidly over the past decade as tech workers and families have moved in, attracted by newer housing developments and easy access to Microsoft, Amazon, and other major employers. The rise in prices reflects that steady demand and limited land for expansion.
15. Bainbridge Island – 120% Home Price Increase Since 2010

- 2010: $543,993
- 2011: $503,926 (−$40,067, −7.37%)
- 2012: $456,322 (−$47,604, −9.45%)
- 2013: $472,922 (+$16,601, +3.64%)
- 2014: $515,493 (+$42,571, +9.00%)
- 2015: $565,216 (+$49,723, +9.65%)
- 2016: $646,590 (+$81,374, +14.40%)
- 2017: $729,782 (+$83,192, +12.87%)
- 2018: $783,798 (+$54,017, +7.40%)
- 2019: $809,172 (+$25,374, +3.24%)
- 2020: $845,368 (+$36,196, +4.47%)
- 2021: $1,065,132 (+$219,764, +26.00%)
- 2022: $1,310,927 (+$245,795, +23.08%)
- 2023: $1,154,939 (−$155,988, −11.90%)
- 2024: $1,205,418 (+$50,478, +4.37%)
- 2025: $1,195,418 (−$9,999, −0.83%)
Home values on Bainbridge Island have increased from $543K in 2010 to nearly $1.2 million in 2025. The island experienced significant gains during the pandemic-era housing surge, although prices have fluctuated in recent years, showing minor declines in 2023 and 2025.
Bainbridge Island – Seclusion, Scenery, and Sustained Demand

Bainbridge Island offers ferry-access living with a blend of forest, shoreline, and small-town sophistication. Just a 35-minute ride from downtown Seattle, the island is a long-time favorite among professionals, artists, and retirees seeking privacy and natural beauty.
With strict development limits and high land values, inventory remains tight — helping to keep prices elevated even when the broader market slows. Local amenities like wineries, galleries, and top-rated schools contribute to sustained interest and strong long-term appreciation.
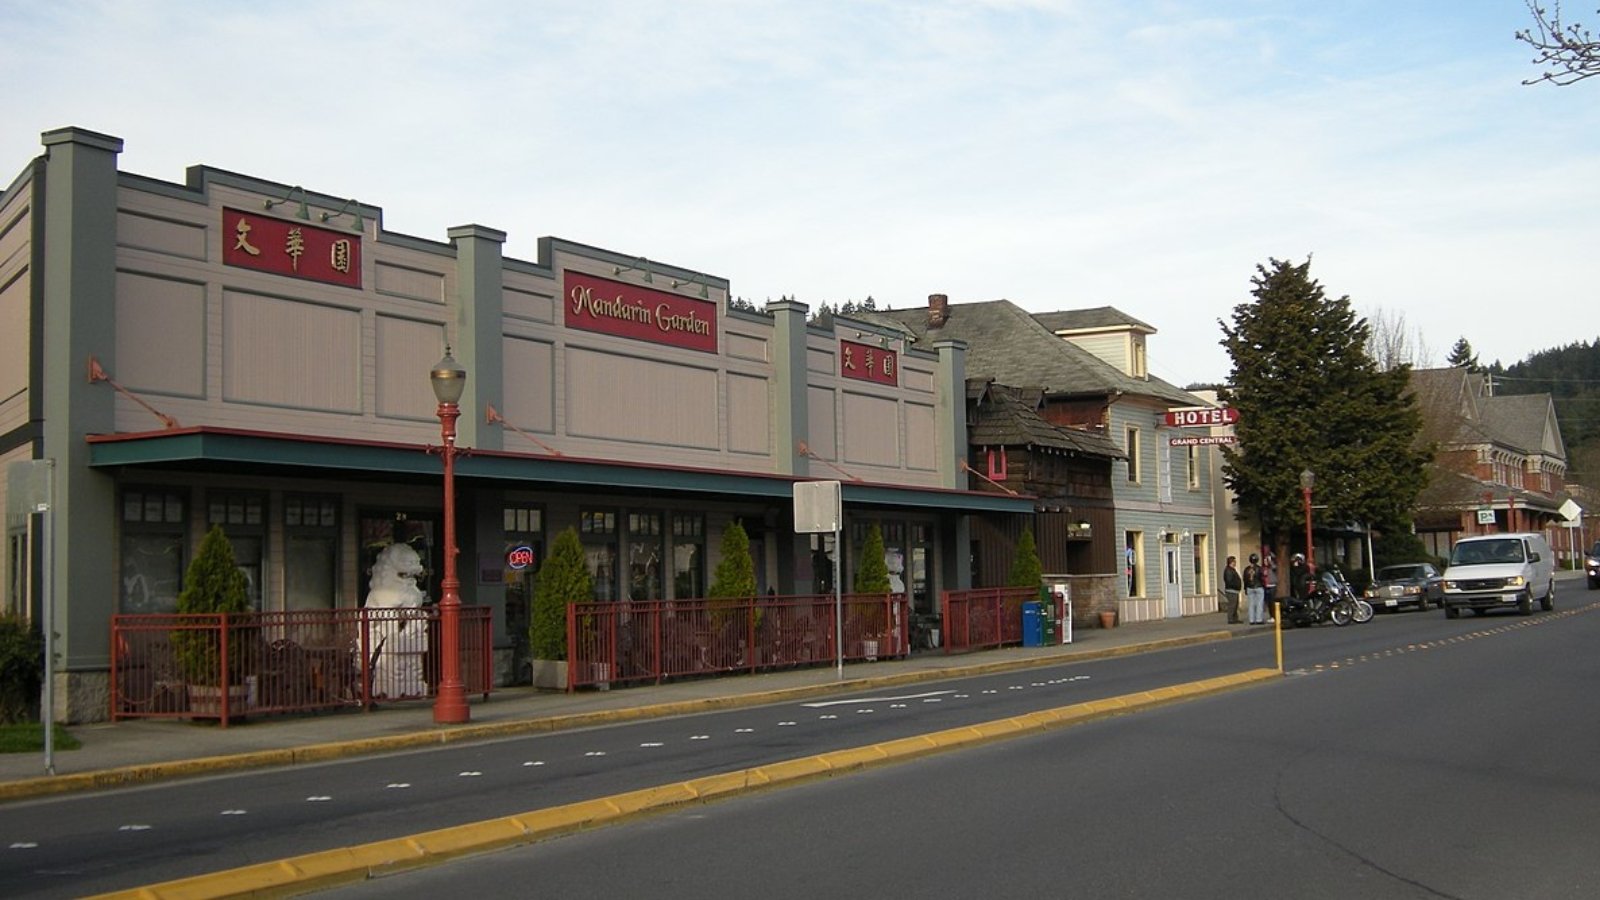
14. Fall City – 144% Home Price Increase Since 2010
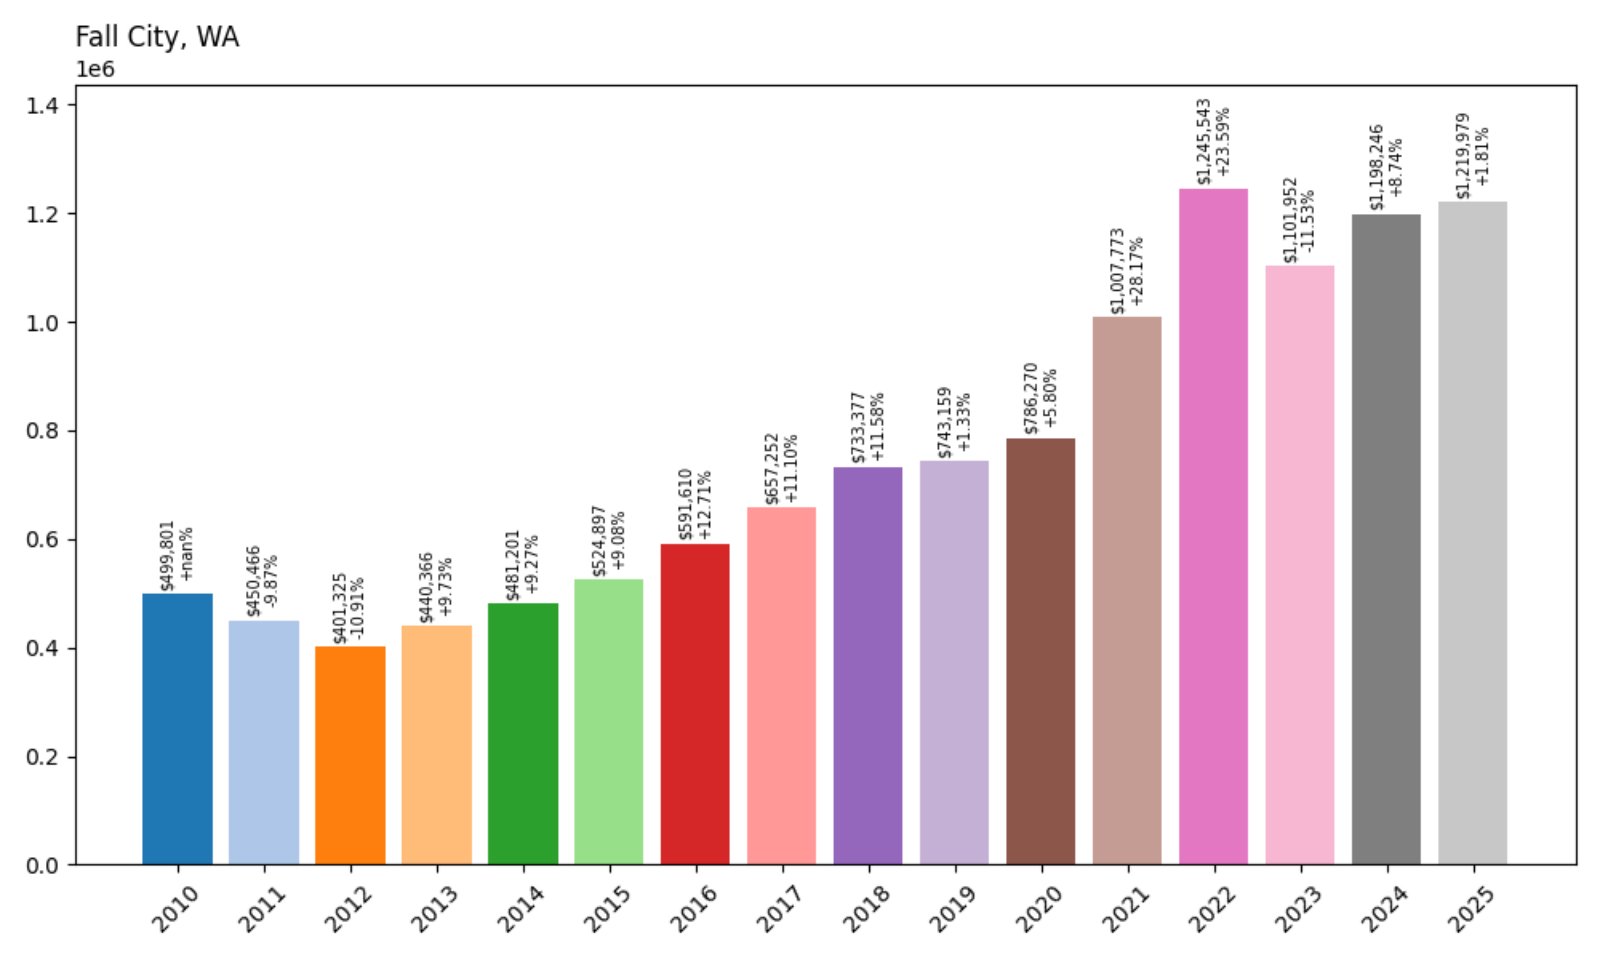
- 2010: $499,801
- 2011: $450,466 (−$49,335, −9.87%)
- 2012: $401,325 (−$49,141, −10.91%)
- 2013: $440,366 (+$39,041, +9.73%)
- 2014: $481,201 (+$40,835, +9.27%)
- 2015: $524,897 (+$43,696, +9.08%)
- 2016: $591,610 (+$66,714, +12.71%)
- 2017: $657,252 (+$65,642, +11.10%)
- 2018: $733,377 (+$76,125, +11.58%)
- 2019: $743,159 (+$9,782, +1.33%)
- 2020: $786,270 (+$43,111, +5.80%)
- 2021: $1,007,773 (+$221,503, +28.17%)
- 2022: $1,245,543 (+$237,770, +23.59%)
- 2023: $1,101,952 (−$143,591, −11.53%)
- 2024: $1,198,246 (+$96,294, +8.74%)
- 2025: $1,219,979 (+$21,733, +1.81%)
Fall City’s average home value has increased from $499K in 2010 to more than $1.2 million in 2025. Prices surged during the early 2020s, followed by a mild correction in 2023. Growth has resumed since, keeping the town among the state’s most expensive places to buy a home.
Fall City – Quiet Growth in a Rural Setting
Fall City sits east of Issaquah, nestled in the Snoqualmie River Valley. Known for wide open land, mountain views, and horse properties, the area has become attractive to buyers who want space and privacy without moving too far from the metro area.
While development is limited, the community has seen strong growth as remote work expanded options for buyers. Easy access to hiking, fishing, and country roads contributes to long-term interest. Its rural character combined with proximity to Bellevue continues to support price resilience.
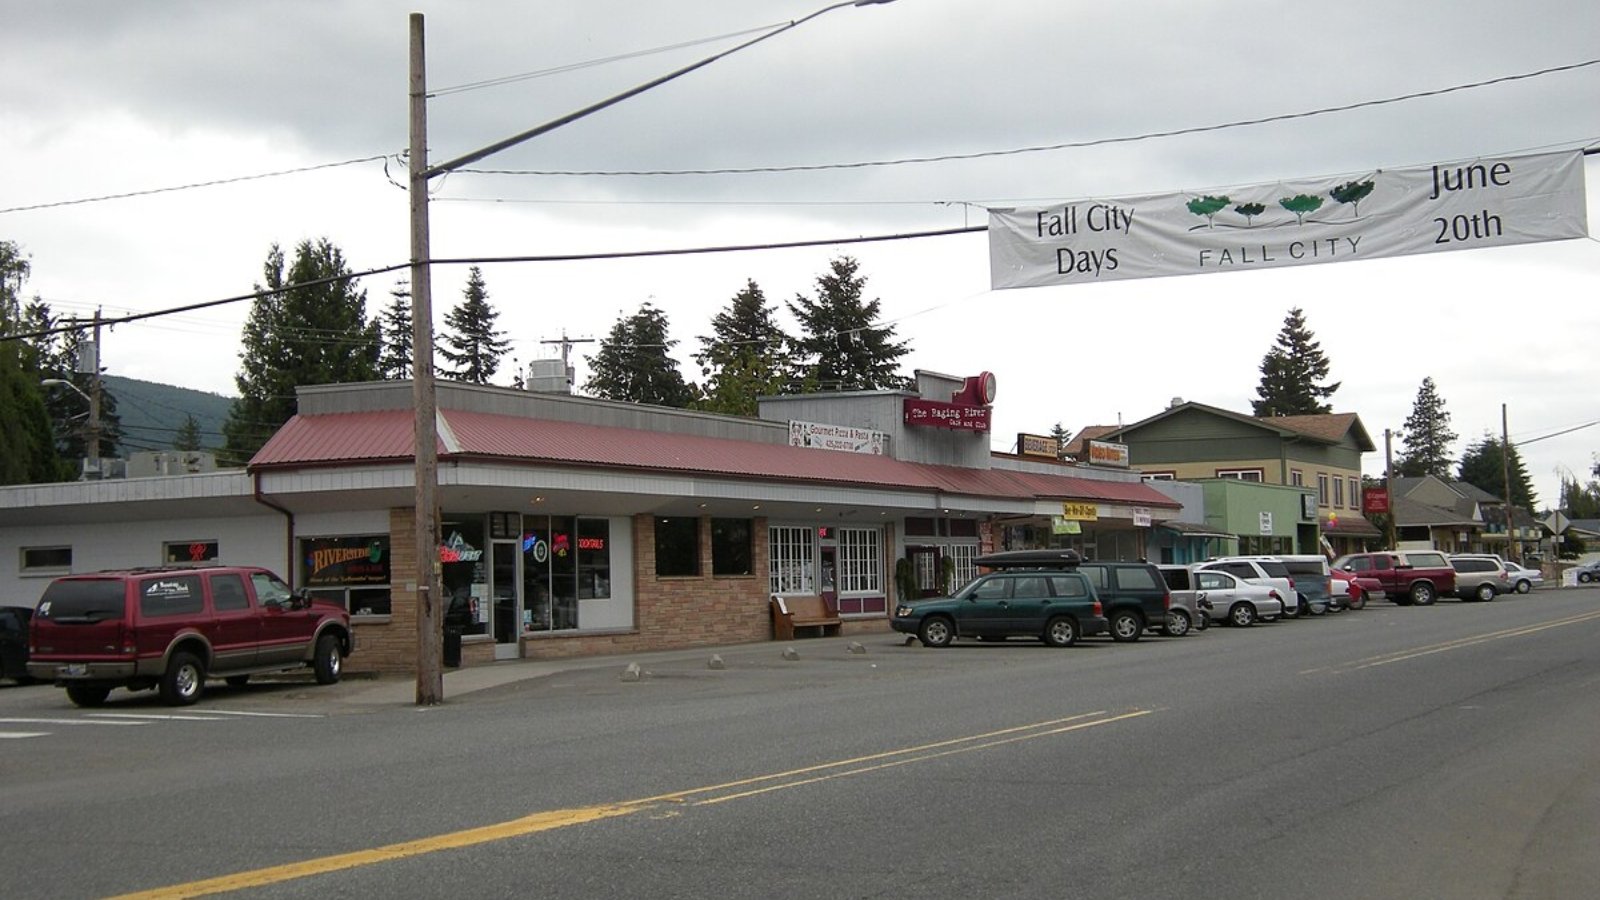
13. Kirkland – 206% Home Price Increase Since 2010
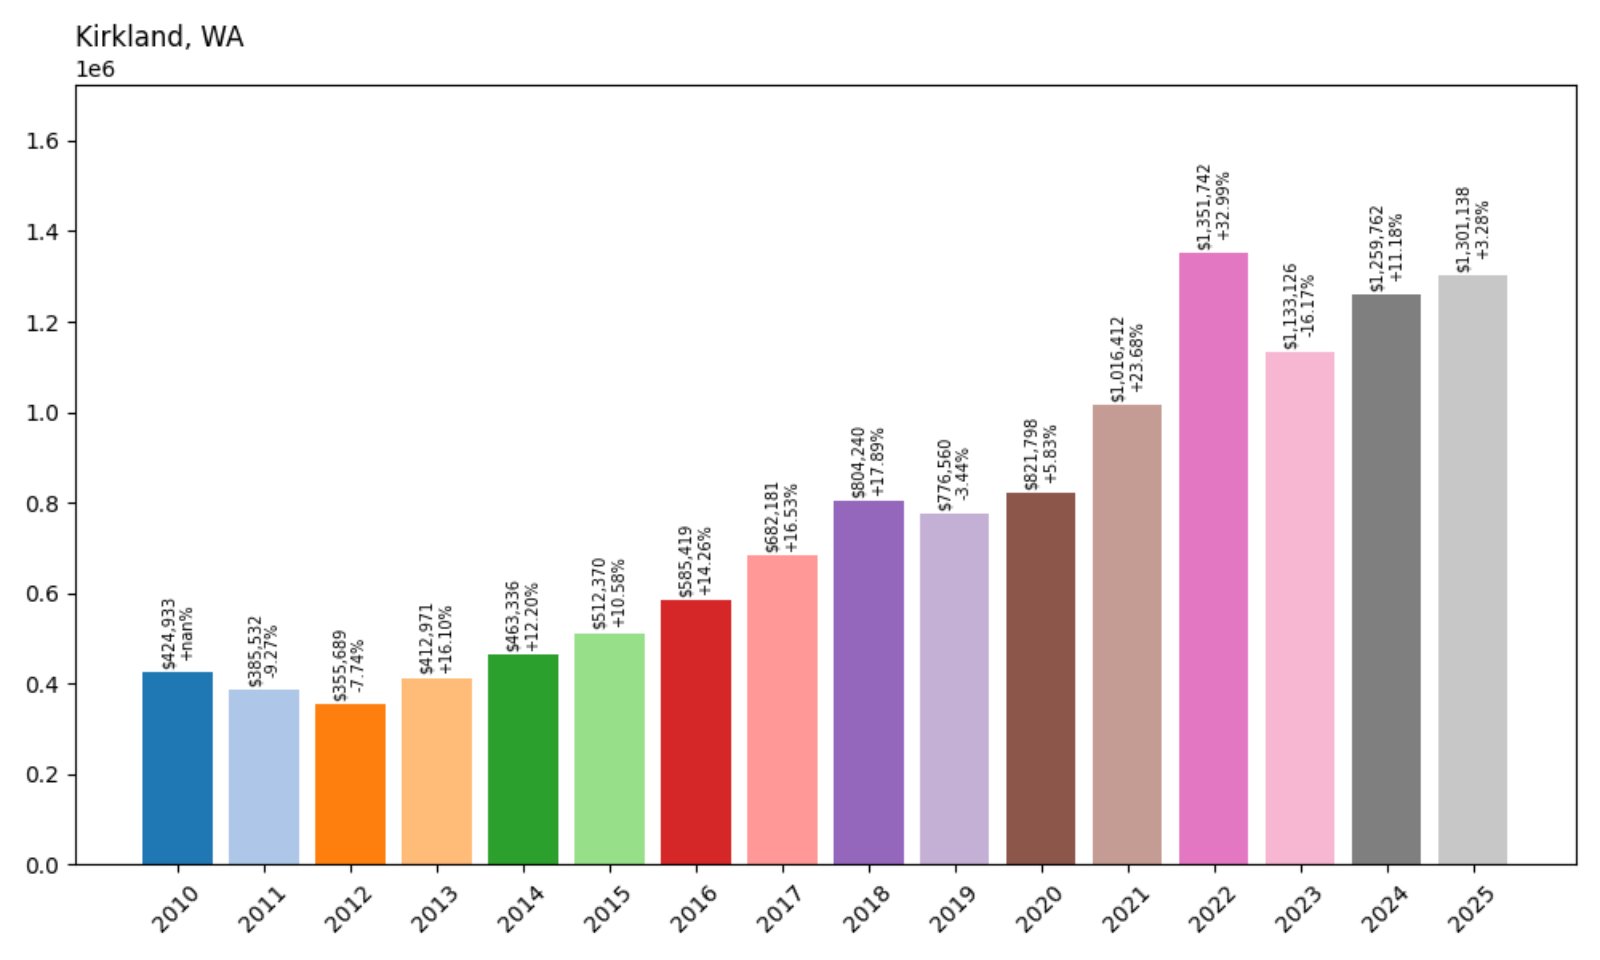
- 2010: $424,933
- 2011: $385,532 (−$39,401, −9.27%)
- 2012: $355,689 (−$29,843, −7.74%)
- 2013: $412,971 (+$57,282, +16.10%)
- 2014: $463,336 (+$50,365, +12.20%)
- 2015: $512,370 (+$49,034, +10.58%)
- 2016: $585,419 (+$73,049, +14.26%)
- 2017: $682,181 (+$96,762, +16.53%)
- 2018: $804,240 (+$122,060, +17.89%)
- 2019: $776,560 (−$27,680, −3.44%)
- 2020: $821,798 (+$45,238, +5.83%)
- 2021: $1,016,412 (+$194,614, +23.68%)
- 2022: $1,351,742 (+$335,330, +32.99%)
- 2023: $1,133,126 (−$218,616, −16.17%)
- 2024: $1,259,762 (+$126,636, +11.18%)
- 2025: $1,301,138 (+$41,376, +3.28%)
Home values in Kirkland have soared more than 200% since 2010, reaching over $1.3 million in 2025. Prices peaked in 2022 but rebounded well after a drop in 2023, highlighting the city’s continued appeal to tech professionals and high-end buyers.
Kirkland – Lakefront Living Meets Tech Expansion

Kirkland is a city that blends lakeside luxury with a vibrant downtown and proximity to major employers. Located along the eastern shore of Lake Washington, it’s a favorite for those who want the benefits of Seattle’s economy without living in the city itself.
Walkable neighborhoods, public art, and top-tier schools add to the attraction. Real estate here remains competitive due to its prime location near Google’s campus and other Eastside tech hubs. Prices remain strong, and Kirkland continues to rank among the state’s most sought-after housing markets.
12. Newcastle – 184% Home Price Increase Since 2010

- 2010: $494,741
- 2011: $458,974 (−$35,767, −7.23%)
- 2012: $443,877 (−$15,097, −3.29%)
- 2013: $499,912 (+$56,035, +12.63%)
- 2014: $548,996 (+$49,084, +9.82%)
- 2015: $592,677 (+$43,680, +7.96%)
- 2016: $665,091 (+$72,415, +12.22%)
- 2017: $751,429 (+$86,338, +12.98%)
- 2018: $856,485 (+$105,057, +13.98%)
- 2019: $852,314 (−$4,171, −0.49%)
- 2020: $889,712 (+$37,398, +4.39%)
- 2021: $1,101,252 (+$211,540, +23.77%)
- 2022: $1,453,014 (+$351,762, +31.93%)
- 2023: $1,256,336 (−$196,678, −13.53%)
- 2024: $1,369,734 (+$113,398, +9.03%)
- 2025: $1,407,135 (+$37,401, +2.73%)
Newcastle’s home values have risen 184% since 2010, climbing from just under $495,000 to more than $1.4 million by mid-2025. While values dipped in 2023 after the post-pandemic peak, steady growth in 2024 and 2025 reflects the town’s strong desirability and limited housing stock.
Newcastle – Eastside Appeal and Commuter Convenience
Nestled between Bellevue and Renton, Newcastle offers an ideal location for commuters and professionals. Its blend of upscale developments, golf courses, and parklands make it a preferred choice for Eastside buyers who want suburban serenity without sacrificing convenience.
With quick access to I-405, strong schools, and high-income demographics, Newcastle’s home values have remained resilient through recent market shifts. Newer construction and master-planned neighborhoods contribute to its premium pricing in 2025.
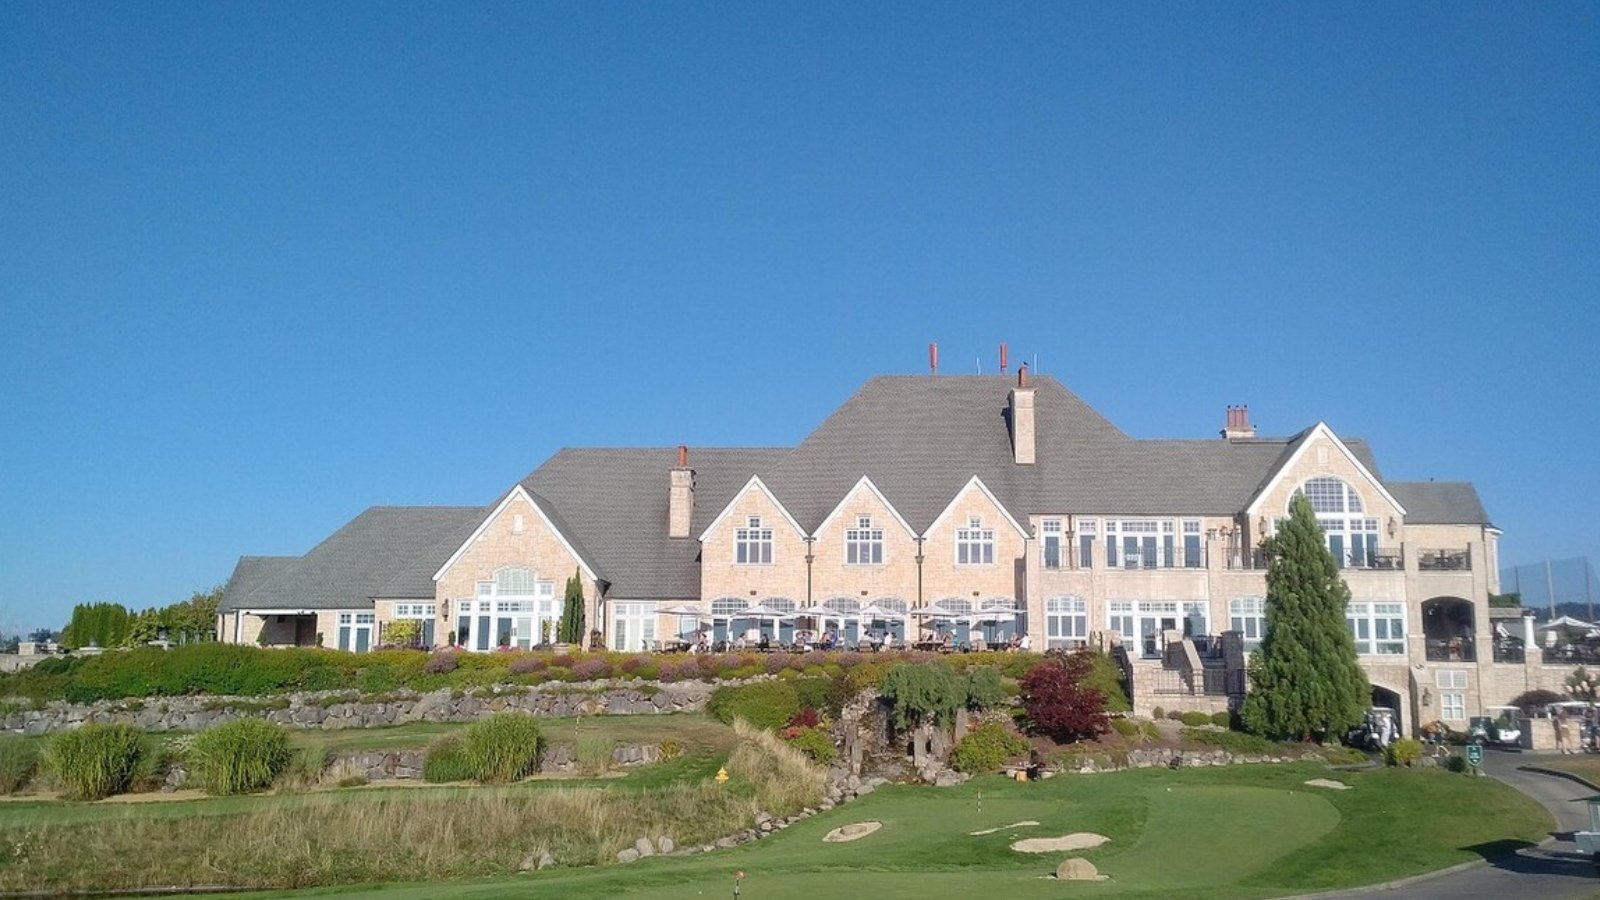
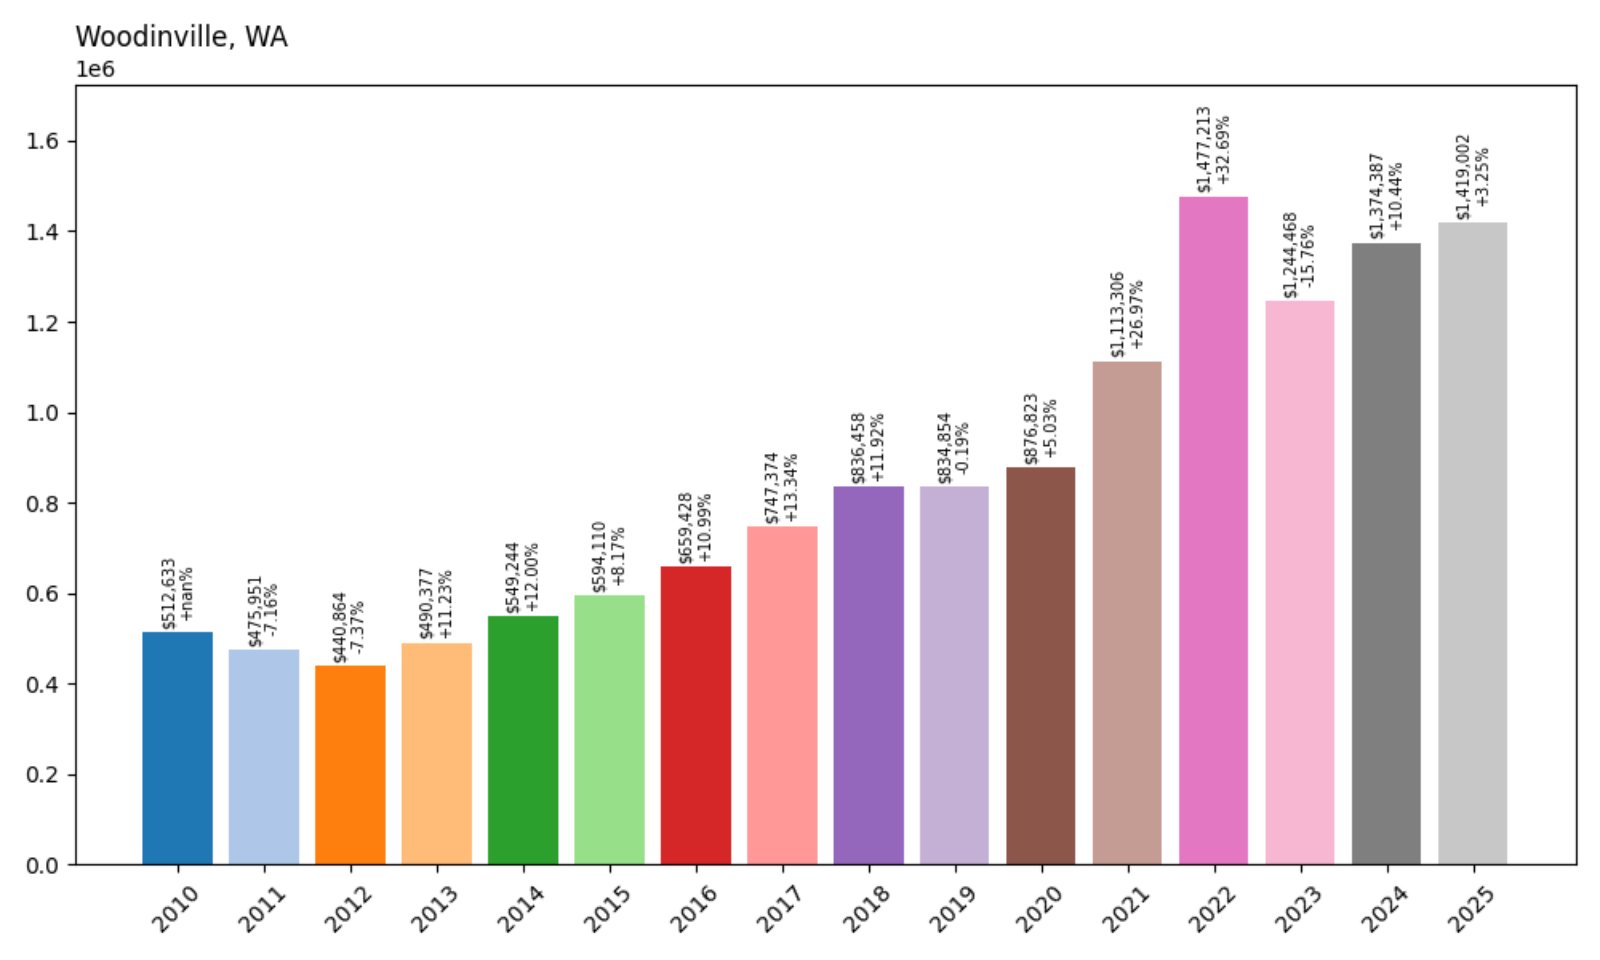
11. Woodinville – 177% Home Price Increase Since 2010
- 2010: $512,633
- 2011: $475,951 (−$36,682, −7.16%)
- 2012: $440,864 (−$35,087, −7.37%)
- 2013: $490,377 (+$49,513, +11.23%)
- 2014: $549,244 (+$58,867, +12.01%)
- 2015: $594,110 (+$44,866, +8.17%)
- 2016: $659,428 (+$65,317, +11.00%)
- 2017: $747,374 (+$87,946, +13.34%)
- 2018: $836,458 (+$89,084, +11.92%)
- 2019: $834,854 (−$1,604, −0.19%)
- 2020: $876,823 (+$41,969, +5.02%)
- 2021: $1,113,306 (+$236,483, +26.97%)
- 2022: $1,477,213 (+$363,907, +32.69%)
- 2023: $1,244,468 (−$232,745, −15.75%)
- 2024: $1,374,387 (+$129,919, +10.44%)
- 2025: $1,419,002 (+$44,615, +3.25%)
Home prices in Woodinville have jumped 177% since 2010, with explosive growth between 2020 and 2022. Although values softened slightly in 2023, a strong recovery through 2025 pushed prices past $1.41 million, showing continued demand for this Eastside favorite.
Woodinville – Wine Country With Suburban Luxury
Known for its wineries, wooded estates, and proximity to tech hubs, Woodinville blends rustic charm with modern amenities. It has become a popular destination for buyers looking to upgrade to larger homes on spacious lots, particularly during the remote-work era.
Limited new development, high-rated schools, and easy access to Redmond and Kirkland continue to drive prices higher. Its distinctive lifestyle and proximity to the Sammamish River Trail and tasting rooms make it one of the most expensive housing markets in Washington.
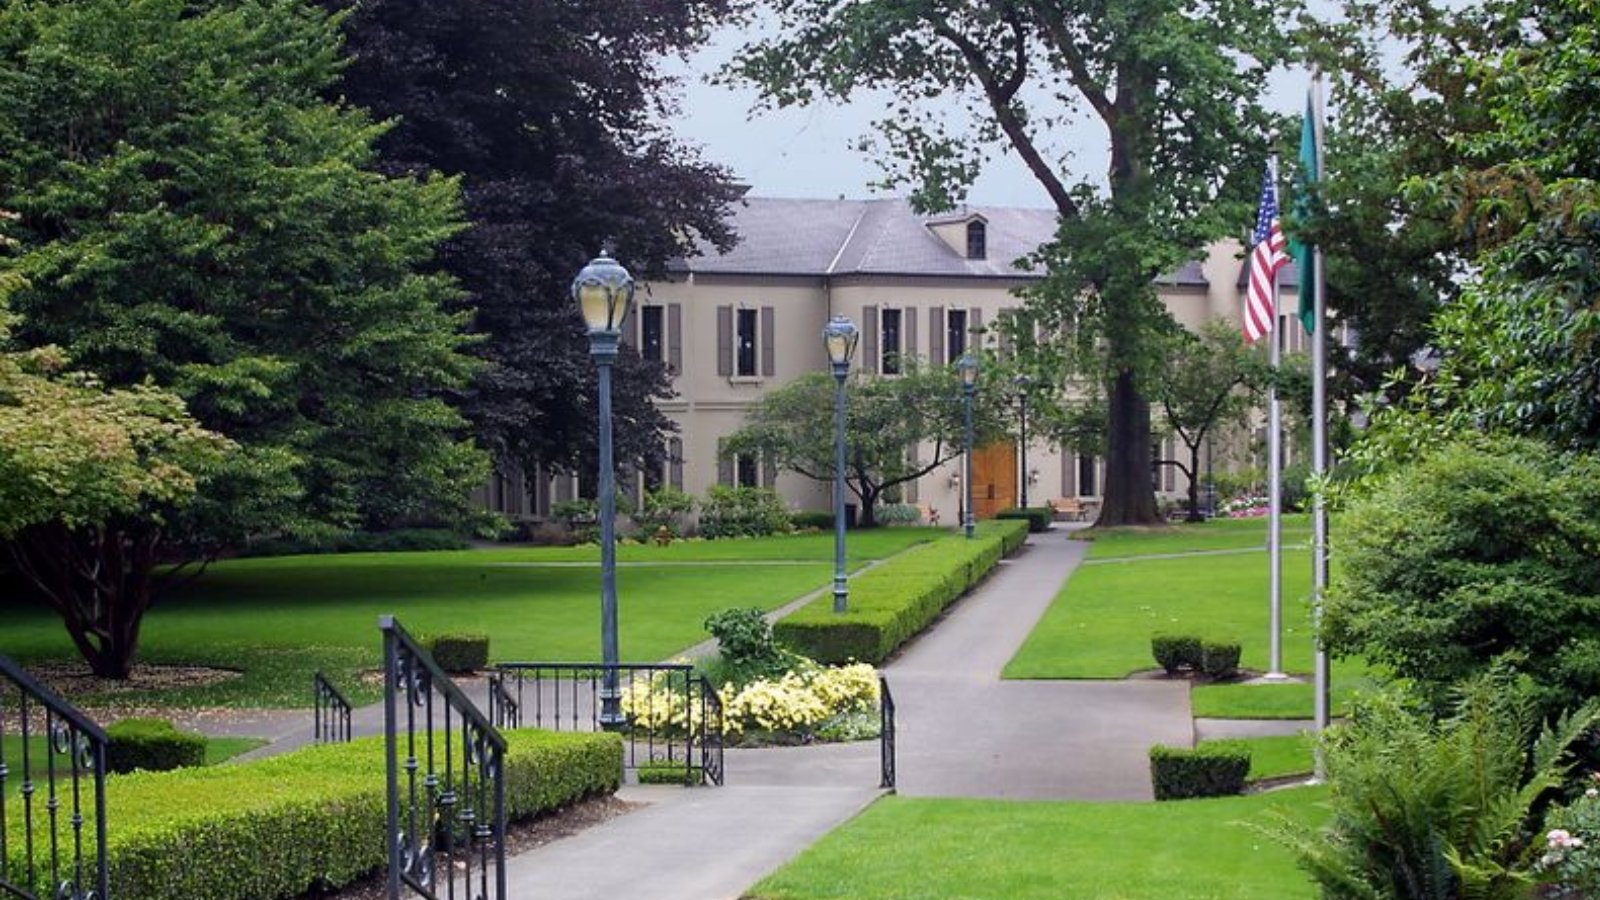
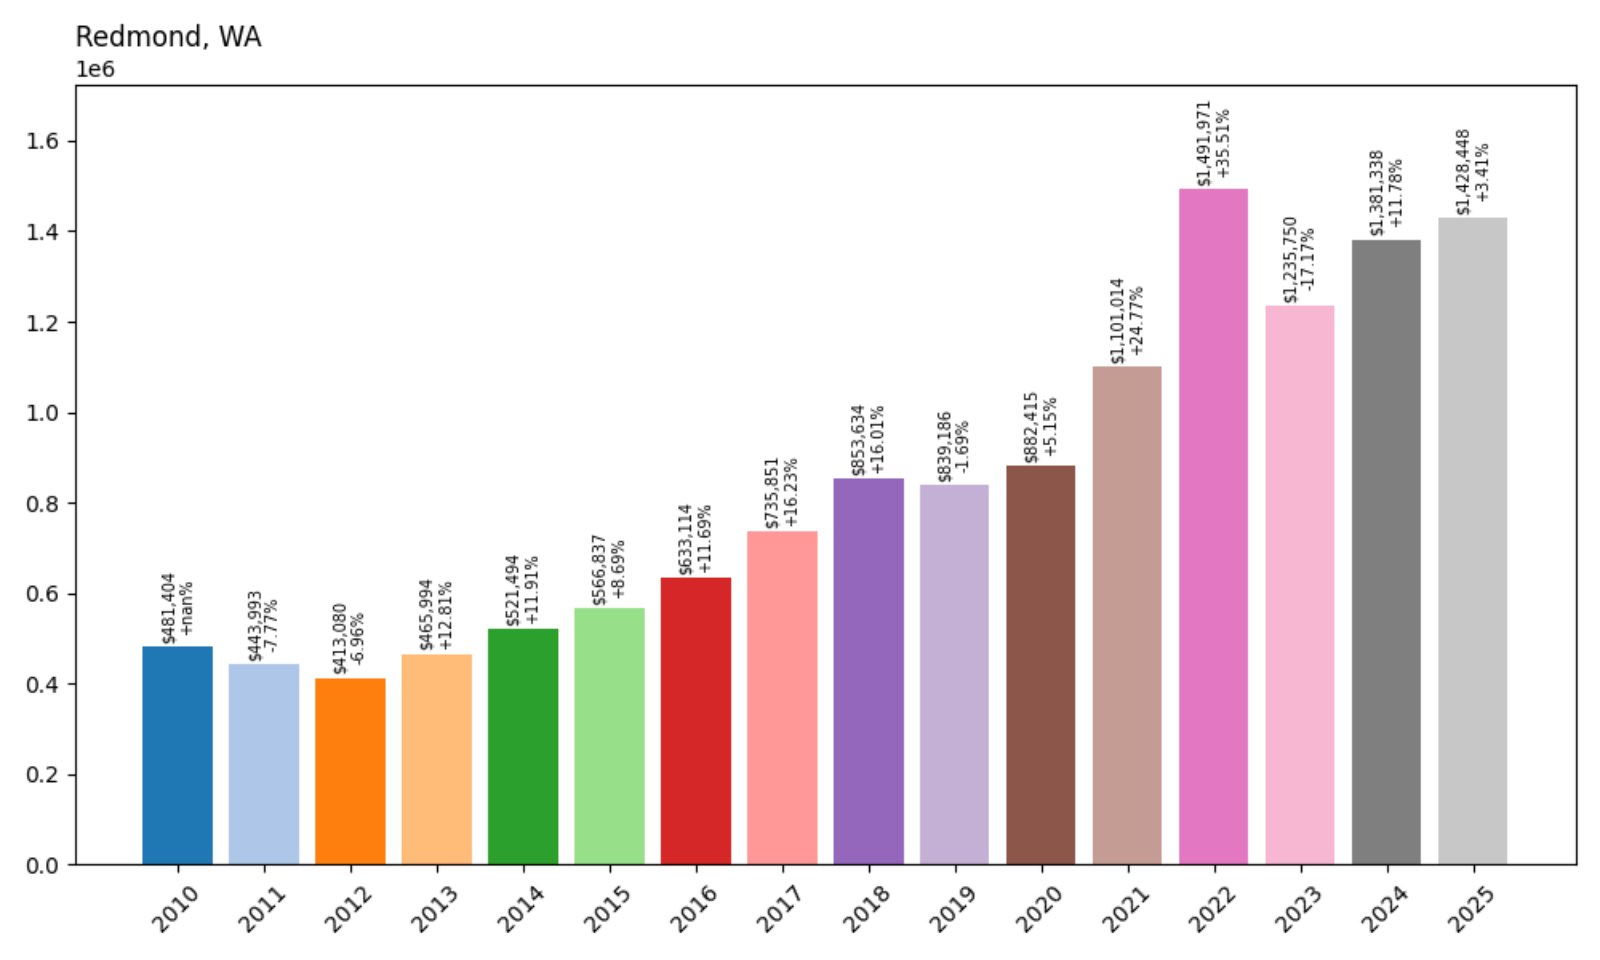
10. Redmond – 197% Home Price Increase Since 2010
- 2010: $481,404
- 2011: $443,993 (−$37,411, −7.77%)
- 2012: $413,080 (−$30,913, −6.96%)
- 2013: $465,994 (+$52,914, +12.81%)
- 2014: $521,494 (+$55,500, +11.91%)
- 2015: $566,837 (+$45,343, +8.70%)
- 2016: $633,114 (+$66,277, +11.69%)
- 2017: $735,851 (+$102,737, +16.23%)
- 2018: $853,634 (+$117,783, +16.01%)
- 2019: $839,186 (−$14,448, −1.69%)
- 2020: $882,415 (+$43,229, +5.15%)
- 2021: $1,101,014 (+$218,599, +24.77%)
- 2022: $1,491,971 (+$390,957, +35.50%)
- 2023: $1,235,750 (−$256,221, −17.18%)
- 2024: $1,381,338 (+$145,588, +11.78%)
- 2025: $1,428,448 (+$47,110, +3.41%)
Redmond’s home prices have nearly tripled since 2010, climbing from $481K to over $1.42 million by 2025. The city saw its most significant appreciation between 2020 and 2022, largely driven by tech industry growth and remote work flexibility.
Redmond – Microsoft’s Backyard and a Real Estate Magnet

Home to Microsoft’s global headquarters, Redmond is one of the state’s most economically dynamic cities. Its job market, walkable downtown, and transit infrastructure have fueled both population growth and rising housing demand over the past decade.
The demand for homes near Redmond’s expanding tech sector has pushed prices up faster than most neighboring areas. Parks, trails, and city investments in housing and transportation keep it competitive in 2025 despite recent cooling in the market.
9. Bellevue – 203% Home Price Increase Since 2010

- 2010: $507,729
- 2011: $466,967 (−$40,762, −8.03%)
- 2012: $441,468 (−$25,499, −5.46%)
- 2013: $509,643 (+$68,174, +15.45%)
- 2014: $567,002 (+$57,359, +11.25%)
- 2015: $623,616 (+$56,614, +9.98%)
- 2016: $710,088 (+$86,472, +13.86%)
- 2017: $819,698 (+$109,610, +15.43%)
- 2018: $961,630 (+$141,932, +17.32%)
- 2019: $937,111 (−$24,519, −2.55%)
- 2020: $983,193 (+$46,082, +4.92%)
- 2021: $1,191,891 (+$208,698, +21.23%)
- 2022: $1,603,858 (+$411,967, +34.57%)
- 2023: $1,345,199 (−$258,659, −16.13%)
- 2024: $1,479,067 (+$133,868, +9.95%)
- 2025: $1,540,080 (+$61,013, +4.13%)
Since 2010, Bellevue’s home prices have surged over 200%, solidifying its place as one of Washington’s most elite housing markets. The city experienced record-breaking growth during 2021–2022, followed by modest pullbacks and a return to stability by 2025.
Bellevue – The Eastside’s Urban Core
Bellevue has evolved into a high-rise tech city, rivaling Seattle in business, amenities, and real estate value. With companies like Amazon, Meta, and Microsoft expanding their footprints, demand for high-end housing remains intense.
Its luxury condo towers, elite public schools, and world-class shopping continue to attract high-income buyers. Bellevue’s downtown development, coupled with access to Lake Washington and mountain views, helps explain its extraordinary home value trajectory over the past 15 years.
8. Sammamish – 208% Home Price Increase Since 2010
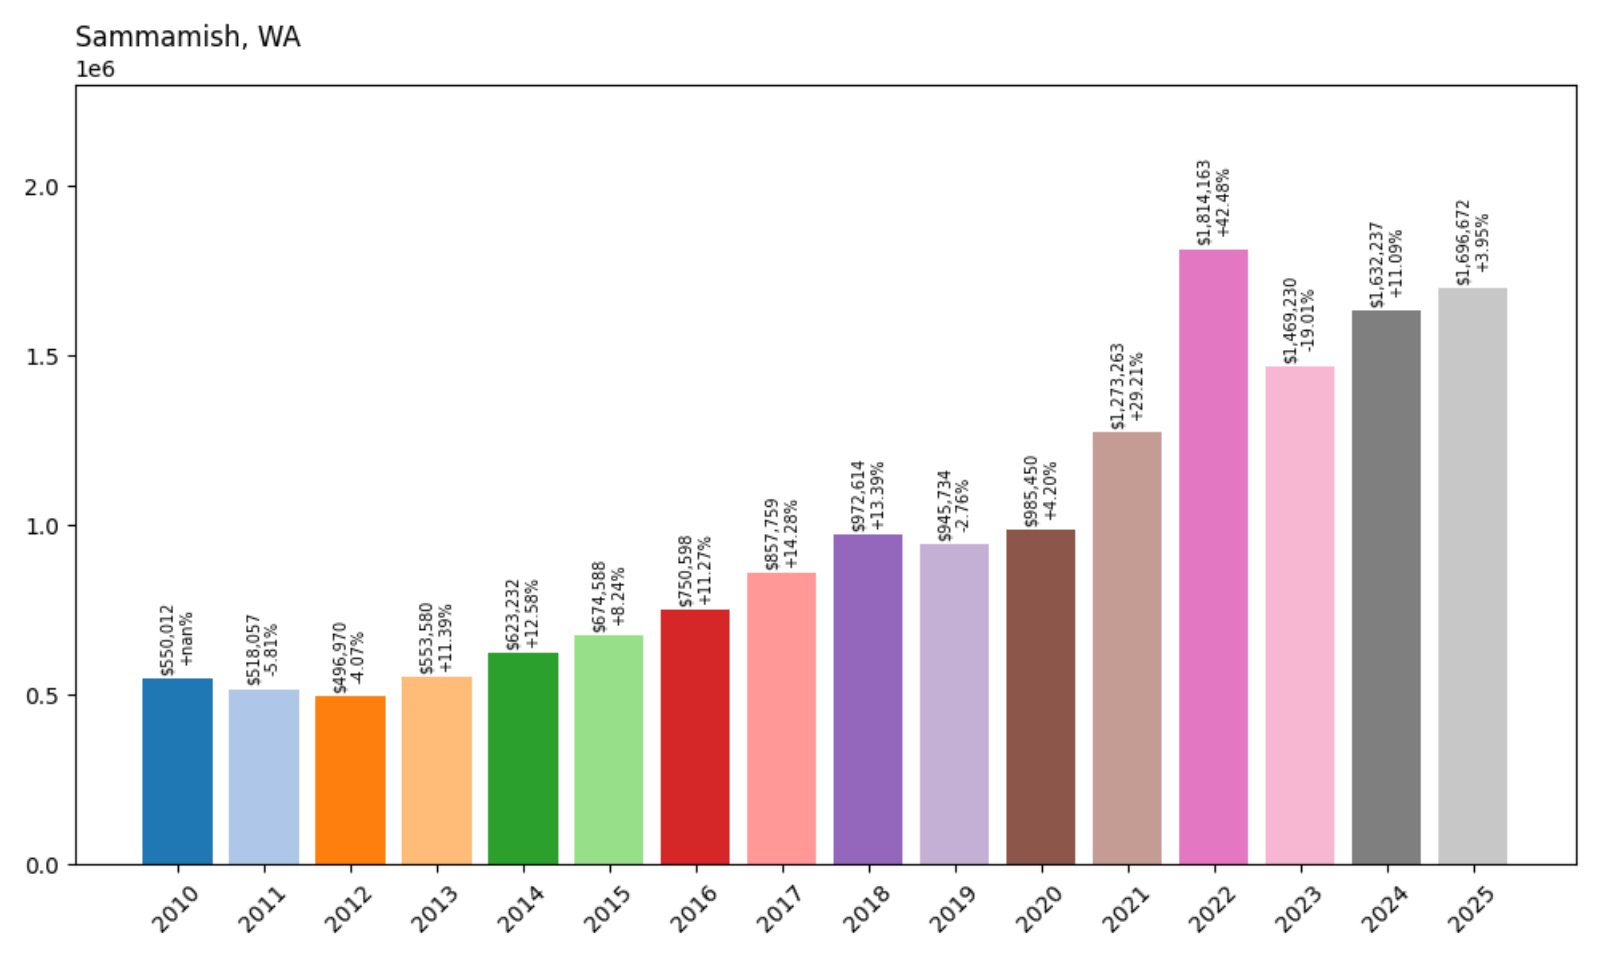
- 2010: $550,012
- 2011: $518,057 (−$31,955, −5.81%)
- 2012: $496,970 (−$21,087, −4.07%)
- 2013: $553,580 (+$56,610, +11.40%)
- 2014: $623,232 (+$69,652, +12.59%)
- 2015: $674,588 (+$51,356, +8.24%)
- 2016: $750,598 (+$76,010, +11.26%)
- 2017: $857,759 (+$107,161, +14.27%)
- 2018: $972,614 (+$114,855, +13.39%)
- 2019: $945,734 (−$26,880, −2.76%)
- 2020: $985,450 (+$39,716, +4.20%)
- 2021: $1,273,263 (+$287,813, +29.21%)
- 2022: $1,814,163 (+$540,900, +42.47%)
- 2023: $1,469,230 (−$344,933, −19.01%)
- 2024: $1,632,237 (+$163,007, +11.09%)
- 2025: $1,696,672 (+$64,435, +3.95%)
Sammamish home prices have more than tripled since 2010, rising from $550K to nearly $1.7 million by 2025. The strongest gains came during the pandemic housing boom in 2021–2022, with a notable correction in 2023. Prices have recovered steadily since then.
Sammamish – Family-Friendly and High-Income Living
Perched on the Eastside plateau, Sammamish is often ranked among the best places to live in Washington, especially for families. Known for its top-tier public schools, abundant parks, and large modern homes, the city appeals to professionals commuting to nearby Bellevue or Redmond tech campuses.
With limited commercial development and expansive green space, Sammamish offers a peaceful, suburban lifestyle that still provides easy access to employment and recreation. These features, combined with rising household incomes, have helped push home values to some of the highest levels in the state.
7. Mercer Island – 154% Home Price Increase Since 2010

- 2010: $929,987
- 2011: $857,619 (−$72,368, −7.78%)
- 2012: $817,270 (−$40,349, −4.70%)
- 2013: $901,641 (+$84,371, +10.33%)
- 2014: $998,185 (+$96,544, +10.71%)
- 2015: $1,086,106 (+$87,921, +8.81%)
- 2016: $1,220,340 (+$134,234, +12.36%)
- 2017: $1,376,788 (+$156,448, +12.82%)
- 2018: $1,537,790 (+$161,002, +11.70%)
- 2019: $1,530,112 (−$7,678, −0.50%)
- 2020: $1,583,361 (+$53,249, +3.48%)
- 2021: $1,960,616 (+$377,255, +23.82%)
- 2022: $2,530,905 (+$570,289, +29.09%)
- 2023: $2,146,919 (−$383,986, −15.18%)
- 2024: $2,311,279 (+$164,360, +7.66%)
- 2025: $2,366,415 (+$55,136, +2.39%)
Mercer Island’s home prices have grown from $930K in 2010 to over $2.36 million in 2025 — a 154% increase. Much of that growth came after 2020, driven by demand for premium real estate with proximity to both Seattle and Bellevue. Even after a 2023 dip, values have climbed again.
Mercer Island – Exclusive Island Living Between Two Cities
Mercer Island offers one of the most coveted addresses in the state. Located on Lake Washington and connected to both Seattle and Bellevue via I-90, it draws high-income professionals looking for a suburban escape with world-class views and private schools.
The island’s limited housing stock, strict zoning, and consistently high demand keep prices elevated. Access to trails, waterfront parks, and yacht clubs adds to its allure, while proximity to tech centers makes it ideal for executive buyers.
6. Woodway – 141% Home Price Increase Since 2010
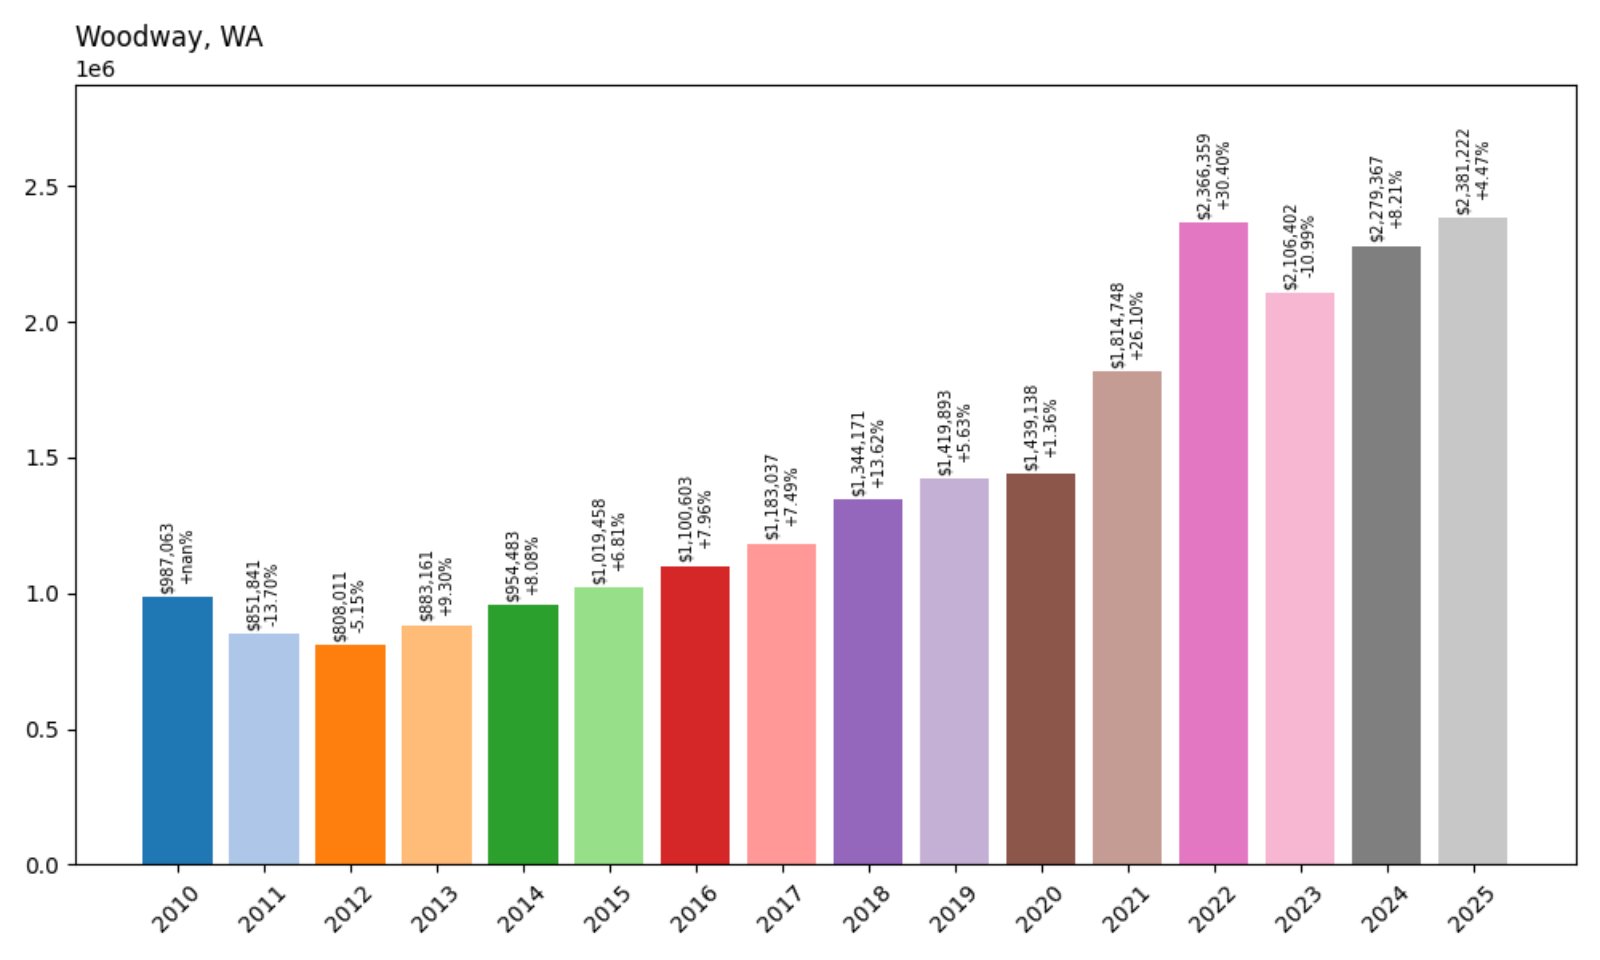
- 2010: $987,063
- 2011: $851,841 (−$135,222, −13.70%)
- 2012: $808,011 (−$43,830, −5.15%)
- 2013: $883,161 (+$75,150, +9.30%)
- 2014: $954,483 (+$71,322, +8.08%)
- 2015: $1,019,458 (+$64,975, +6.81%)
- 2016: $1,100,603 (+$81,145, +7.96%)
- 2017: $1,183,037 (+$82,434, +7.49%)
- 2018: $1,344,171 (+$161,134, +13.62%)
- 2019: $1,419,893 (+$75,722, +5.63%)
- 2020: $1,439,138 (+$19,245, +1.36%)
- 2021: $1,814,748 (+$375,610, +26.10%)
- 2022: $2,366,359 (+$551,611, +30.39%)
- 2023: $2,106,402 (−$259,957, −10.98%)
- 2024: $2,279,367 (+$172,965, +8.21%)
- 2025: $2,381,222 (+$101,855, +4.47%)
Woodway’s prices rose from just under $1 million in 2010 to over $2.38 million in 2025. Demand for large lots and secluded homes pushed prices upward, especially during the 2021–2022 boom. Values rebounded quickly after a modest 2023 drop.
Woodway – Peaceful Affluence on Puget Sound
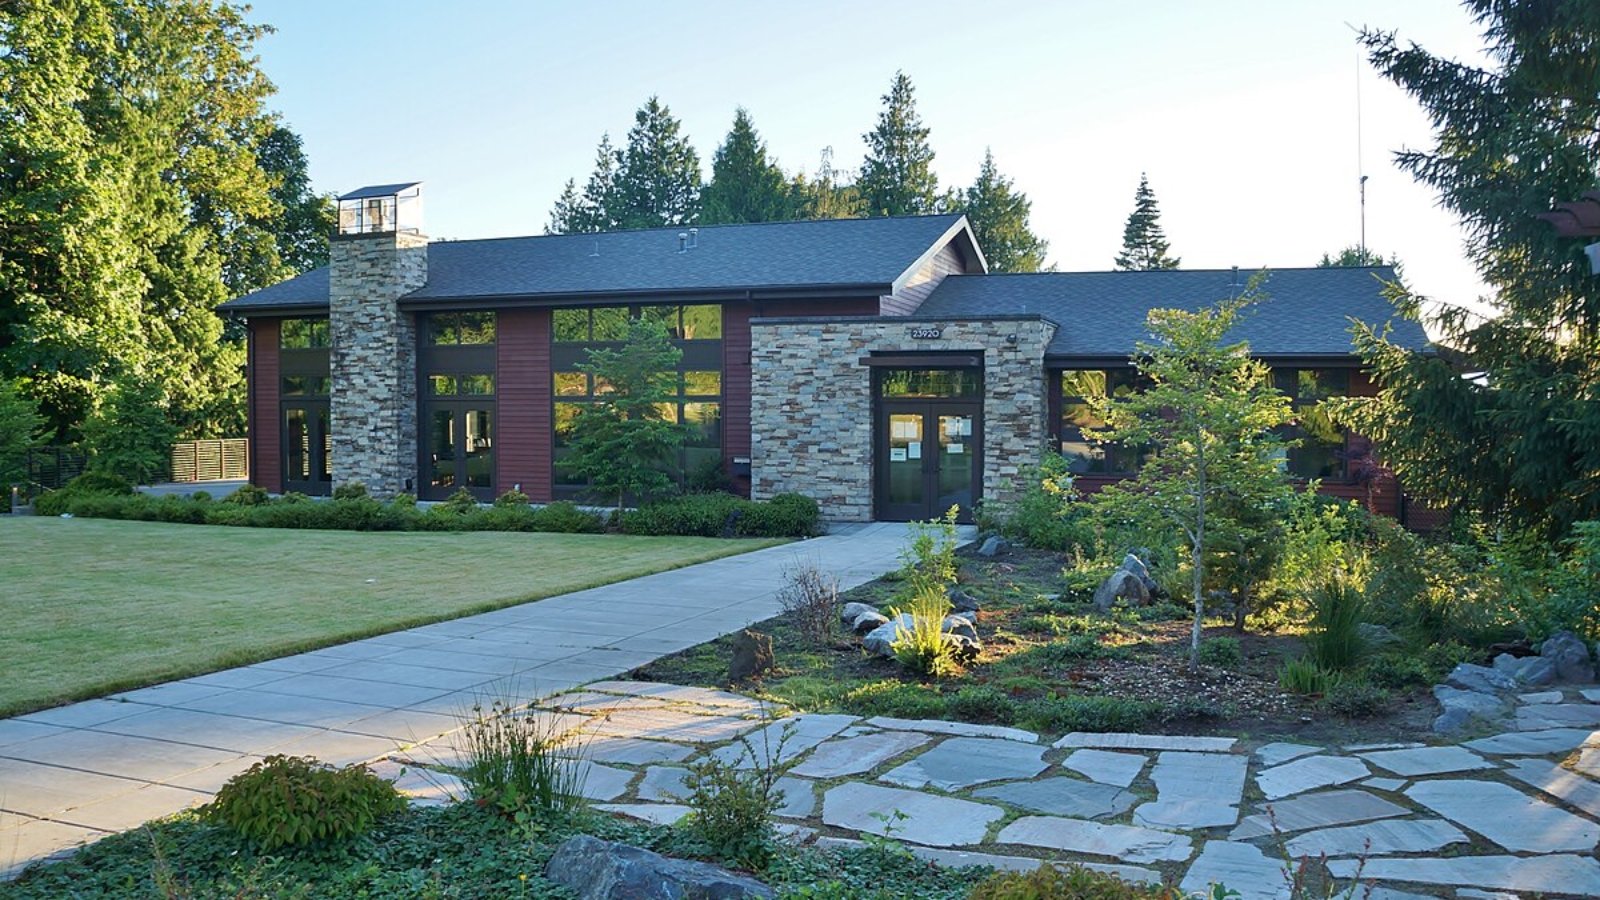
Located south of Edmonds and west of Lynnwood, Woodway is a small residential enclave prized for its wooded lots, privacy, and tranquil setting. With a population under 2,000 and strict development rules, it maintains a low-density, estate-like atmosphere.
Though relatively tucked away, it’s close enough to Seattle and the Eastside to remain highly desirable among luxury buyers. With no commercial centers and minimal traffic, Woodway appeals to those seeking secluded, high-end residential living near Puget Sound.
5. Beaux Arts Village – 171% Home Price Increase Since 2013
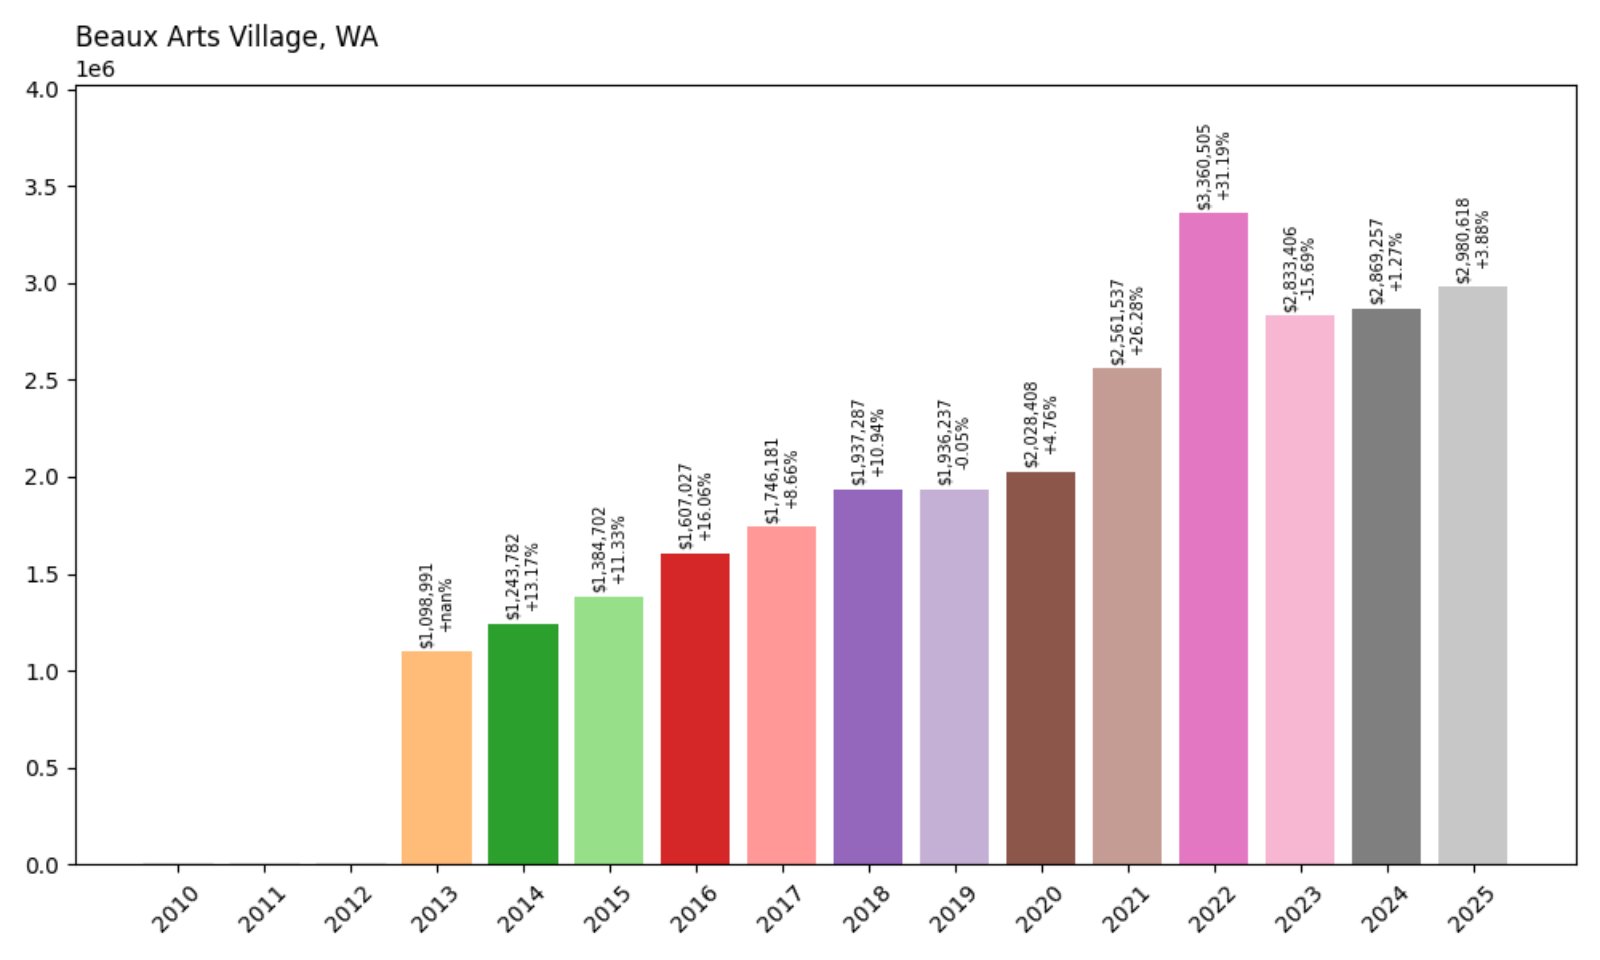
- 2013: $1,098,991
- 2014: $1,243,782 (+$144,791, +13.17%)
- 2015: $1,384,702 (+$140,920, +11.33%)
- 2016: $1,607,027 (+$222,325, +16.05%)
- 2017: $1,746,181 (+$139,154, +8.66%)
- 2018: $1,937,287 (+$191,106, +10.95%)
- 2019: $1,936,237 (−$1,050, −0.05%)
- 2020: $2,028,408 (+$92,171, +4.76%)
- 2021: $2,561,537 (+$533,129, +26.29%)
- 2022: $3,360,505 (+$798,968, +31.19%)
- 2023: $2,833,406 (−$527,099, −15.69%)
- 2024: $2,869,257 (+$35,851, +1.26%)
- 2025: $2,980,618 (+$111,361, +3.88%)
Beaux Arts Village saw a 171% increase in home prices since 2013, jumping from $1.1 million to nearly $3 million. A surge during 2021–2022 drove prices into the ultra-luxury range, with values recovering from a slight correction in 2023.
Beaux Arts Village – Rare Waterfront Community with Historic Roots
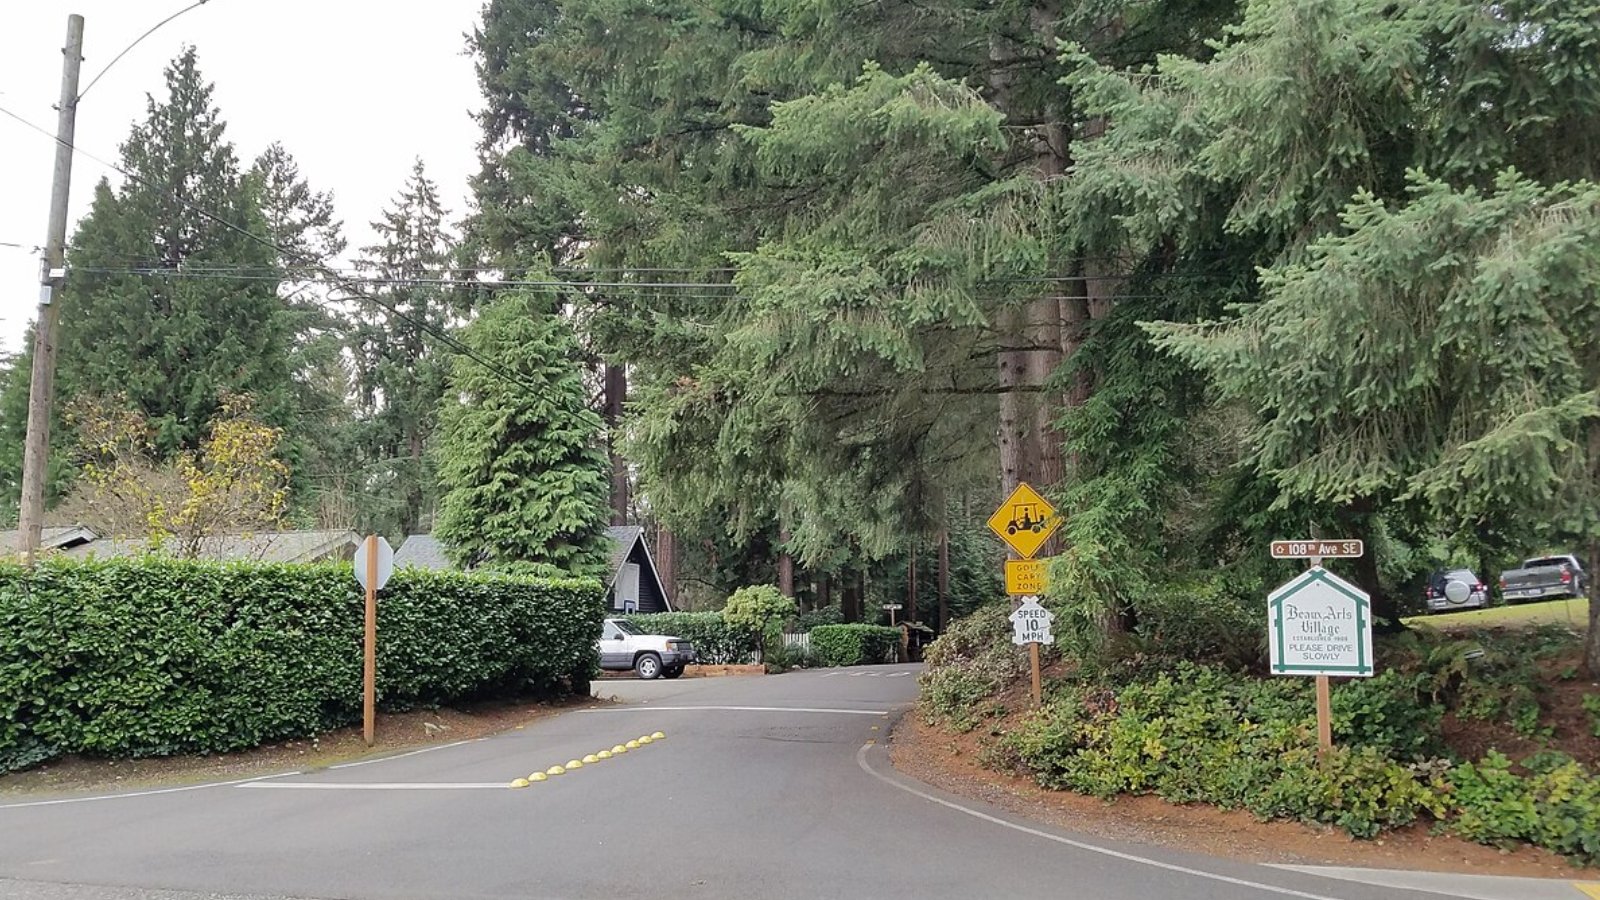
Located just south of Bellevue, Beaux Arts Village is one of Washington’s smallest incorporated towns. With fewer than 300 homes and a tight-knit, historic charm, it offers lake access, private beach rights, and limited public visibility — all of which contribute to sky-high demand.
The area was founded by artists in the early 1900s and retains its unique zoning and cooperative governance. Homes rarely go on the market, and when they do, competition drives values to some of the highest levels in the region.
4. Clyde Hill – 195% Home Price Increase Since 2010

- 2010: $1,442,656
- 2011: $1,319,031 (−$123,625, −8.57%)
- 2012: $1,242,281 (−$76,750, −5.82%)
- 2013: $1,439,182 (+$196,901, +15.85%)
- 2014: $1,737,021 (+$297,839, +20.70%)
- 2015: $1,942,755 (+$205,734, +11.84%)
- 2016: $2,183,049 (+$240,294, +12.37%)
- 2017: $2,388,522 (+$205,473, +9.41%)
- 2018: $2,702,952 (+$314,430, +13.17%)
- 2019: $2,748,144 (+$45,192, +1.67%)
- 2020: $2,791,473 (+$43,329, +1.58%)
- 2021: $3,433,337 (+$641,864, +23.00%)
- 2022: $4,659,007 (+$1,225,670, +35.70%)
- 2023: $3,930,940 (−$728,067, −15.63%)
- 2024: $4,053,463 (+$122,523, +3.12%)
- 2025: $4,266,420 (+$212,957, +5.25%)
Home values in Clyde Hill soared nearly 200% from 2010 to 2025, crossing the $4.2 million mark. Strong gains from 2020 onward reflect its status as one of the most exclusive zip codes on the Eastside.
Clyde Hill – Panoramic Views and Premier Properties
Perched above Bellevue and Medina, Clyde Hill offers some of the best views of Seattle, Lake Washington, and the Olympic Mountains. The town is known for its gated estates, meticulously landscaped lots, and access to elite schools like Bellevue High and Overlake.
With no commercial zoning and strict building codes, it retains a private, residential character. Its prestige, central location, and breathtaking outlooks continue to command top-tier prices.
3. Yarrow Point – 168% Home Price Increase Since 2010

- 2010: $1,661,334
- 2011: $1,516,892 (−$144,442, −8.70%)
- 2012: $1,399,001 (−$117,891, −7.77%)
- 2013: $1,596,214 (+$197,213, +14.09%)
- 2014: $1,921,065 (+$324,851, +20.35%)
- 2015: $2,148,375 (+$227,310, +11.83%)
- 2016: $2,319,836 (+$171,461, +7.98%)
- 2017: $2,548,192 (+$228,356, +9.84%)
- 2018: $2,811,892 (+$263,700, +10.35%)
- 2019: $2,912,354 (+$100,462, +3.57%)
- 2020: $3,015,370 (+$103,016, +3.54%)
- 2021: $3,741,314 (+$725,944, +24.07%)
- 2022: $4,886,206 (+$1,144,892, +30.61%)
- 2023: $4,173,926 (−$712,280, −14.58%)
- 2024: $4,306,276 (+$132,350, +3.17%)
- 2025: $4,458,543 (+$152,267, +3.53%)
Yarrow Point home values have surged by 168% since 2010, rising from $1.66 million to nearly $4.46 million. Major growth occurred between 2020 and 2022, with a dip in 2023 followed by modest gains through 2025. The area remains one of Washington’s most elite addresses.
Yarrow Point – Waterfront Prestige With Tucked-Away Tranquility
Situated on a peninsula jutting into Lake Washington, Yarrow Point combines extraordinary waterfront views with discreet residential exclusivity. The town has fewer than 500 homes and virtually no commercial development, preserving its private, high-end character.
Its central location near Bellevue and Clyde Hill makes it highly desirable for executives in the tech sector. Estate homes with lake access and landscaped grounds dominate the market here, driving premium price points and low inventory. Yarrow Point continues to rank among the most expensive and exclusive places to live in the Pacific Northwest.
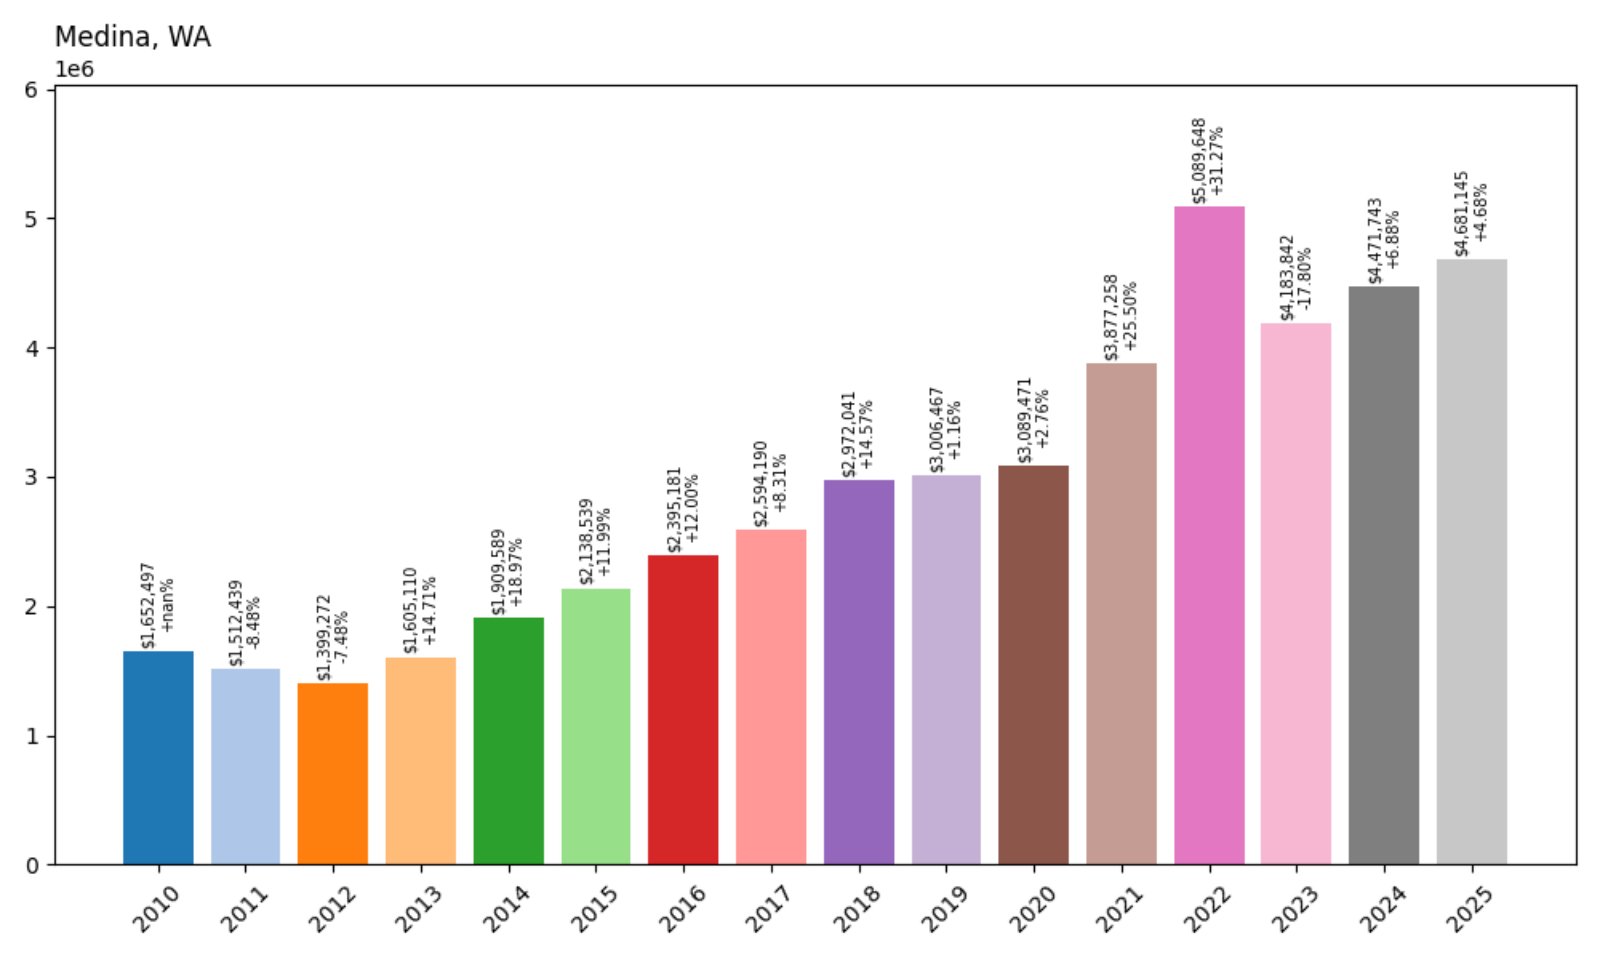
2. Medina – 183% Home Price Increase Since 2010
- 2010: $1,652,497
- 2011: $1,512,439 (−$140,058, −8.48%)
- 2012: $1,399,272 (−$113,167, −7.48%)
- 2013: $1,605,110 (+$205,838, +14.71%)
- 2014: $1,909,589 (+$304,479, +18.96%)
- 2015: $2,138,539 (+$228,950, +11.99%)
- 2016: $2,395,181 (+$256,642, +12.00%)
- 2017: $2,594,190 (+$199,009, +8.31%)
- 2018: $2,972,041 (+$377,851, +14.57%)
- 2019: $3,006,467 (+$34,426, +1.16%)
- 2020: $3,089,471 (+$83,004, +2.76%)
- 2021: $3,877,258 (+$787,787, +25.51%)
- 2022: $5,089,648 (+$1,212,390, +31.26%)
- 2023: $4,183,842 (−$905,806, −17.79%)
- 2024: $4,471,743 (+$287,901, +6.88%)
- 2025: $4,681,145 (+$209,402, +4.68%)
Medina home values have soared from about $1.65 million in 2010 to over $4.68 million in 2025 — a 183% increase. Although 2023 saw a notable correction, prices recovered steadily in 2024 and 2025, keeping Medina firmly among the state’s most elite real estate markets.
Medina – Billionaire Enclave on Lake Washington

Medina is one of the most exclusive residential areas in the Pacific Northwest, and the numbers prove it. With gated estates, massive waterfront properties, and famous residents like Bill Gates, Medina’s prestige is unmatched. The city’s proximity to Bellevue and Seattle makes it especially attractive to tech executives and global elites.
Tight development restrictions, privacy protections, and lush tree-lined streets preserve the area’s upscale character. Whether it’s the unobstructed lake views or ultra-secure neighborhoods, Medina continues to command some of the highest price tags in the state.
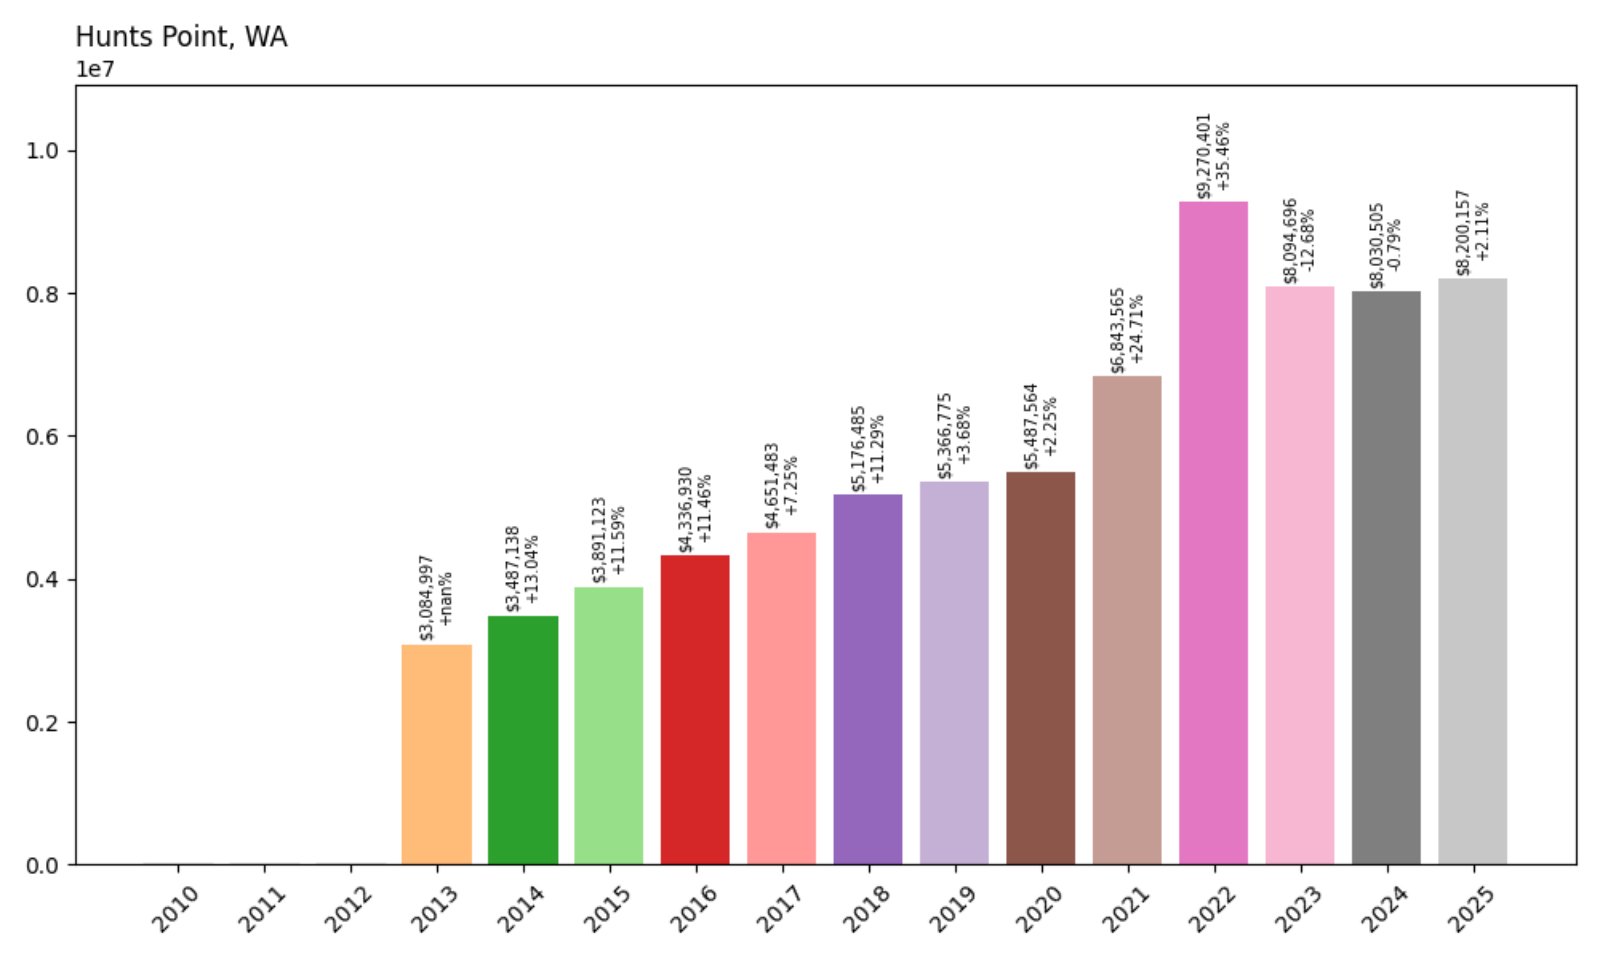
1. Hunts Point – 166% Home Price Increase Since 2013
- 2013: $3,084,997
- 2014: $3,487,138 (+$402,141, +13.03%)
- 2015: $3,891,123 (+$403,985, +11.58%)
- 2016: $4,336,930 (+$445,807, +11.45%)
- 2017: $4,651,483 (+$314,553, +7.25%)
- 2018: $5,176,485 (+$524,999, +11.29%)
- 2019: $5,366,775 (+$190,290, +3.68%)
- 2020: $5,487,564 (+$120,789, +2.25%)
- 2021: $6,843,565 (+$1,356,001, +24.71%)
- 2022: $9,270,401 (+$2,426,836, +35.45%)
- 2023: $8,094,696 (−$1,175,705, −12.68%)
- 2024: $8,030,505 (−$64,191, −0.79%)
- 2025: $8,200,157 (+$169,652, +2.11%)
Hunts Point holds the top spot with a 166% home value increase since 2013. Values exploded between 2020 and 2022, reaching over $9.2 million before a dip. Even with some fluctuation, prices remain well above $8.2 million in 2025 — the highest in Washington state.
Hunts Point – Washington’s Most Expensive Zip Code

With fewer than 500 residents and a peninsula location on Lake Washington, Hunts Point is as exclusive as it gets. The town is comprised almost entirely of sprawling estates with lake frontage, boat docks, and total privacy. It’s an enclave built for CEOs, investors, and tech billionaires.
While nearby Medina also commands attention, Hunts Point edges it out with even larger estates and less public access. The town is connected to the Eastside by a single road, further enhancing its gated, secluded atmosphere. It’s no surprise that Hunts Point has the highest home prices in the state — and it’s not close.