Indiana used to be the Midwest’s steady Eddie—predictable prices, sensible payments, and a market that didn’t whipsaw like the coasts. July 2025 says that era’s wobbling. Inventory across IN metros pushed months of supply past six, pendings slowed, and the market temperature fell off a cliff year over year. The top end (Dune Acres, Zionsville, Carmel) is still flexing, but the median buyer is running headfirst into rates and taxes, and sellers are discovering that “list high and wait” isn’t a strategy. Below is your #30 → #1 countdown with deeper context.
In order to come up with the very specific design ideas, we create most designs with the assistance of state-of-the-art AI interior design software. Also, assume links that take you off the site are affiliate links such as links to Amazon. this means we may earn a commission if you buy something.
30. Your “typical” Indiana town now sits near $231,888
That’s the median ZHVI across 602 towns (July 2025). A decade ago, many towns hovered well under $200K. Crossing $230K shifts the affordability story: starter buyers now need stronger incomes or bigger down payments to clear DTI hurdles.
29. Town prices actually rose ~4.38% YoY
From ~$222,165 (July ’24) → ~$231,888 (July ’25). That’s faster than many households’ inflation-adjusted wage gains. Historically, when prices outrun incomes—even modestly—absorption slows the next year unless rates fall.
28. The town “middle 80%” runs ~$155,608 → ~$341,288

(10th to 90th percentile). That ~2.19× spread inside the core says Indiana isn’t one market; it’s multiple micro-markets stitched together—Chicagoland-adjacent lake towns at one end, struggling rust-belt towns at the other.
27. The cheapest town: Hymera (~$82,870)
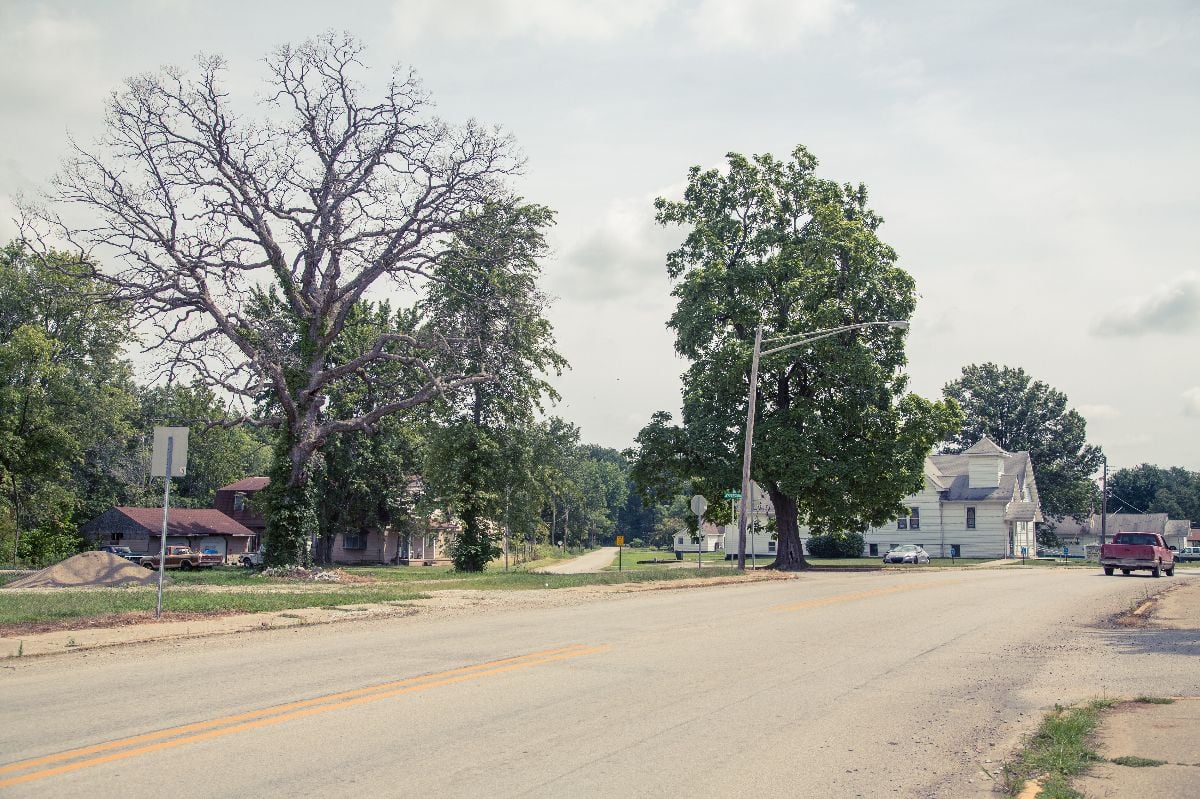
Ultra-low medians look attractive, but the alarm bell is liquidity: in very small towns, time-to-sell stretches and price discovery gets noisy in slowdowns. Your “cheap buy” can become a stranded asset if days-pending keep rising statewide.
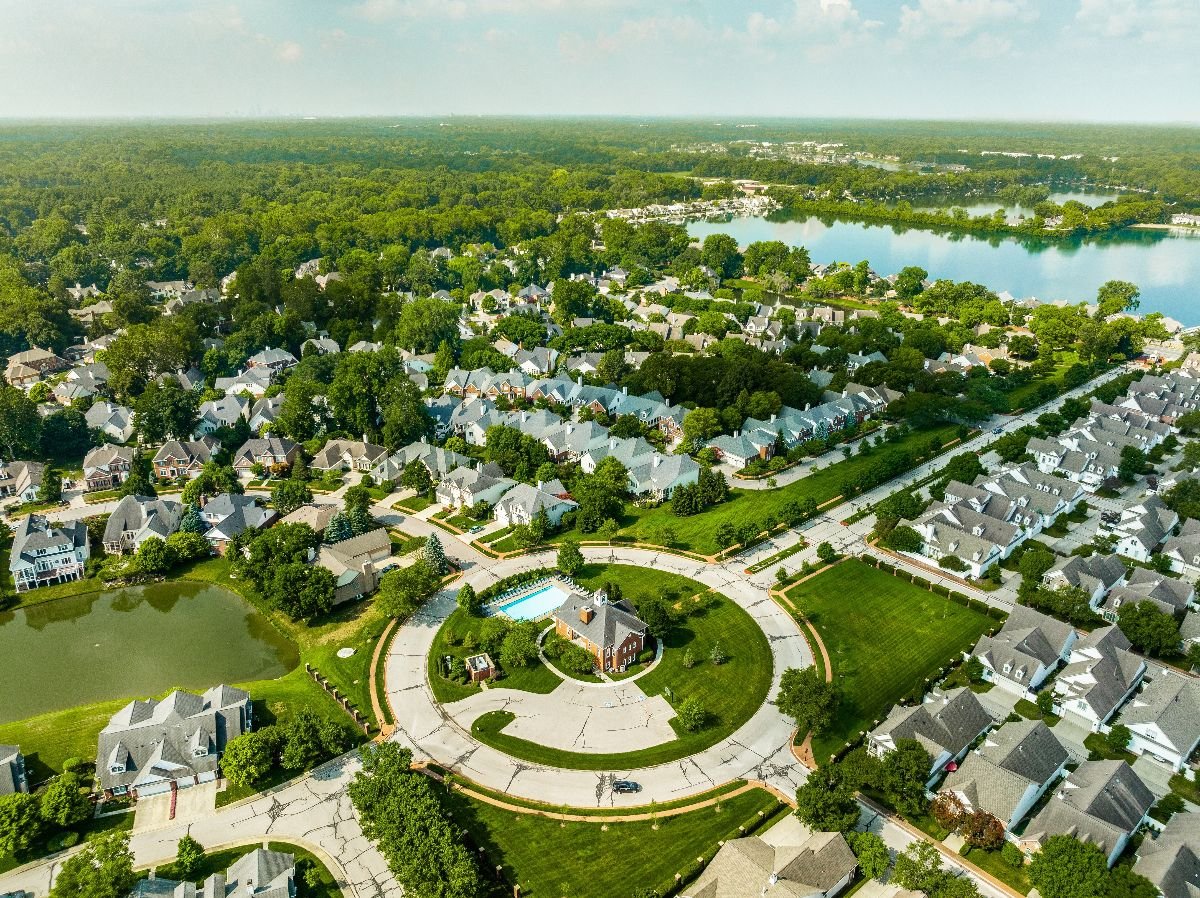
26. The priciest town: Dune Acres (~$889,175)

Lake Michigan prestige towns (Dune Acres, Long Beach) punch way above state medians. Historically, these enclaves are resilient—but they also pull up averages and mask softness in the rest of the state.
25. 62.1% of towns are still under $250K

That screams “affordable,” but here’s the catch: many sub-$250K towns are far from job hubs. In past cycles, when commute-to-value breaks down, these places stagnate first and recover last.
24. Another 35.0% of towns live in $250K–$400K
This is Indiana’s functional middle. With current mortgage rates, even $300K can push monthly payments to the “think twice” zone. Historically, this band drives statewide volume—if it slows, the whole state’s velocity drops.
23. Only ~0.5% of towns top $700K

The ultra-high tier is tiny, but it shapes headlines (Zionsville, Carmel, Westfield). That “tail” can distort market perception—buyers think everything’s exploding when in reality the median buyer is bargaining hard.
22. Neighborhood reality check: 641 neighborhoods, median ≈ $211,768

Neighborhoods (tied to metros) sit below the town median—$211.8K vs. $231.9K—a sign investors and entry buyers concentrate in metro tracts with smaller footprints and more price sensitivity.
21. Neighborhood “middle 80%” spans ~$101,795 → ~$364,044

A ~3.58× spread—in neighborhoods (not towns)—highlights how block-to-block dynamics dominate outcomes in IN cities. Historically, that fragmentation means corrections hit unevenly.
20. Bottom neighborhoods remain sub-$65K–$70K

Examples: Harry Cramer (Marion ~ $52.2K), Cedar Hall (Evansville ~ $53.5K), Midtown (Gary ~ $55.7K). True “cheap” exists—but it pairs with weaker buyer pools and longer pendings when the cycle turns.
19. Top neighborhoods crack $1.5M

Williams Creek (Indianapolis ~ $1.51M) leads, then Meridian Hills (~$731K), Covington Shores (Granger ~ $729K), Sycamore Hills (Fort Wayne ~ $680K). The upper tail is real—but thin—and won’t save median sellers.
18. 45.2% of neighborhoods are still under $200K
🔥 Would you like to save this?
That’s healthy for workforce housing, but the twist is carrying costs: insurance, taxes, and utilities chew more of the payment at the lower end, reducing “effective affordability” versus the headline price.
17. 43.8% of neighborhoods sit in $200K–$350K
This is the first-time buyer battleground. Historically, when this slice hesitates, months of supply jumps statewide within a quarter. Indiana’s MoS just did (see #11).
16. Only ~0.47% of neighborhoods top $700K

Small share, but historically high for Indiana. Luxury’s slice creeping up signals wealth in-migration (around Indy and the lakes) and a widening affordability gap.
15. Statewide metro inventory hit 18,332 listings

That’s the July 2025 sum across IN metros. During the 2021 frenzy, active counts collapsed. Re-inflation of inventory is the first ingredient in price cuts when demand isn’t accelerating.
14. Inventory is up ~19.2% YoY and ~5.8% MoM

Rising both year over year and month over month in peak season says one thing: listings are outpacing absorption. Historically, that’s the early stage of a buyer’s market—especially inland.
13. Sales are basically flat YoY: 2,903 vs. 2,869 (+1.19%)

A rounding-error gain against a near-20% supply surge. That imbalance historically leads to heavier discounting in Q4/Q1 if rates don’t bail the market out.
12. Sales slipped ~0.55% MoM into July

Summer is supposed to lift closings. The fact that sales eased from June while inventory climbed suggests buyers are price-anchoring—and waiting for reductions.
11. Months of supply blew past 6.31 (from 5.36 last July)

Crossing six months is the classic line where leverage tilts toward buyers. If you’re listing now, “test the top” pricing risks going stale and turning into a comp for your neighbor’s price cut.
10. Mean days pending jumped to 29 (from 24 a year ago)

That’s +5 days YoY and +1 day MoM. Not dramatic by itself—but historically, pendings don’t move much in stable markets. Add rising MoS and falling temperature (next points), and you’ve got a clear trend.
9. Market Temperature dropped to 46 (from 55 last year)

A 9-point annual fall is huge. Below 50 means buyers are back in the driver’s seat—more contingencies, more credits, more “can you throw in the appliances?”
8. Temperature fell another 2 points MoM

Even inside peak season, the competitive heat faded. Historically, when July can’t rescue the index, autumn price reductions multiply.
7. Fort Wayne looks quick on pendings—but cooler on heat
Inventory ~1,349; ~25 days pending; TempIdx ~46. Turn times are fast versus the state, but the sub-50 temperature says buyers still hold cards on price and terms.
6. Bloomington looks ice-cold for sellers
🔥 Would you like to save this?
Inventory ~846; ~73 days pending; TempIdx ~21. That’s a slog. University markets usually buffer slowdowns—if they’re this cool, rate sensitivity is biting hard.
5. Muncie and Terre Haute are tepid
Muncie: ~355 inventory, ~29 days pending, TempIdx ~40.
Terre Haute: ~586 inventory, ~39 days pending, TempIdx ~21.
Historically, these aren’t markets where buyers chase—so a statewide cooling shows up here first.
4. Kokomo is slow-warm
~337 inventory, ~27 days pending, TempIdx ~27. Low index + rising supply tends to foreshadow price cuts unless a new demand catalyst appears.
3. The “average” story in Indiana is a mirage

Towns show a $231.9K median, neighborhoods $211.8K, but your outcome is zip-code math. Fragmented markets correct in patches—some zips shed 5–8% while others just stall.
2. The macro setup screams “discount season”

Supply up 19% YoY, months of supply >6, pendings lengthening, temperature −9 YoY / −2 MoM, sales flat. In prior cycles, that cocktail led to widespread list-to-close price trimming.
1. Unless rates drop materially, Indiana’s headed for a buyer-leaning fall

This isn’t a crash call. It’s a leverage call. Sellers who price to 2022 expectations get punished; sellers who price to July 2025 comps and offer concessions still move. Historically, that’s how transitions happen—and Indiana’s in one.
Quick Reference (Indiana, July 2025)
- Towns analyzed: 602
- Town median ZHVI: $231,888 (↑ ~4.38% YoY from ~$222,165)
- Town p10–p90 (ZHVI): $155,608 → $341,288
- Cheapest town: Hymera ~ $82,870
- Most expensive town: Dune Acres ~ $889,175
- Share of towns: < $250K = 62.1% • $250–$400K = 35.0% • > $700K = 0.5%
- Neighborhoods analyzed: 641
- Neighborhood median ZHVI: $211,768
- Neighborhood p10–p90: $101,795 → $364,044
- Low neighborhoods (examples): Harry Cramer (Marion) ~ $52.2K; Cedar Hall (Evansville) ~ $53.5K; Midtown (Gary) ~ $55.7K
- High neighborhoods (examples): Williams Creek (Indianapolis) ~ $1.51M; Meridian Hills (Indianapolis) ~ $731K; Sycamore Hills (Fort Wayne) ~ $680K
- Statewide (metros aggregated):
- Inventory: 18,332 (↑ ~19.2% YoY, ↑ ~5.8% MoM)
- Sales: 2,903 (↑ ~1.19% YoY, −~0.55% MoM)
- Months of supply: ~6.31 (vs ~5.36 last July)
- Mean days pending (sales-weighted): ~29 (↑ +5 YoY, ↑ +1 MoM)
- Market temperature (sales-weighted): ~46 (↓ −9 YoY, ↓ −2 MoM)
- Selected metros (July 2025):
- Fort Wayne: ~1,349 inventory • ~25 days pending • TempIdx ~46
- Bloomington: ~846 inventory • ~73 days pending • TempIdx ~21
- Muncie: ~355 inventory • ~29 days pending • TempIdx ~40
- Terre Haute: ~586 inventory • ~39 days pending • TempIdx ~21
- Kokomo: ~337 inventory • ~27 days pending • TempIdx ~27


