
🔥 Would you like to save this?
The latest Zillow Home Value Index puts these 18 Indiana towns at the top of the market in 2025. While much of the Hoosier State remains budget-friendly, these places are commanding premium prices thanks to strong demand, great locations, and long-term growth.
Some have seen slow-and-steady gains, others big jumps in just a few years—but all 18 are now among Indiana’s most expensive housing markets. If you’re watching where the state’s wealth is showing up in real estate, this list gives a clear, data-backed picture of where prices have officially hit luxe status.
In order to come up with the very specific design ideas, we create most designs with the assistance of state-of-the-art AI interior design software. Also, assume links that take you off the site are affiliate links such as links to Amazon. this means we may earn a commission if you buy something.
18. Topeka – 118% Home Price Increase Since 2010
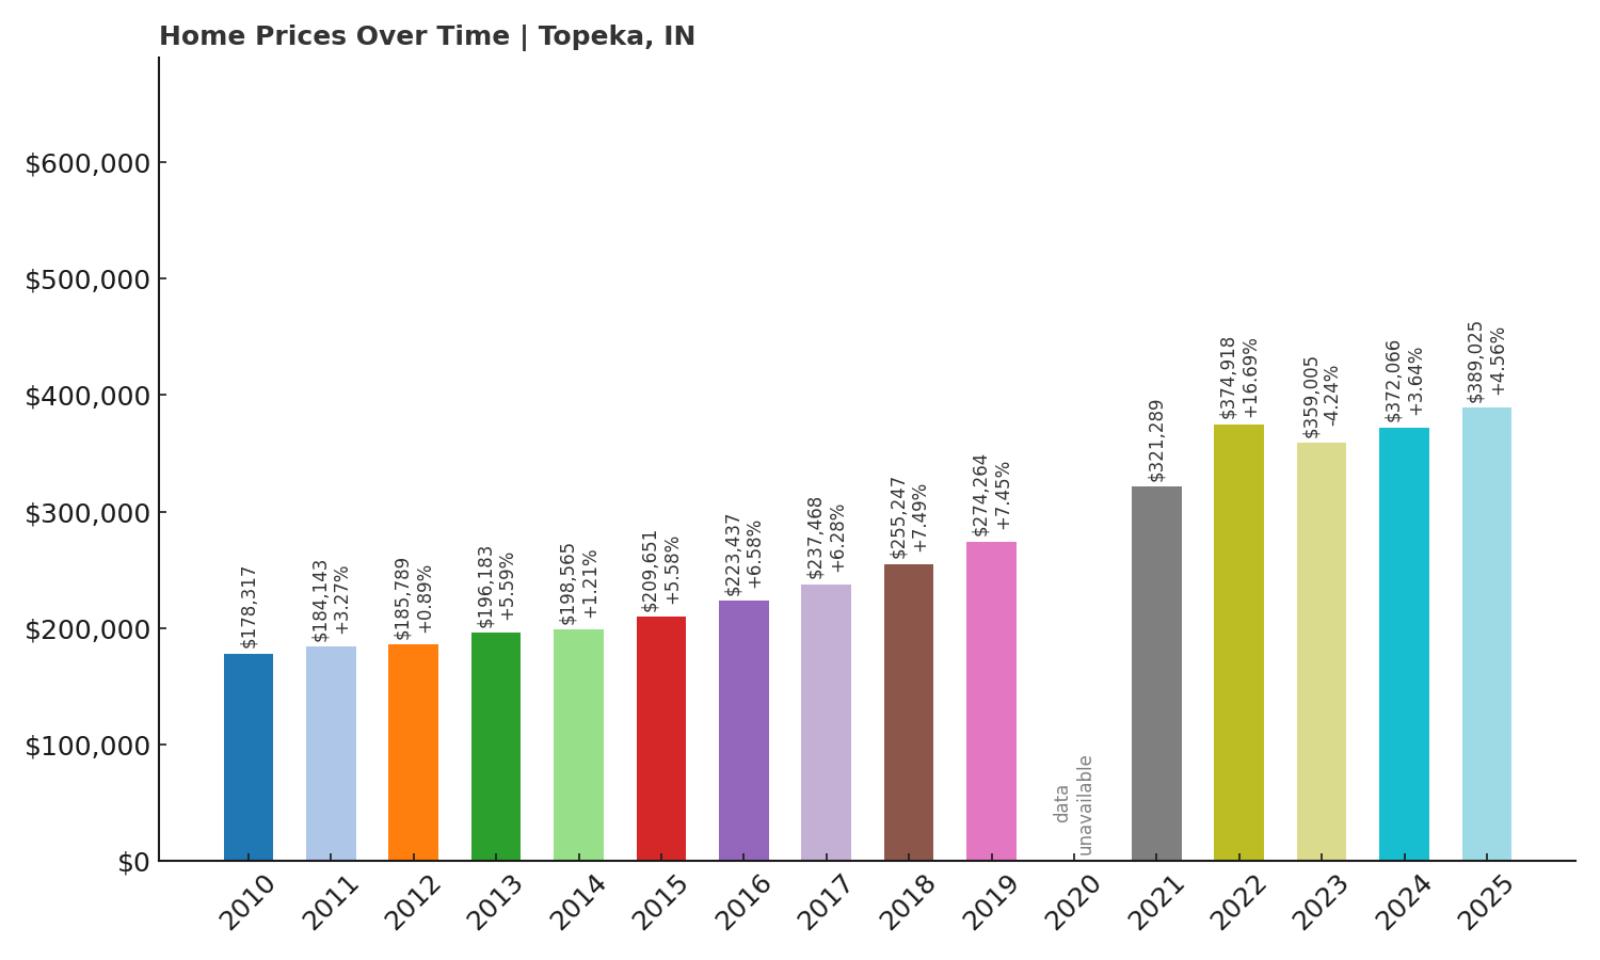
- 2010: $178,317
- 2011: $184,143 (+$5,826, +3.27% from previous year)
- 2012: $185,789 (+$1,646, +0.89% from previous year)
- 2013: $196,183 (+$10,394, +5.59% from previous year)
- 2014: $198,565 (+$2,382, +1.21% from previous year)
- 2015: $209,651 (+$11,086, +5.58% from previous year)
- 2016: $223,437 (+$13,786, +6.58% from previous year)
- 2017: $237,468 (+$14,030, +6.28% from previous year)
- 2018: $255,247 (+$17,780, +7.49% from previous year)
- 2019: $274,264 (+$19,017, +7.45% from previous year)
- 2020: N/A
- 2021: $321,289
- 2022: $374,918 (+$53,629, +16.69% from previous year)
- 2023: $359,005 (-$15,913, -4.24% from previous year)
- 2024: $372,066 (+$13,061, +3.64% from previous year)
- 2025: $389,025 (+$16,959, +4.56% from previous year)
Between 2010 and 2025, Topeka saw home prices jump from $178,317 to $389,025—a 118% increase. Early years showed steady, incremental gains, with especially strong growth starting around 2015. Prices surged in 2022 by over $53,000, indicating a wave of increased demand or market correction. A minor dip in 2023 didn’t hold the market back long, as growth resumed immediately the following year. These fluctuations suggest a resilient housing market that recovers quickly after economic pressures. Topeka’s climb in value over the last 15 years points to a stable and maturing community. With values nearing $400,000, the town has clearly moved into a higher pricing tier. For homeowners, this long-term growth has translated into strong equity gains.
Topeka – Rising Values in a Quiet Corner of Indiana
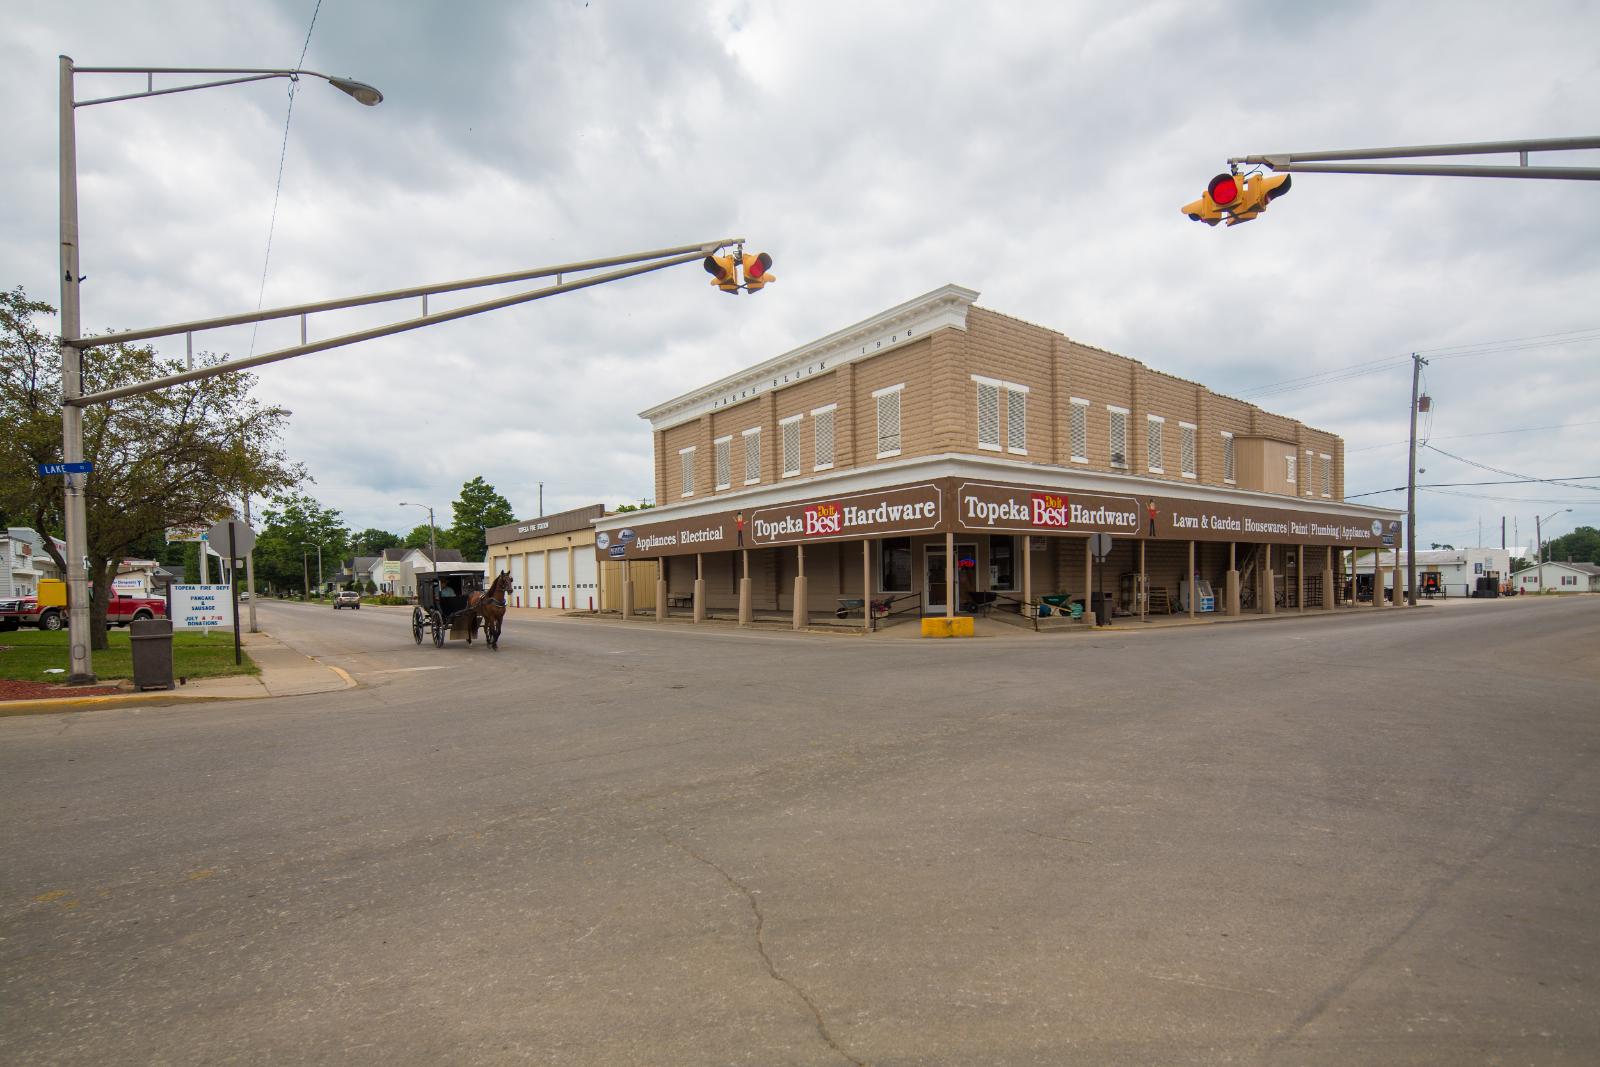
Located in LaGrange County, Topeka is a small, close-knit community surrounded by rural charm. The area is part of Indiana’s Amish heartland, giving it a distinct cultural identity that adds to its uniqueness. While not a major urban hub, Topeka benefits from its peaceful setting and strong sense of tradition. Affordable land, low crime, and community-oriented living have made it increasingly attractive to buyers over the years. The uptick in home prices may also reflect a broader trend of migration to quieter towns with room to grow. In recent years, more people have been willing to pay a premium for serenity and space. Topeka has responded with steady demand and limited new construction, helping push prices upward. The town offers a mix of affordability, charm, and investment potential.
17. Millersburg – 151% Home Price Increase Since 2010
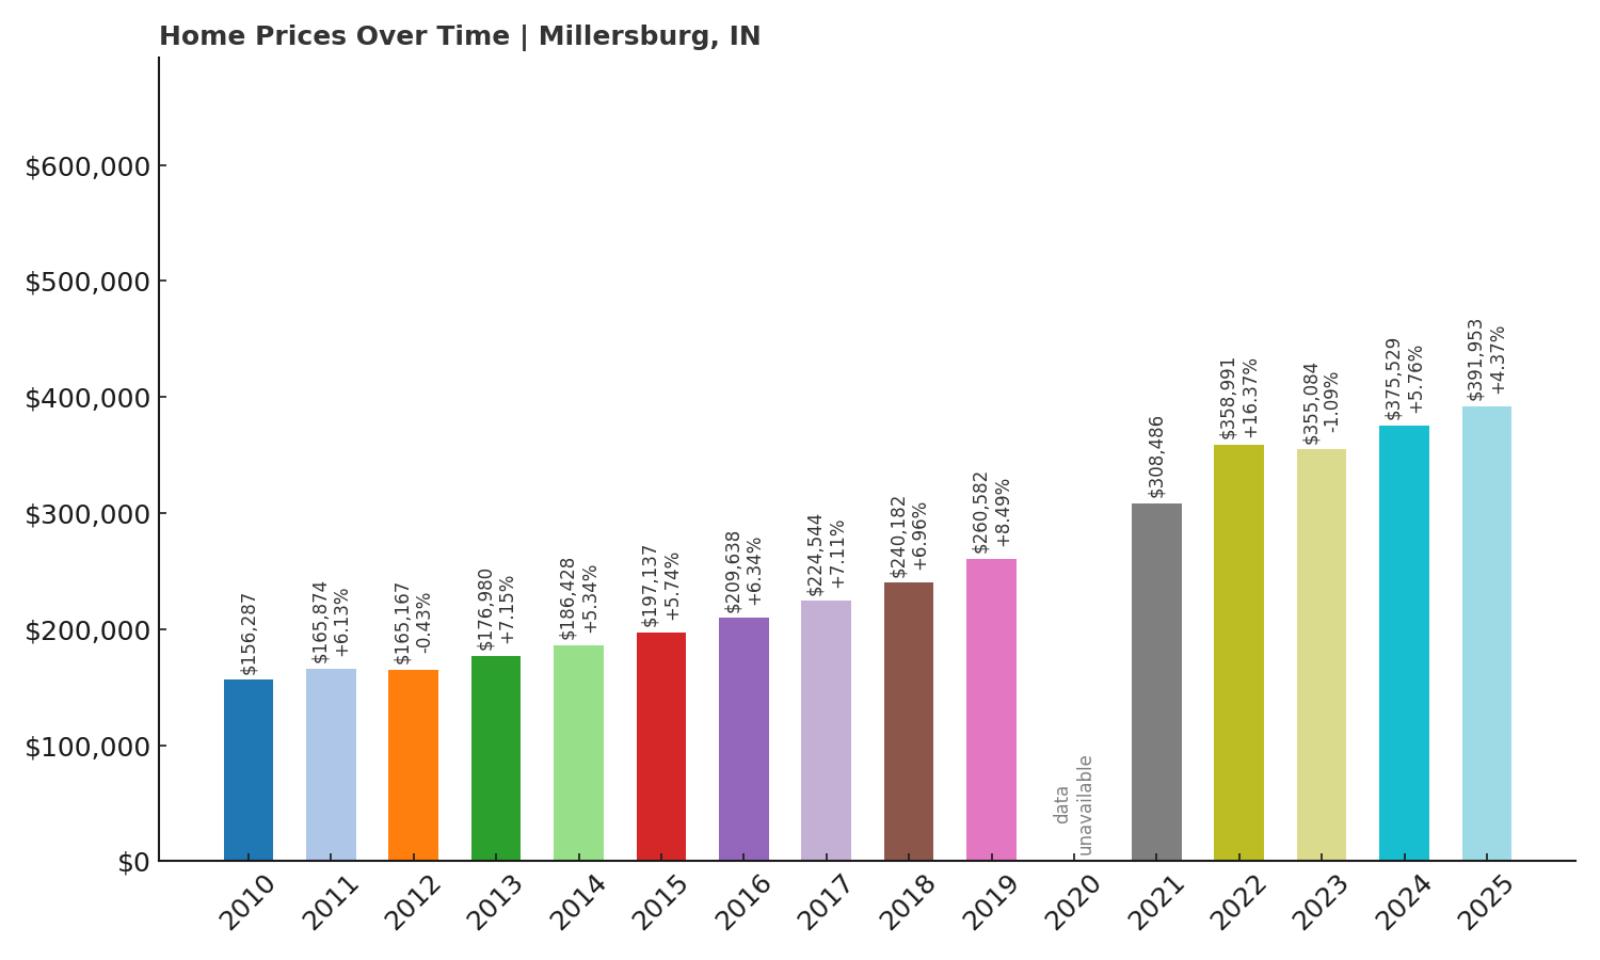
- 2010: $156,287
- 2011: $165,874 (+$9,588, +6.13% from previous year)
- 2012: $165,167 (-$707, -0.43% from previous year)
- 2013: $176,980 (+$11,813, +7.15% from previous year)
- 2014: $186,428 (+$9,448, +5.34% from previous year)
- 2015: $197,137 (+$10,709, +5.74% from previous year)
- 2016: $209,638 (+$12,501, +6.34% from previous year)
- 2017: $224,544 (+$14,907, +7.11% from previous year)
- 2018: $240,182 (+$15,637, +6.96% from previous year)
- 2019: $260,582 (+$20,400, +8.49% from previous year)
- 2020: N/A
- 2021: $308,486
- 2022: $358,991 (+$50,504, +16.37% from previous year)
- 2023: $355,084 (-$3,907, -1.09% from previous year)
- 2024: $375,529 (+$20,445, +5.76% from previous year)
- 2025: $391,953 (+$16,424, +4.37% from previous year)
Millersburg’s home prices increased by a remarkable 151% from 2010 to 2025, rising from $156,287 to $391,953. The growth has been largely steady, with only a few minor dips along the way. The most notable gain came in 2022, with prices soaring over $50,000 in one year. Following that, the market stabilized and continued upward, suggesting lasting demand. This kind of consistent long-term appreciation makes Millersburg one of Indiana’s top performers in value growth. Buyers who invested a decade ago have seen their property values more than double. The numbers also suggest that the area is not just catching up—it’s actively gaining momentum. Overall, Millersburg’s pricing history paints a picture of a steadily maturing real estate market.
Millersburg – A Small Town on the Rise

Millersburg sits in Elkhart County and is known for its quiet streets, local industry, and proximity to the larger city of Goshen. As manufacturing and logistics have flourished in the region, demand for nearby housing has naturally followed. Millersburg offers a lower-density lifestyle while still being within commuting distance of larger job centers. This balance of affordability and access has made it a desirable place to settle for families and working professionals. Over the past decade, its infrastructure and housing stock have seen meaningful updates. Growth has been measured, but clearly effective in raising home values. For buyers seeking a blend of calm living and convenience, Millersburg has become an increasingly popular choice. It’s a town where investment and livability go hand in hand.
16. Floyds Knobs – 90% Home Price Increase Since 2010
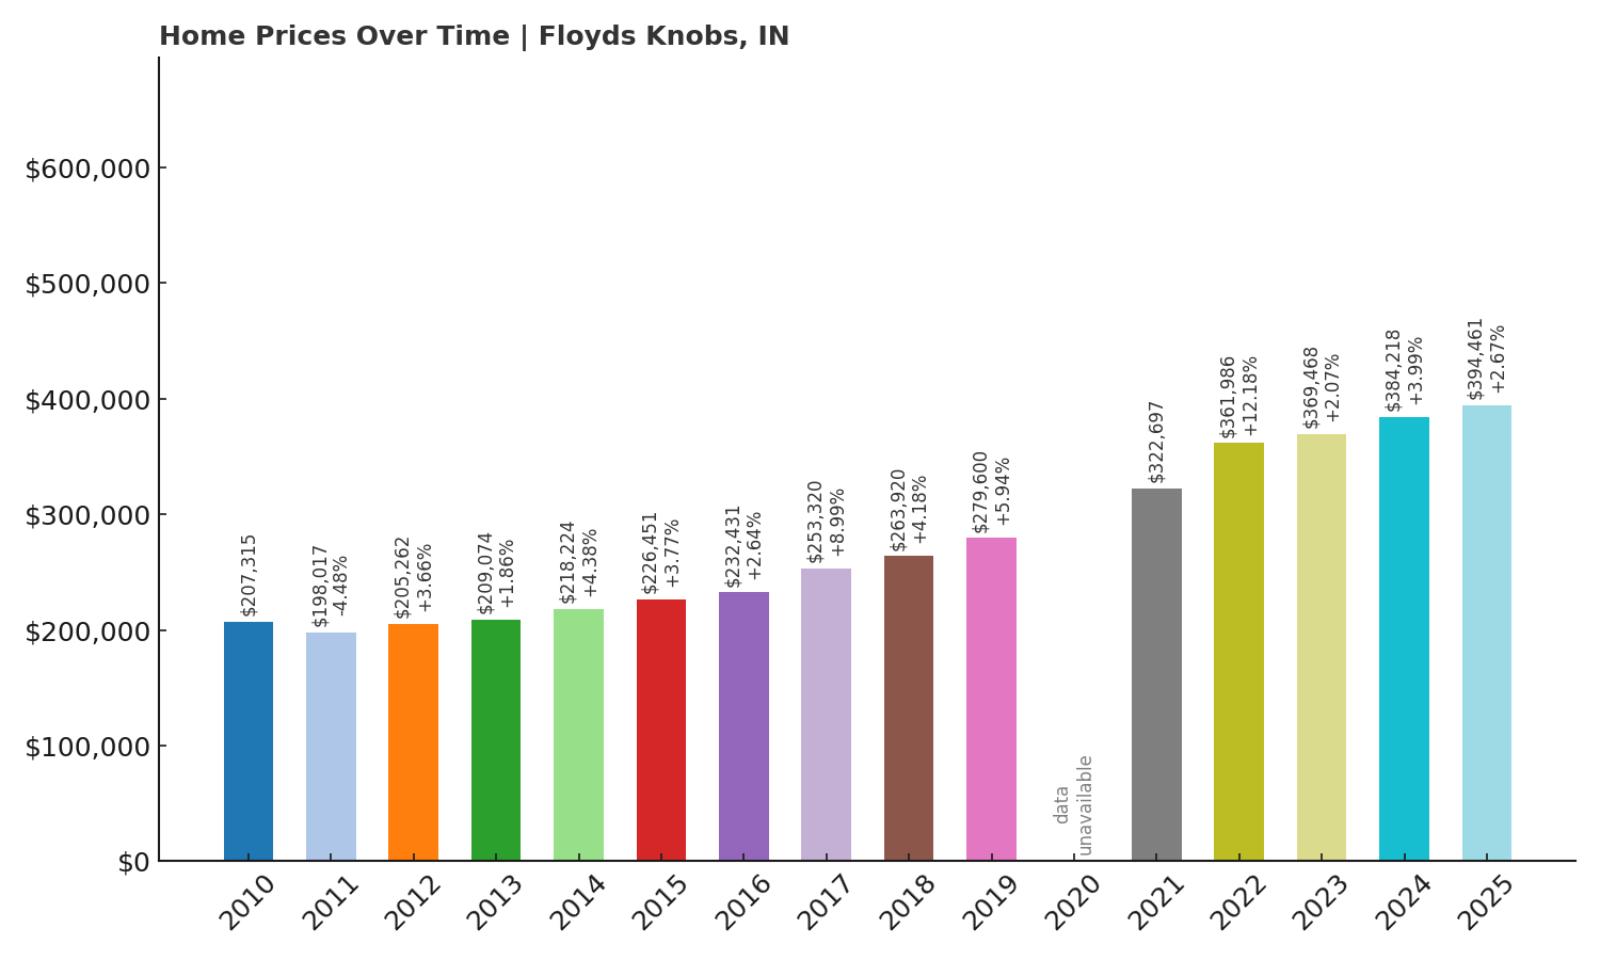
- 2010: $207,315
- 2011: $198,017 (-$9,298, -4.49% from previous year)
- 2012: $205,262 (+$7,245, +3.66% from previous year)
- 2013: $209,074 (+$3,811, +1.86% from previous year)
- 2014: $218,224 (+$9,150, +4.38% from previous year)
- 2015: $226,451 (+$8,227, +3.77% from previous year)
- 2016: $232,431 (+$5,979, +2.64% from previous year)
- 2017: $253,320 (+$20,889, +8.99% from previous year)
- 2018: $263,920 (+$10,600, +4.18% from previous year)
- 2019: $279,600 (+$15,680, +5.94% from previous year)
- 2020: N/A
- 2021: $322,697
- 2022: $361,986 (+$39,289, +12.18% from previous year)
- 2023: $369,468 (+$7,481, +2.07% from previous year)
- 2024: $384,218 (+$14,750, +3.99% from previous year)
- 2025: $394,461 (+$10,243, +2.67% from previous year)
Floyds Knobs has posted a 90% increase in home values since 2010, growing from $207,315 to $394,461 by 2025. While it faced a slight decline in the early years, the market rebounded quickly and began a long-term upward trend. The strongest growth period began in 2017 and accelerated further in 2022. That year alone added nearly $40,000 in value. Recent years show smaller but still positive growth, pointing to a maturing market. Price appreciation has remained consistent despite national market fluctuations. Homeowners in Floyds Knobs have seen their investments grow at a healthy, reliable pace. The town’s pricing history highlights its staying power and strong regional demand.
Floyds Knobs – Suburban Appeal with Strong Fundamentals

Floyds Knobs is a southern Indiana suburb located just outside of New Albany and within commuting distance to Louisville, Kentucky. Its hilltop views, quiet neighborhoods, and access to excellent schools have made it a highly desirable place to live. Over the years, the town has attracted professionals and families seeking a suburban environment with strong community values. The housing market reflects that, with price growth that mirrors regional investment and rising demand. Floyds Knobs has maintained its small-town charm while adapting to changing demographics. The result is a stable market with upward pricing pressure and limited inventory. With continued growth across the greater Louisville area, Floyds Knobs is poised to remain a top-tier Indiana suburb for years to come.
15. Cicero – 125% Home Price Increase Since 2010

- 2010: $175,995
- 2011: $169,785 (-$6,210, -3.53% from previous year)
- 2012: $172,402 (+$2,617, +1.54% from previous year)
- 2013: $174,892 (+$2,490, +1.44% from previous year)
- 2014: $183,833 (+$8,941, +5.11% from previous year)
- 2015: $194,500 (+$10,667, +5.80% from previous year)
- 2016: $207,451 (+$12,950, +6.66% from previous year)
- 2017: $221,614 (+$14,163, +6.83% from previous year)
- 2018: $235,561 (+$13,948, +6.29% from previous year)
- 2019: $249,913 (+$14,352, +6.09% from previous year)
- 2020: N/A
- 2021: $303,876
- 2022: $360,613 (+$56,737, +18.67% from previous year)
- 2023: $373,506 (+$12,893, +3.58% from previous year)
- 2024: $384,344 (+$10,838, +2.90% from previous year)
- 2025: $395,481 (+$11,137, +2.90% from previous year)
Cicero’s home values have soared by 125% over the past 15 years, increasing from $175,995 in 2010 to $395,481 in 2025. After a slight dip in 2011, the town’s housing market has maintained a consistent upward trajectory. The standout year was 2022, with a massive $56,000+ jump, pointing to a significant shift in buyer activity. Growth has remained positive and steady since then. Buyers have clearly recognized Cicero as a strong value, and the data shows that confidence has been rewarded. The town’s home values have more than doubled, putting it firmly in the state’s premium bracket. Cicero’s appeal seems to be built on reliable growth and consistent demand. It remains a stronghold for long-term property value appreciation.
Cicero – Lakeside Living Just North of Indy

Cicero is located on Morse Reservoir, giving it a unique lakeside appeal among Indianapolis suburbs. Water access and recreational amenities have made it a favorite for those looking to enjoy nature without giving up proximity to the city. The town has experienced a quiet boom in recent years, with new developments and infrastructure updates driving up demand. School quality, safety, and charm have all contributed to its rising status. Many buyers view Cicero as a hidden opportunity—one that’s now increasingly in the spotlight. Limited lakefront properties add to the competitive nature of the housing market. As demand continues to rise, Cicero is expected to remain one of the most desirable small towns in central Indiana.
14. Granger – 96% Home Price Increase Since 2010
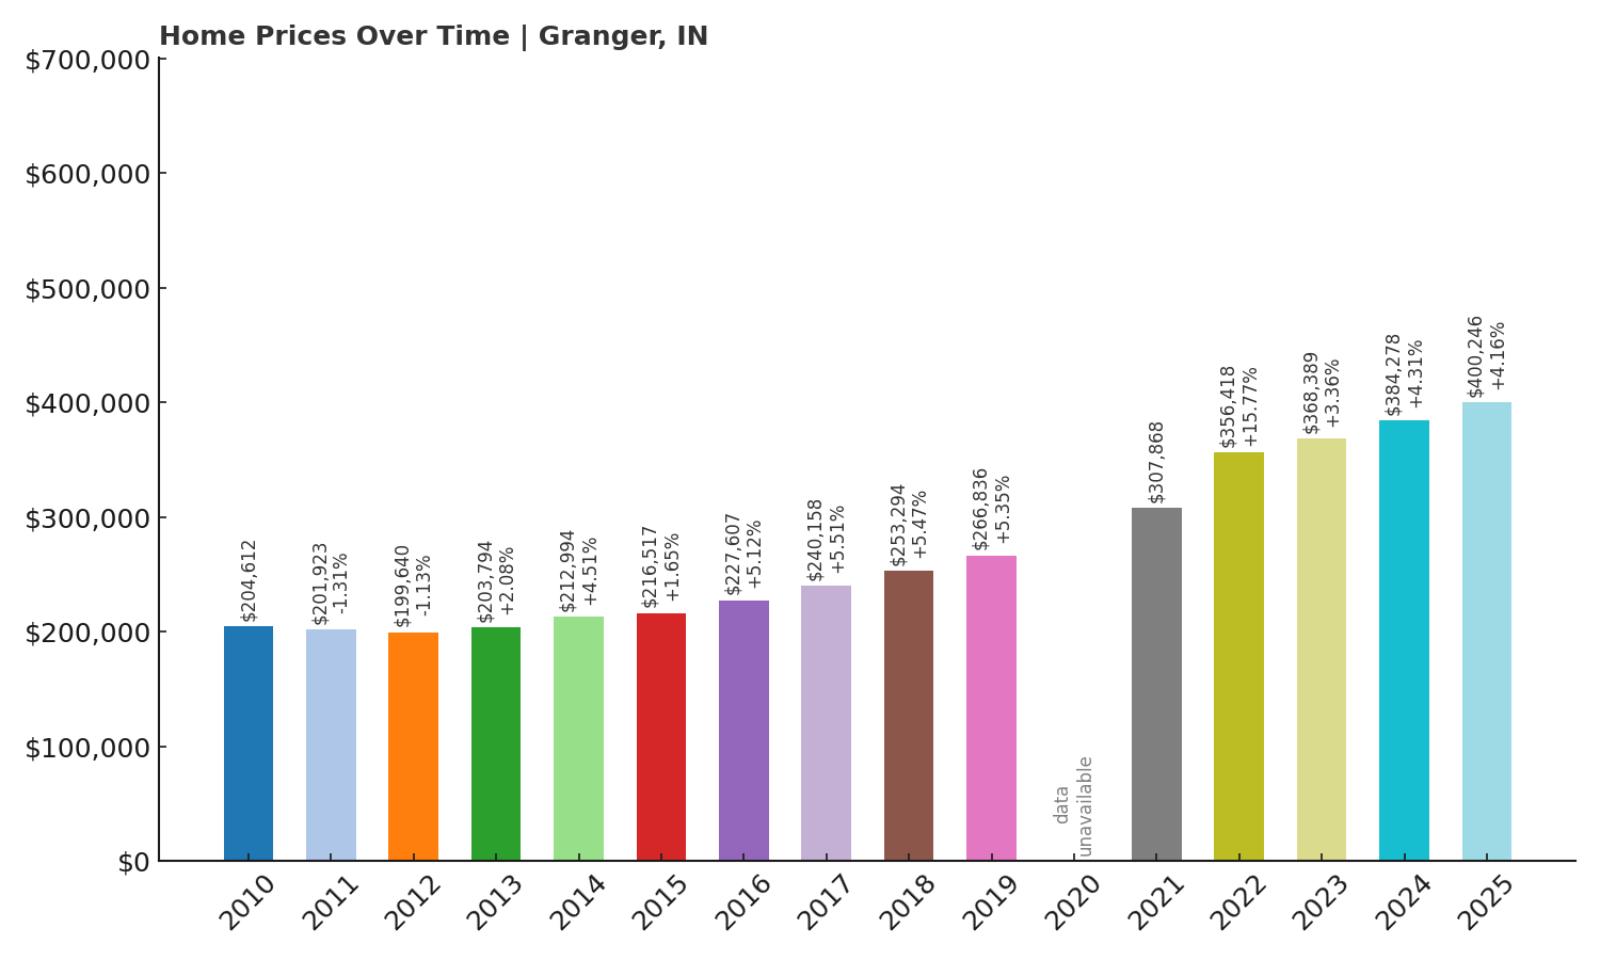
- 2010: $204,612
- 2011: $201,923 (-$2,689, -1.31% from previous year)
- 2012: $199,640 (-$2,283, -1.13% from previous year)
- 2013: $203,794 (+$4,154, +2.08% from previous year)
- 2014: $212,994 (+$9,201, +4.51% from previous year)
- 2015: $216,517 (+$3,523, +1.65% from previous year)
- 2016: $227,607 (+$11,089, +5.12% from previous year)
- 2017: $240,158 (+$12,552, +5.51% from previous year)
- 2018: $253,294 (+$13,135, +5.47% from previous year)
- 2019: $266,836 (+$13,542, +5.35% from previous year)
- 2020: N/A
- 2021: $307,868
- 2022: $356,418 (+$48,549, +15.77% from previous year)
- 2023: $368,389 (+$11,972, +3.36% from previous year)
- 2024: $384,278 (+$15,889, +4.31% from previous year)
- 2025: $400,246 (+$15,968, +4.16% from previous year)
Granger’s home prices have climbed from $204,612 in 2010 to $400,246 in 2025—a 96% increase over 15 years. Though the early 2010s included some minor declines, the market turned around quickly and began a long streak of consistent growth. The strongest spike came in 2022, when prices jumped nearly $50,000 in a single year. Since then, the market has continued to gain ground, with steady increases that reflect both stability and demand. The town’s prices have nearly doubled, signaling long-term confidence from buyers and investors alike. With current values crossing the $400K threshold, Granger has firmly positioned itself among Indiana’s higher-end markets. Its growth story has been gradual but strong, offering both resilience and reward to homeowners. The historical data supports a future of continued appreciation.
Granger – Premium Suburb with Staying Power

Granger lies in northern Indiana near the Michigan border and is part of the South Bend–Mishawaka metro area. It has become a favored choice for professionals, families, and retirees seeking a peaceful yet connected lifestyle. The area is known for large homes, good schools, and proximity to the University of Notre Dame. Its mix of suburban convenience and upscale housing stock makes it a consistent performer in the real estate market. Granger’s appeal has grown as the broader region continues to invest in infrastructure and commercial development. Despite its growth, it retains a quiet, residential feel with high-quality amenities. That balance has helped keep property values rising year after year. For buyers looking north of Indy with long-term stability in mind, Granger is a smart bet.
13. Shadeland – 112% Home Price Increase Since 2010
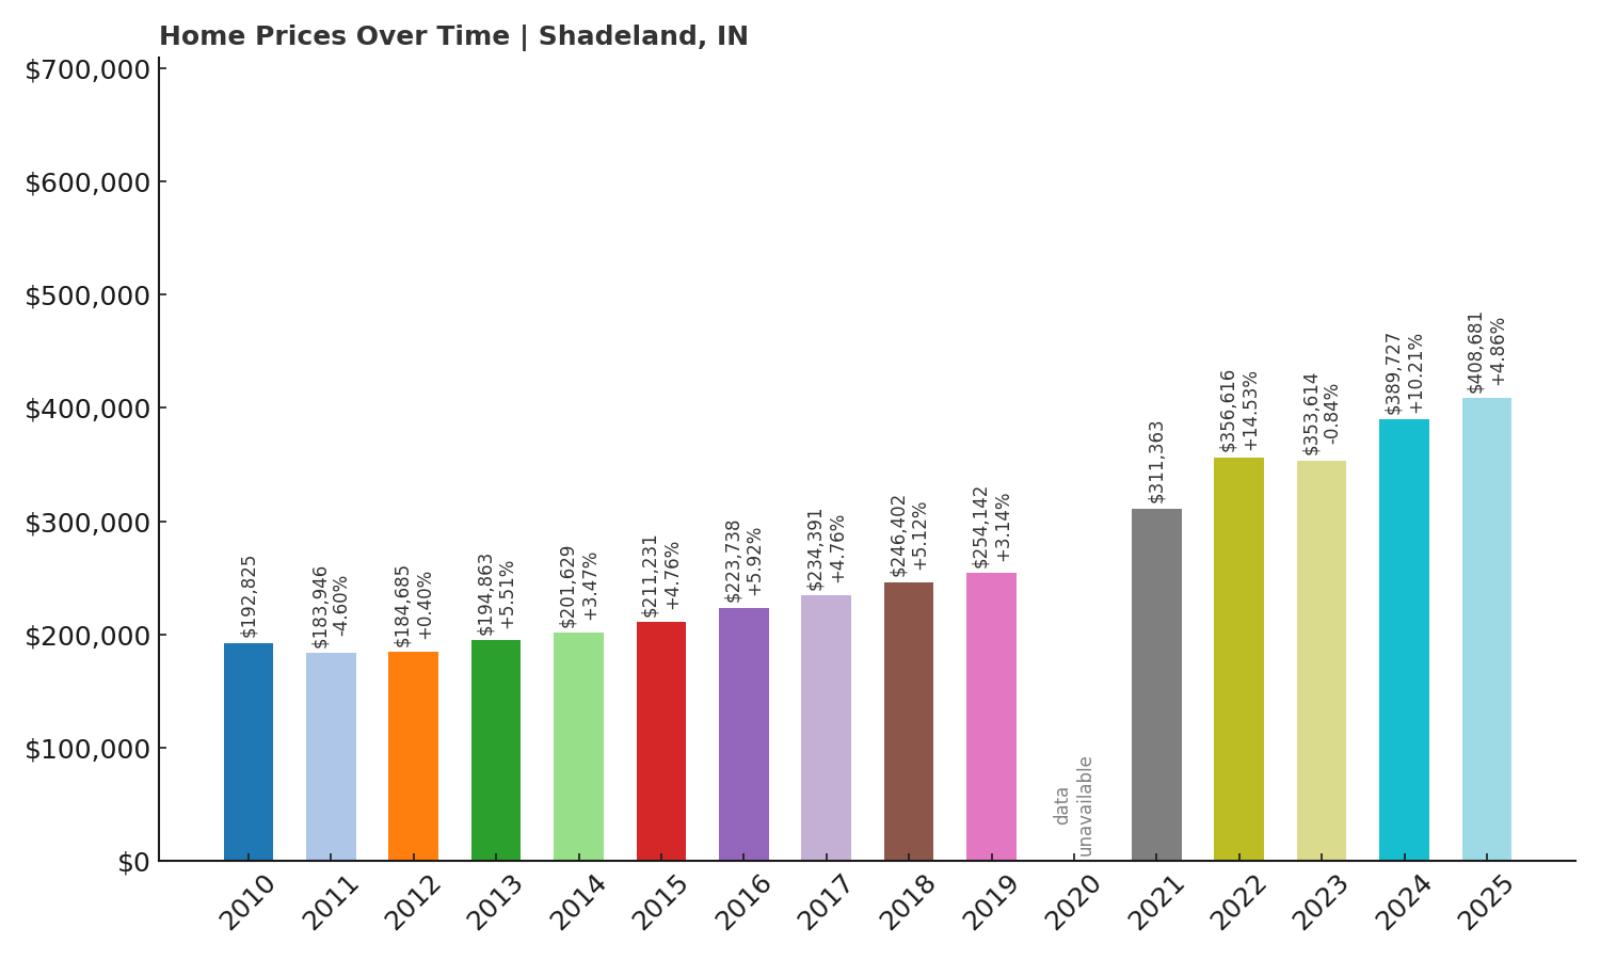
- 2010: $192,825
- 2011: $183,946 (-$8,878, -4.60% from previous year)
- 2012: $184,685 (+$738, +0.40% from previous year)
- 2013: $194,863 (+$10,178, +5.51% from previous year)
- 2014: $201,629 (+$6,766, +3.47% from previous year)
- 2015: $211,231 (+$9,602, +4.76% from previous year)
- 2016: $223,738 (+$12,507, +5.92% from previous year)
- 2017: $234,391 (+$10,653, +4.76% from previous year)
- 2018: $246,402 (+$12,010, +5.12% from previous year)
- 2019: $254,142 (+$7,740, +3.14% from previous year)
- 2020: N/A
- 2021: $311,363
- 2022: $356,616 (+$45,253, +14.53% from previous year)
- 2023: $353,614 (-$3,002, -0.84% from previous year)
- 2024: $389,727 (+$36,113, +10.21% from previous year)
- 2025: $408,681 (+$18,954, +4.86% from previous year)
From 2010 to 2025, home values in Shadeland jumped by 112%, climbing from $192,825 to $408,681. The growth was mostly steady, with minor dips in 2011 and again in 2023. Despite these small setbacks, the market consistently regained momentum and moved upward. The largest single-year gains happened after 2021, showing renewed buyer interest post-pandemic. Price surges in 2022 and 2024 suggest a strong rebound fueled by demand and likely local developments. Over the years, homeowners in Shadeland have seen substantial returns on investment. These trends indicate the town’s appeal isn’t slowing down. With its current median price now solidly above $400,000, Shadeland continues to attract attention in Indiana’s premium housing market.
Shadeland – Solid Growth in a Small Community

Shadeland is a quiet town located just outside Lafayette in Tippecanoe County, offering both seclusion and proximity to urban amenities. Its strong school systems and convenient access to Purdue University have made it appealing to professionals and families alike. While Shadeland has a modest footprint, the demand for housing has clearly grown, especially over the last five years. The data backs this up with sharp increases in median home values starting in 2021. This steady rise could be linked to broader regional economic development and limited housing inventory in the area. The town also benefits from a stable local economy and low crime rates, which contribute to its high desirability. Buyers who purchased before 2016 saw considerable equity gains in under a decade. Today, Shadeland remains one of Indiana’s more exclusive and steadily appreciating communities.
12. Guilford – 122% Home Price Increase Since 2011

🔥 Would you like to save this?
- 2011: $184,293
- 2012: $183,815 (-$477, -0.26% from previous year)
- 2013: $186,602 (+$2,787, +1.52% from previous year)
- 2014: $190,021 (+$3,418, +1.83% from previous year)
- 2015: $199,952 (+$9,931, +5.23% from previous year)
- 2016: $214,244 (+$14,293, +7.15% from previous year)
- 2017: $225,721 (+$11,477, +5.36% from previous year)
- 2018: $233,322 (+$7,601, +3.37% from previous year)
- 2019: $245,803 (+$12,482, +5.35% from previous year)
- 2020: N/A
- 2021: $307,902
- 2022: $349,574 (+$41,673, +13.53% from previous year)
- 2023: $369,119 (+$19,545, +5.59% from previous year)
- 2024: $390,598 (+$21,479, +5.82% from previous year)
- 2025: $409,995 (+$19,397, +4.97% from previous year)
Guilford’s home prices have more than doubled since 2011, rising from $184,293 to $409,995 in 2025—a 122% increase. Despite a minor dip in 2012, the town has posted consistent year-over-year growth with minimal volatility. Strong gains in 2022 and 2024 highlight accelerated interest from buyers, particularly in the post-COVID housing landscape. This sustained upward momentum shows that Guilford’s market remains in high demand. Its growth trajectory points to long-term value appreciation and a competitive market for sellers. The current home value reflects this heightened desirability, solidifying Guilford’s status among Indiana’s most expensive towns. Overall, the pricing data paints a picture of stability and steady growth over more than a decade. For homeowners, it’s been a profitable ride; for buyers, it’s a clear sign of enduring demand.
Guilford – A Rising Star in Southeast Indiana

Located in Dearborn County near the Ohio border, Guilford combines rural charm with strategic location. It’s close to Cincinnati, making it attractive to commuters seeking more space without losing access to city conveniences. The housing stock includes large lots and newer developments, which may be driving its sharp price increases in recent years. Guilford’s relatively low profile compared to other Indiana suburbs has also helped preserve its exclusivity. The price trends suggest increased discovery and migration to the area, especially post-2020. Local schools and community safety further add to the appeal for families. Guilford also benefits from scenic natural surroundings, which likely add premium to property values. This is a town on the rise with housing prices that reflect both demand and long-term confidence.
11. Fishers – 104% Home Price Increase Since 2010
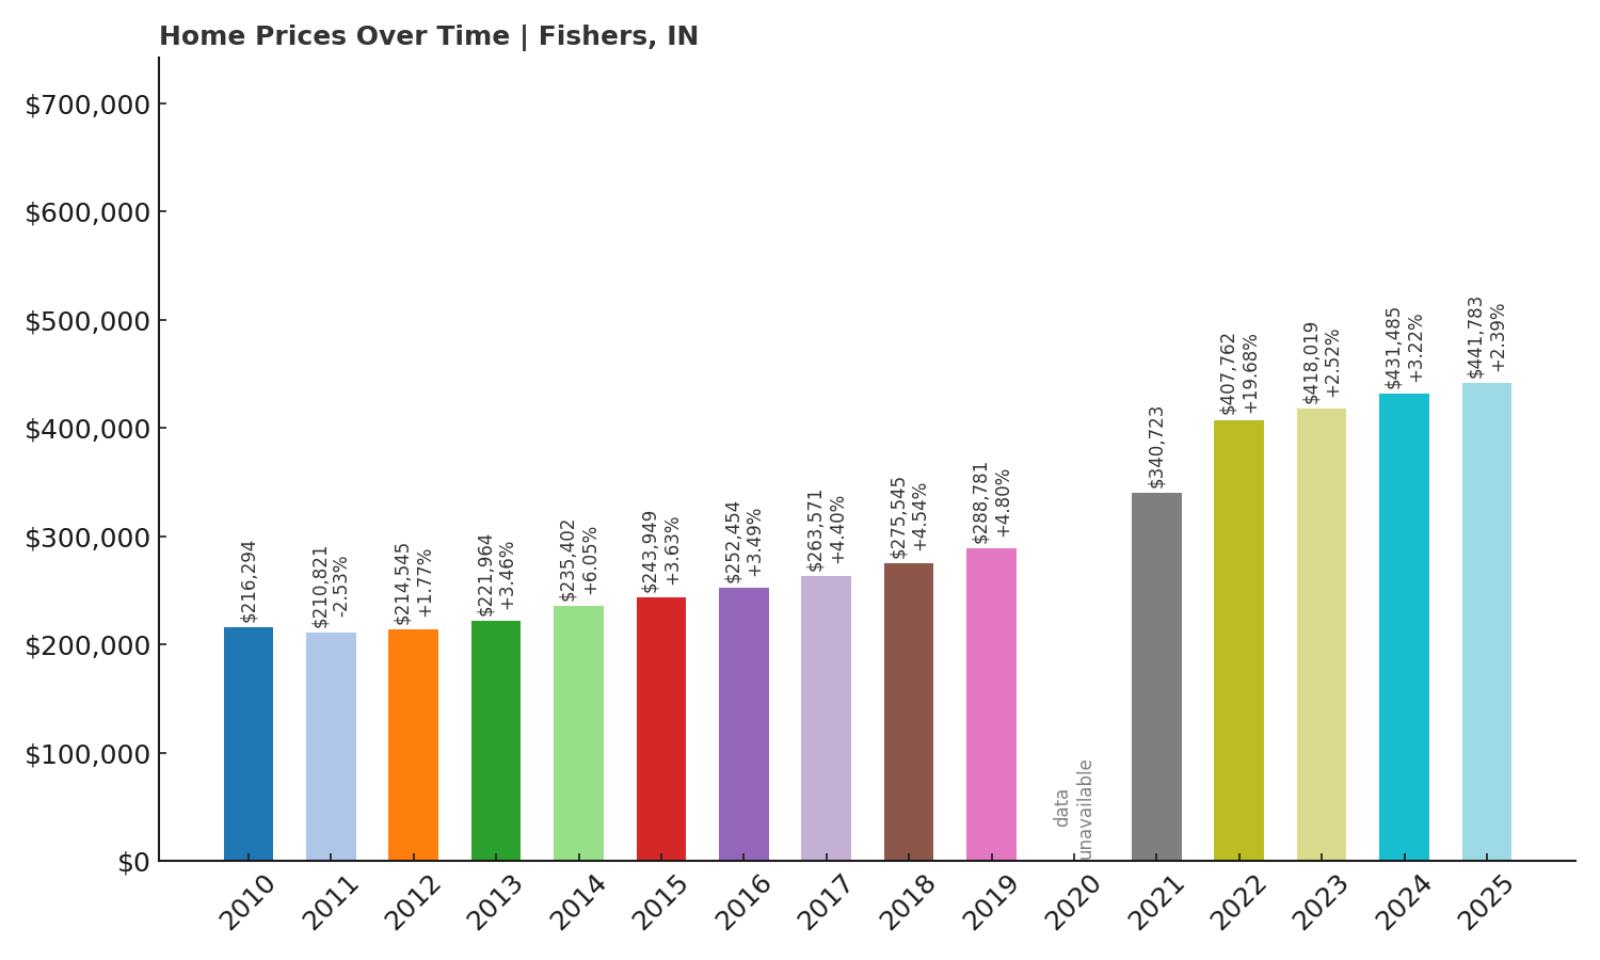
- 2010: $216,294
- 2011: $210,821 (-$5,473, -2.53% from previous year)
- 2012: $214,545 (+$3,724, +1.77% from previous year)
- 2013: $221,964 (+$7,418, +3.46% from previous year)
- 2014: $235,402 (+$13,438, +6.05% from previous year)
- 2015: $243,949 (+$8,548, +3.63% from previous year)
- 2016: $252,454 (+$8,505, +3.49% from previous year)
- 2017: $263,571 (+$11,117, +4.40% from previous year)
- 2018: $275,545 (+$11,974, +4.54% from previous year)
- 2019: $288,781 (+$13,236, +4.80% from previous year)
- 2020: N/A
- 2021: $340,723
- 2022: $407,762 (+$67,039, +19.68% from previous year)
- 2023: $418,019 (+$10,258, +2.52% from previous year)
- 2024: $431,485 (+$13,465, +3.22% from previous year)
- 2025: $441,783 (+$10,298, +2.39% from previous year)
Fishers has seen home values climb from $216,294 in 2010 to $441,783 in 2025—a 104% increase. This upward trajectory was largely consistent, with gains every year except for a small dip in 2011. The largest spike came in 2022, adding over $67,000 in just one year. This jump suggests strong buyer confidence and likely reflects major local developments or improved amenities. Fishers has been a steadily growing suburb, and the numbers reflect its increasing desirability. Despite slowing slightly in 2023–2025, growth remains positive and stable. With current prices pushing toward the mid-$400,000s, Fishers holds its spot as one of Indiana’s high-end communities. Long-term trends point to sustainable appreciation and continued interest from new buyers.
Fishers – A Suburban Powerhouse with Lasting Value

Fishers is a booming suburb located northeast of Indianapolis, and its rise in home prices reflects its growing appeal. Over the last decade, the town has transformed into a dynamic hub with retail, dining, parks, and family-friendly developments. It’s known for top-rated schools and an engaged local government focused on community building. The housing market here benefits from both organic population growth and inward migration. Fishers’ infrastructure investments—like the Nickel Plate Trail and cultural district—add value for residents and attract outside buyers. The town has managed to balance rapid expansion with livability, making it one of the most sought-after places in the state. As demand remains strong and supply tightens, it’s no surprise Fishers continues to command some of the highest home prices in Indiana. For buyers, the price tag comes with proven upside potential.
10. Bargersville – 119% Home Price Increase Since 2010
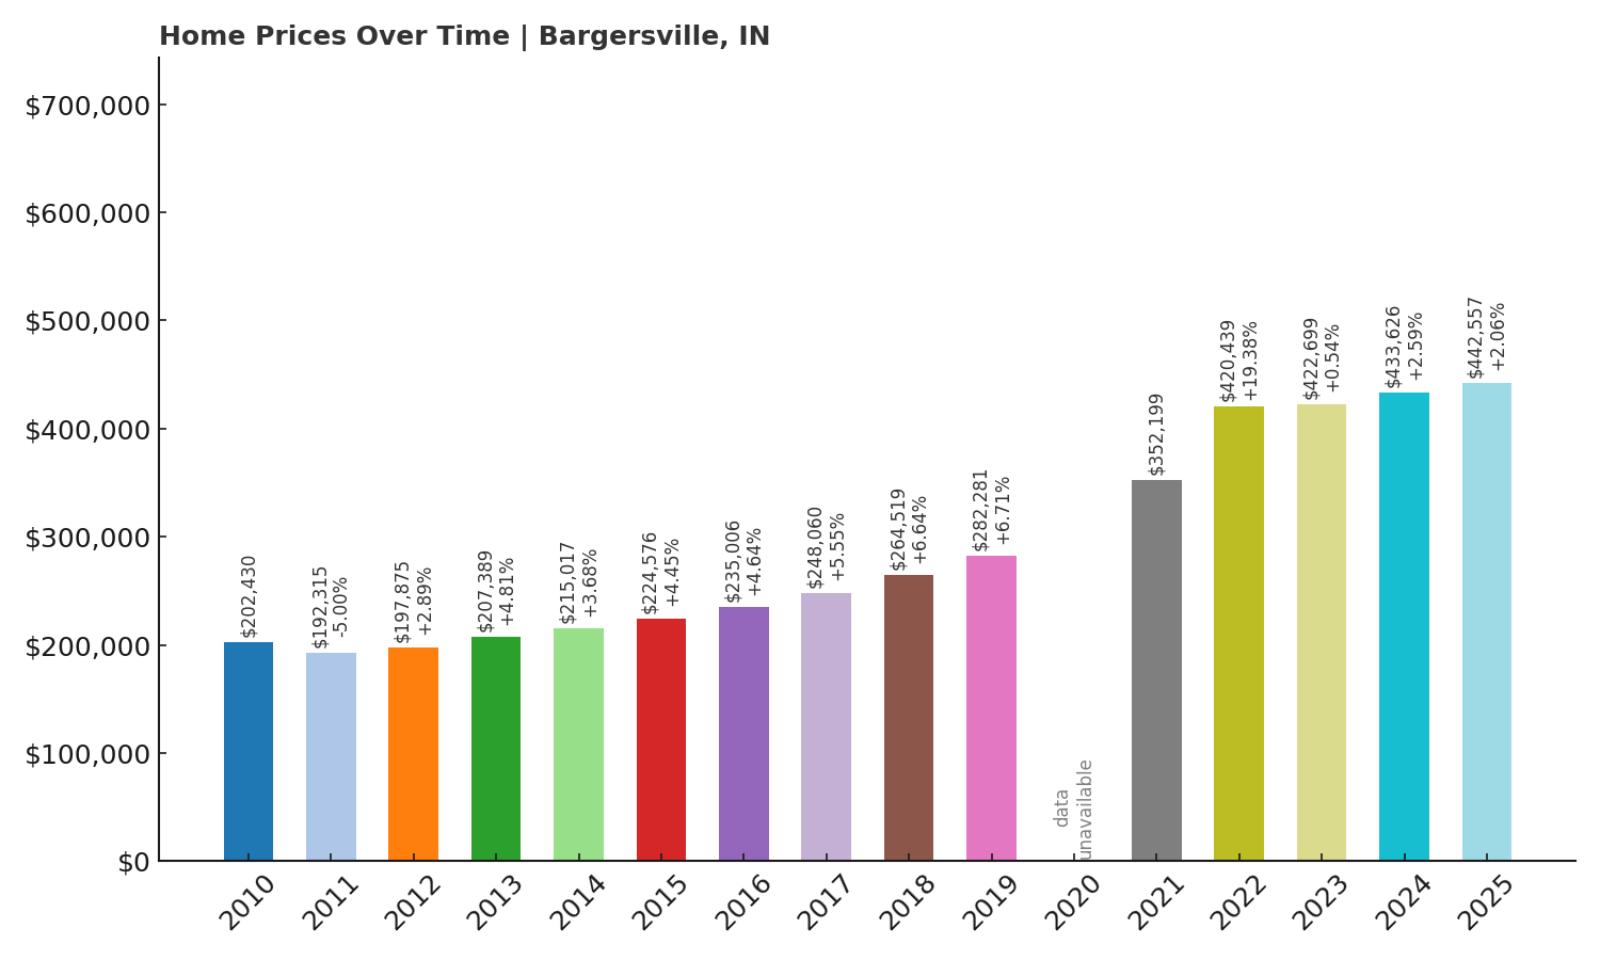
- 2010: $202,430
- 2011: $192,315 (-$10,115, -5.00% from previous year)
- 2012: $197,875 (+$5,561, +2.89% from previous year)
- 2013: $207,389 (+$9,513, +4.81% from previous year)
- 2014: $215,017 (+$7,628, +3.68% from previous year)
- 2015: $224,576 (+$9,559, +4.45% from previous year)
- 2016: $235,006 (+$10,430, +4.64% from previous year)
- 2017: $248,060 (+$13,054, +5.55% from previous year)
- 2018: $264,519 (+$16,459, +6.64% from previous year)
- 2019: $282,281 (+$17,761, +6.71% from previous year)
- 2020: N/A
- 2021: $352,199
- 2022: $420,439 (+$68,241, +19.38% from previous year)
- 2023: $422,699 (+$2,260, +0.54% from previous year)
- 2024: $433,626 (+$10,926, +2.58% from previous year)
- 2025: $442,557 (+$8,931, +2.06% from previous year)
Between 2010 and 2025, home prices in Bargersville rose from $202,430 to $442,557—an impressive 119% increase. The town experienced a small dip in 2011, but growth resumed quickly and never really slowed down. Prices rose steadily through the 2010s, and then surged again post-2020. The most significant gain came in 2022, when values jumped by more than $68,000 in a single year. This spike suggests a period of intense demand, likely linked to increased development or a boost in regional desirability. Since then, the market has remained strong, with modest but positive annual growth. The current value reflects consistent appreciation and growing interest from buyers across Indiana. Bargersville clearly holds its own among the state’s most expensive towns.
Bargersville – Booming Growth in Johnson County

Bargersville is located just south of Indianapolis in Johnson County, and it’s become one of the area’s fastest-growing communities. The town has transformed from a quiet rural hub into a thriving suburb with new housing developments, restaurants, and infrastructure upgrades. Families are drawn here for its well-rated schools and ample space, while developers continue to invest in high-quality neighborhoods. Bargersville’s rapid home price growth reflects these trends, especially in the last five years. With newer homes dominating the market, it’s no surprise that median values have climbed so sharply. Its location offers convenient access to the city without sacrificing small-town appeal. Overall, Bargersville’s housing market is being fueled by both organic demand and continued expansion, putting it firmly on the map for affluent buyers.
9. Saint John – 76% Home Price Increase Since 2010
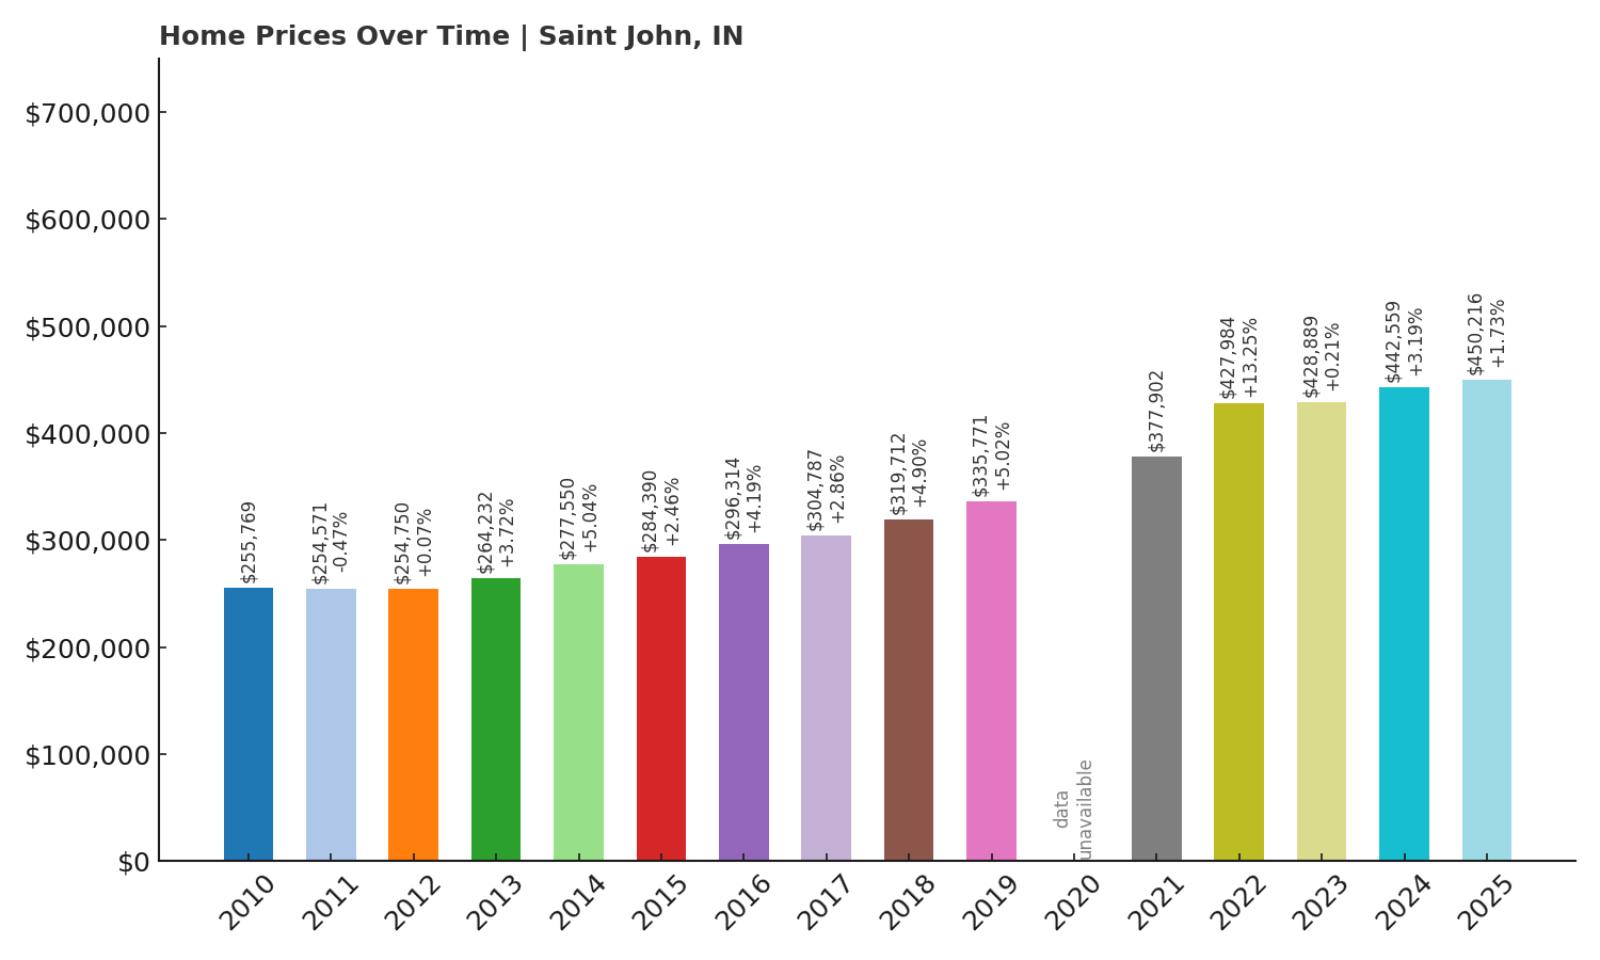
- 2010: $255,769
- 2011: $254,571 (-$1,198, -0.47% from previous year)
- 2012: $254,750 (+$179, +0.07% from previous year)
- 2013: $264,232 (+$9,482, +3.72% from previous year)
- 2014: $277,550 (+$13,318, +5.04% from previous year)
- 2015: $284,390 (+$6,840, +2.46% from previous year)
- 2016: $296,314 (+$11,925, +4.19% from previous year)
- 2017: $304,787 (+$8,473, +2.86% from previous year)
- 2018: $319,712 (+$14,925, +4.90% from previous year)
- 2019: $335,771 (+$16,059, +5.02% from previous year)
- 2020: N/A
- 2021: $377,902
- 2022: $427,984 (+$50,082, +13.25% from previous year)
- 2023: $428,889 (+$905, +0.21% from previous year)
- 2024: $442,559 (+$13,670, +3.19% from previous year)
- 2025: $450,216 (+$7,657, +1.73% from previous year)
Since 2010, Saint John has seen a 76% increase in home prices, moving from $255,769 to $450,216 by 2025. Early years saw slow but steady gains, with a noticeable boost beginning in 2013. The biggest leap occurred in 2022, when values jumped by over $50,000. While price growth has slowed since then, the town continues to appreciate year after year. Saint John’s housing market has remained resilient even during national cooling trends. The market’s long-term strength suggests deep buyer interest and strong community infrastructure. With median prices approaching the $450K mark, the town is now firmly in Indiana’s high-value tier. Homeowners have seen significant returns over the last decade and a half, and prospects still look strong moving forward.
Saint John – A Steady Climber in Northwest Indiana

Saint John is located in Lake County, part of the Chicago metropolitan area, and is known for its well-kept neighborhoods and high quality of life. The town regularly ranks among Indiana’s best places to live thanks to its schools, parks, and safety ratings. Its proximity to Illinois makes it a popular choice for commuters who want suburban living without crossing state lines. Saint John’s appeal is reflected in its property values, which have steadily increased with minimal volatility. Newer subdivisions and upscale homes have helped raise the town’s profile and pricing power. Buyers are willing to pay a premium for space, amenities, and location—three things Saint John delivers consistently. It’s one of the few Indiana towns that blends suburban tranquility with metro access, and that combination continues to push prices upward.
8. Westfield – 107% Home Price Increase Since 2010
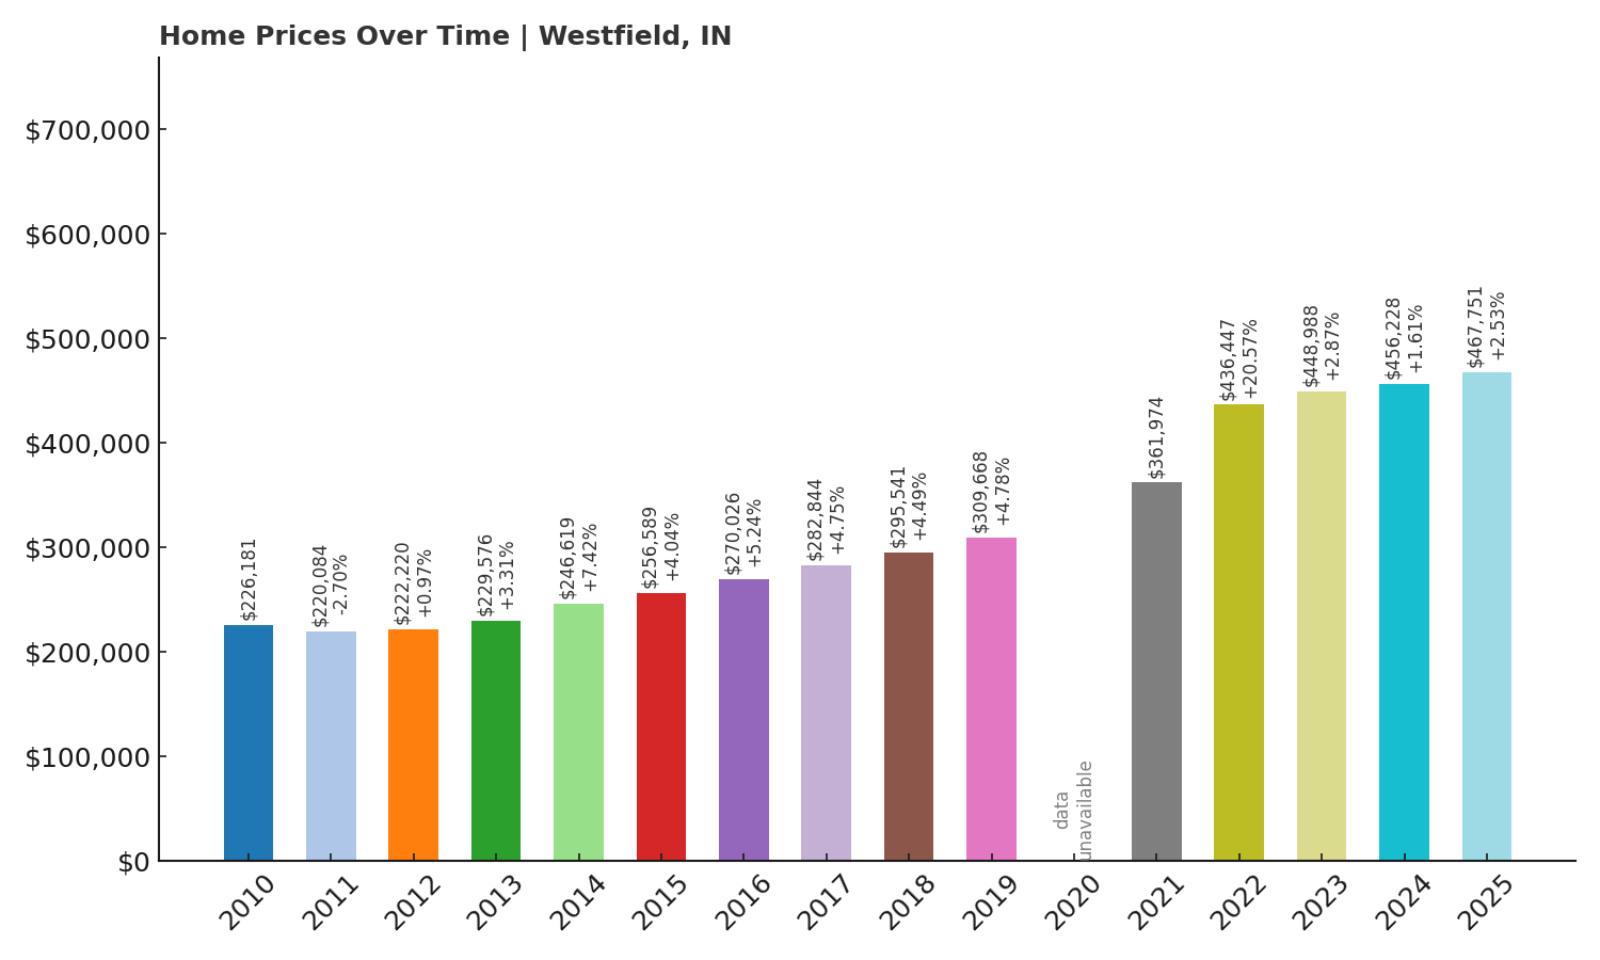
- 2010: $226,181
- 2011: $220,084 (-$6,097, -2.70% from previous year)
- 2012: $222,220 (+$2,137, +0.97% from previous year)
- 2013: $229,576 (+$7,356, +3.31% from previous year)
- 2014: $246,619 (+$17,042, +7.42% from previous year)
- 2015: $256,589 (+$9,970, +4.04% from previous year)
- 2016: $270,026 (+$13,437, +5.24% from previous year)
- 2017: $282,844 (+$12,819, +4.75% from previous year)
- 2018: $295,541 (+$12,697, +4.49% from previous year)
- 2019: $309,668 (+$14,127, +4.78% from previous year)
- 2020: N/A
- 2021: $361,974
- 2022: $436,447 (+$74,473, +20.57% from previous year)
- 2023: $448,988 (+$12,541, +2.87% from previous year)
- 2024: $456,228 (+$7,240, +1.61% from previous year)
- 2025: $467,751 (+$11,523, +2.53% from previous year)
Home prices in Westfield have risen by 107% since 2010, starting at $226,181 and reaching $467,751 by 2025. While there were modest dips in 2011, the overall trend has been one of steady growth. Westfield’s strongest single-year gain occurred in 2022, with a remarkable $74,000 increase. That kind of surge reflects intense buyer activity and possibly new local developments. While recent gains have been more moderate, they remain positive and stable. Buyers continue to show strong interest, and the numbers back that up year after year. Homeowners who bought in the early 2010s have seen substantial equity growth. This sustained upward trend highlights Westfield’s position among Indiana’s most desirable housing markets.
Westfield – Premier Living Just North of Indianapolis

Westfield sits just north of Carmel and Indianapolis, and it has quickly become a real estate hotspot. Known for its family-oriented neighborhoods, excellent schools, and Grand Park Sports Campus, the town draws in residents from all over the region. Westfield has seen an explosion of new housing construction and infrastructure improvements over the last decade. As a result, demand continues to climb, which is reflected in consistent price increases. The town’s blend of suburban comfort and accessibility to the city makes it especially appealing for professionals and growing families. Westfield’s leadership has also focused on long-term planning, ensuring the community evolves while preserving its appeal. With strong amenities and increasing name recognition, it’s no wonder that property values have taken off.
7. Ogden Dunes – 61% Home Price Increase Since 2010
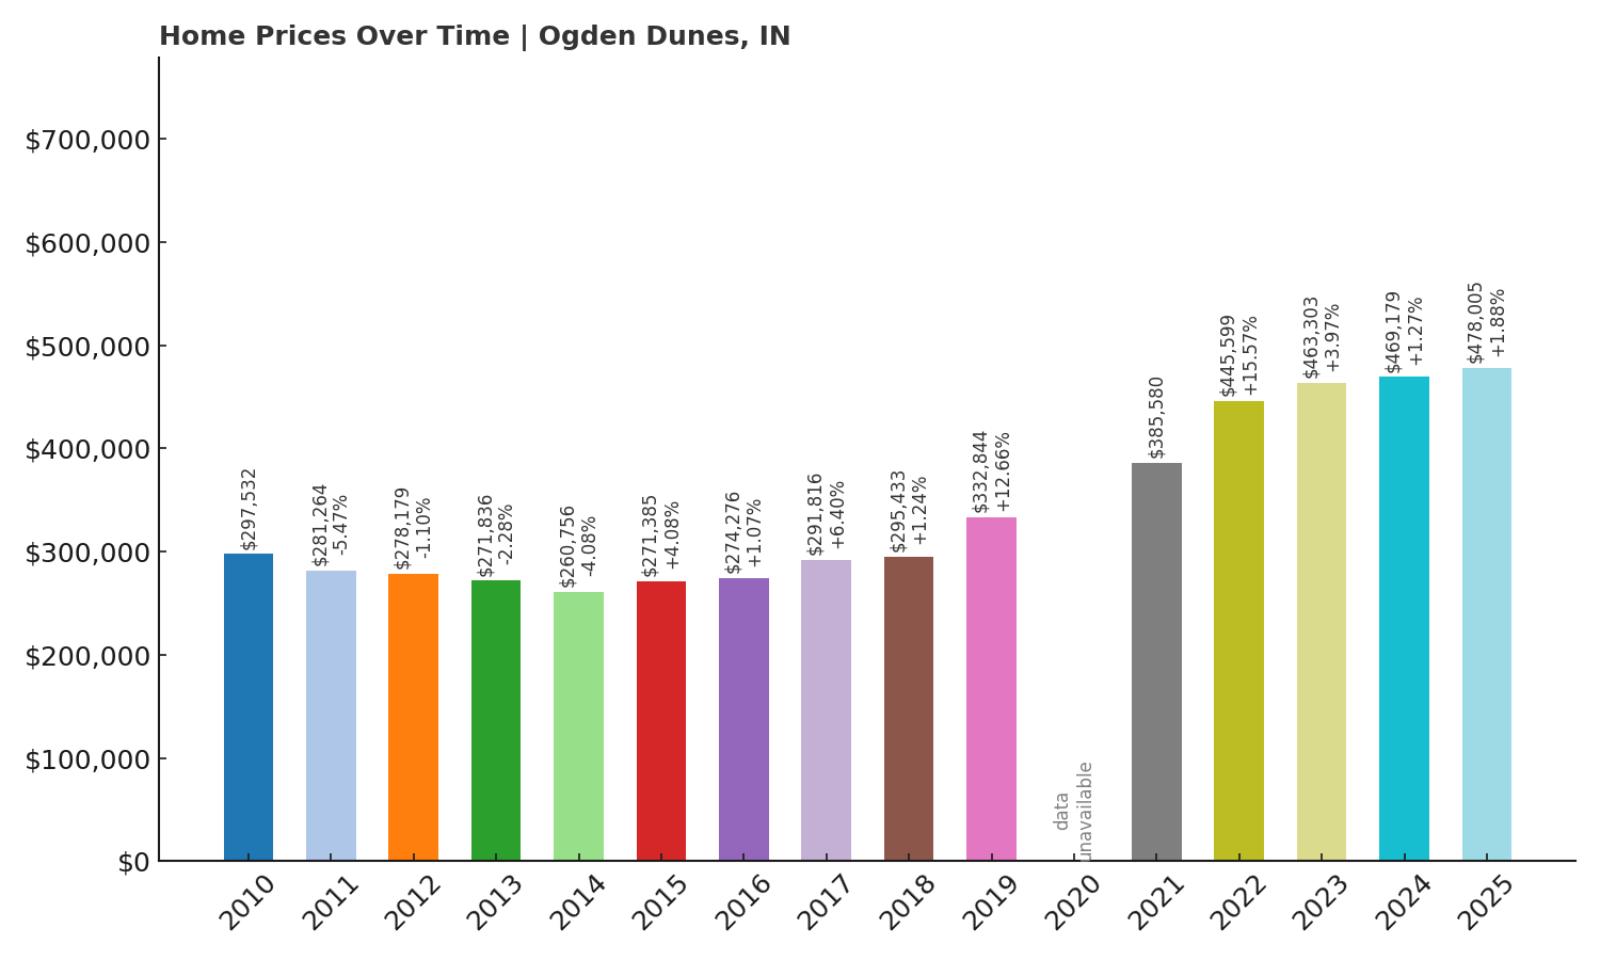
- 2010: $297,532
- 2011: $281,264 (-$16,268, -5.47% from previous year)
- 2012: $278,179 (-$3,085, -1.10% from previous year)
- 2013: $271,836 (-$6,343, -2.28% from previous year)
- 2014: $260,756 (-$11,080, -4.08% from previous year)
- 2015: $271,385 (+$10,629, +4.08% from previous year)
- 2016: $274,276 (+$2,891, +1.07% from previous year)
- 2017: $291,816 (+$17,540, +6.40% from previous year)
- 2018: $295,433 (+$3,617, +1.24% from previous year)
- 2019: $332,844 (+$37,411, +12.66% from previous year)
- 2020: N/A
- 2021: $385,580
- 2022: $445,599 (+$60,018, +15.57% from previous year)
- 2023: $463,303 (+$17,704, +3.97% from previous year)
- 2024: $469,179 (+$5,877, +1.27% from previous year)
- 2025: $478,005 (+$8,825, +1.88% from previous year)
Ogden Dunes has seen a 61% increase in home values since 2010, rising from $297,532 to $478,005 in 2025. Though the town experienced several years of price declines early in the decade, the market began recovering in 2015 and picked up steam in the years that followed. The most dramatic appreciation occurred after 2020, particularly with a $60,000 jump in 2022. While recent years have shown smaller gains, values have held strong and continue trending upward. The data suggests a market that has matured and stabilized after earlier volatility. Buyers who entered the market during the mid-2010s likely saw strong equity gains. With prices now well above the $450K mark, Ogden Dunes has established itself as a premium coastal market. The trend reflects both scarcity and sustained demand in this unique lakefront setting.
Ogden Dunes – Lake Michigan Views and Market Resilience

Ogden Dunes sits along the Lake Michigan shoreline in Porter County and is known for its dunes, beaches, and natural beauty. This small town offers a rare combination of tranquility and easy access to Chicago via the South Shore Line. Its exclusivity and limited inventory have contributed to consistently rising home values. Many properties in Ogden Dunes feature direct access to nature trails or lake views, making them highly desirable to a niche group of buyers. Despite price drops earlier in the decade, the town rebounded strongly, especially in the post-pandemic market boom. The community’s preservation efforts and strong local pride also play a role in sustaining high property values. As demand for scenic, remote-friendly living increased, Ogden Dunes became even more attractive. For buyers seeking a lakeside retreat with investment upside, it’s hard to beat.
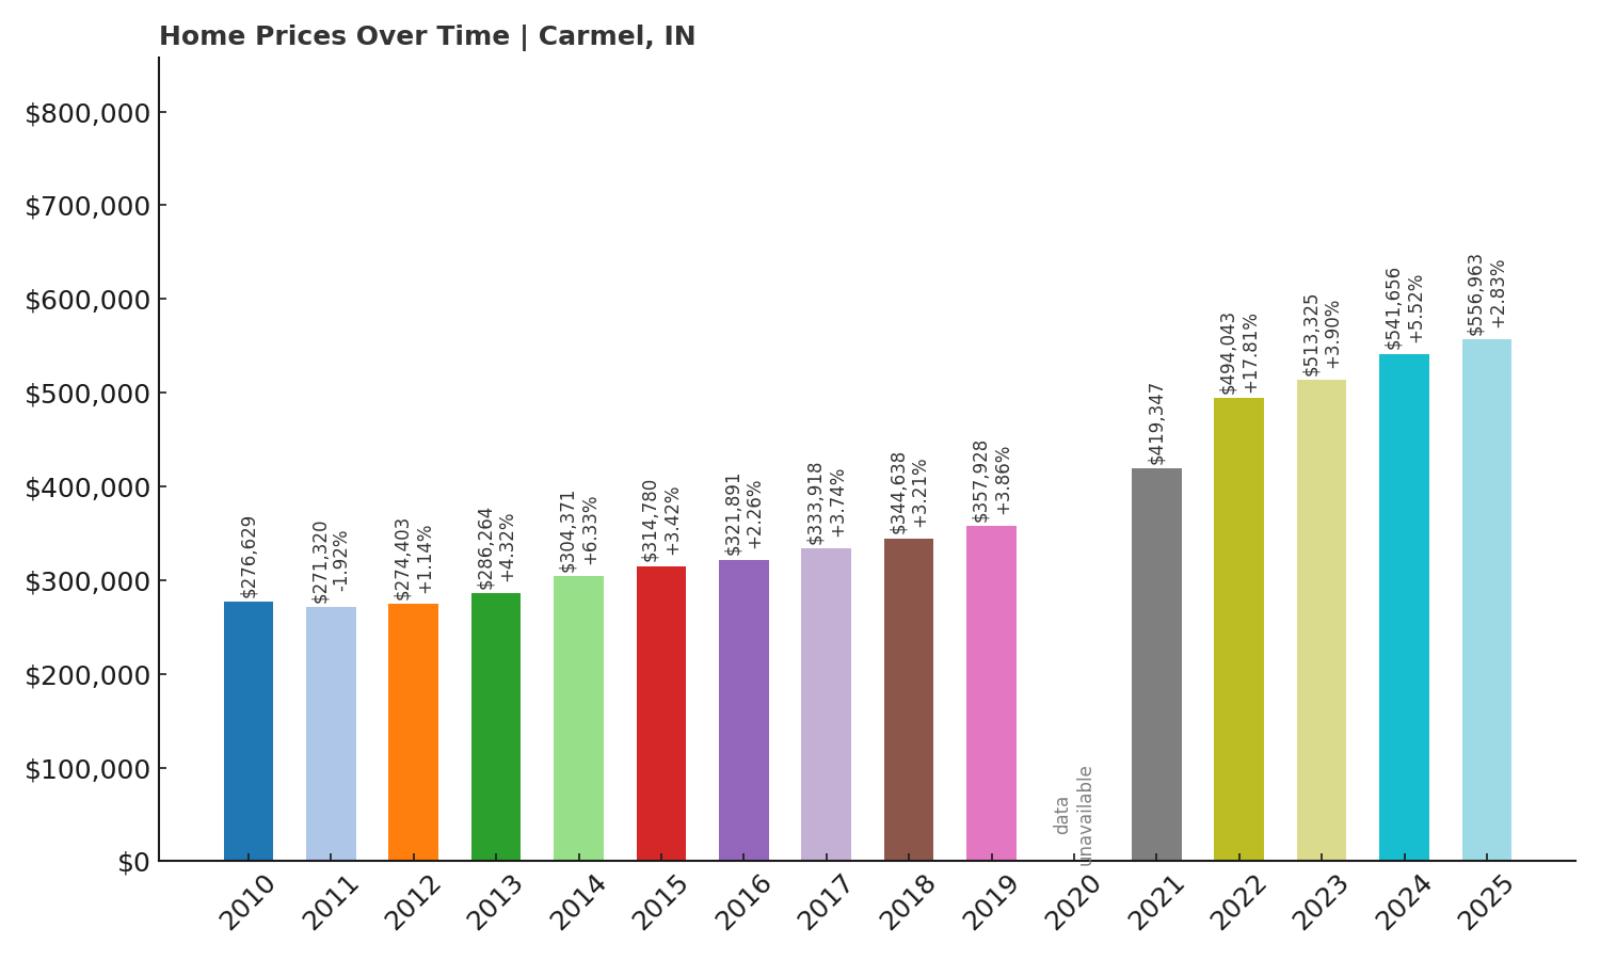
6. Carmel – 101% Home Price Increase Since 2010
🔥 Would you like to save this?
- 2010: $276,629
- 2011: $271,320 (-$5,310, -1.92% from previous year)
- 2012: $274,403 (+$3,083, +1.14% from previous year)
- 2013: $286,264 (+$11,861, +4.32% from previous year)
- 2014: $304,371 (+$18,107, +6.33% from previous year)
- 2015: $314,780 (+$10,409, +3.42% from previous year)
- 2016: $321,891 (+$7,111, +2.26% from previous year)
- 2017: $333,918 (+$12,027, +3.74% from previous year)
- 2018: $344,638 (+$10,720, +3.21% from previous year)
- 2019: $357,928 (+$13,290, +3.86% from previous year)
- 2020: N/A
- 2021: $419,347
- 2022: $494,043 (+$74,696, +17.81% from previous year)
- 2023: $513,325 (+$19,282, +3.90% from previous year)
- 2024: $541,656 (+$28,331, +5.52% from previous year)
- 2025: $556,963 (+$15,307, +2.83% from previous year)
Home prices in Carmel have risen from $276,629 in 2010 to $556,963 in 2025—a 101% increase over the 15-year period. While early growth was slow and steady, things accelerated significantly after 2020, with a standout $74,000 increase in 2022. Since then, gains have continued at a healthy clip, pushing the median value past $550,000. Carmel’s pricing trajectory shows a well-established market with long-term strength. The consistent annual increases reflect both strong local amenities and high buyer demand. There were no major corrections or sharp declines, even during nationwide housing volatility. Investors and homebuyers alike have viewed Carmel as a safe and rewarding market. In terms of value growth and desirability, it remains a standout among Indiana’s elite housing markets.
Carmel – Indiana’s Model City for Price Growth

Carmel is widely regarded as one of Indiana’s most livable cities—and the housing market confirms it. Located just north of Indianapolis, it boasts a master-planned layout, award-winning schools, and a vibrant downtown arts district. Carmel’s strong public investments, like the Monon Trail and Center for the Performing Arts, have helped maintain its reputation and home values. The city also benefits from a robust local economy, supported by tech companies and corporate offices. In terms of housing, Carmel offers everything from luxury estates to family-friendly neighborhoods, all with top-tier infrastructure. These factors contribute to consistently high demand and low inventory. With prices rising more than 100% since 2010, it’s clear that buyers are willing to pay a premium for everything Carmel has to offer. It’s one of the clearest examples in the state of how strong planning drives market strength.
5. Michiana Shores – 101% Home Price Increase Since 2010
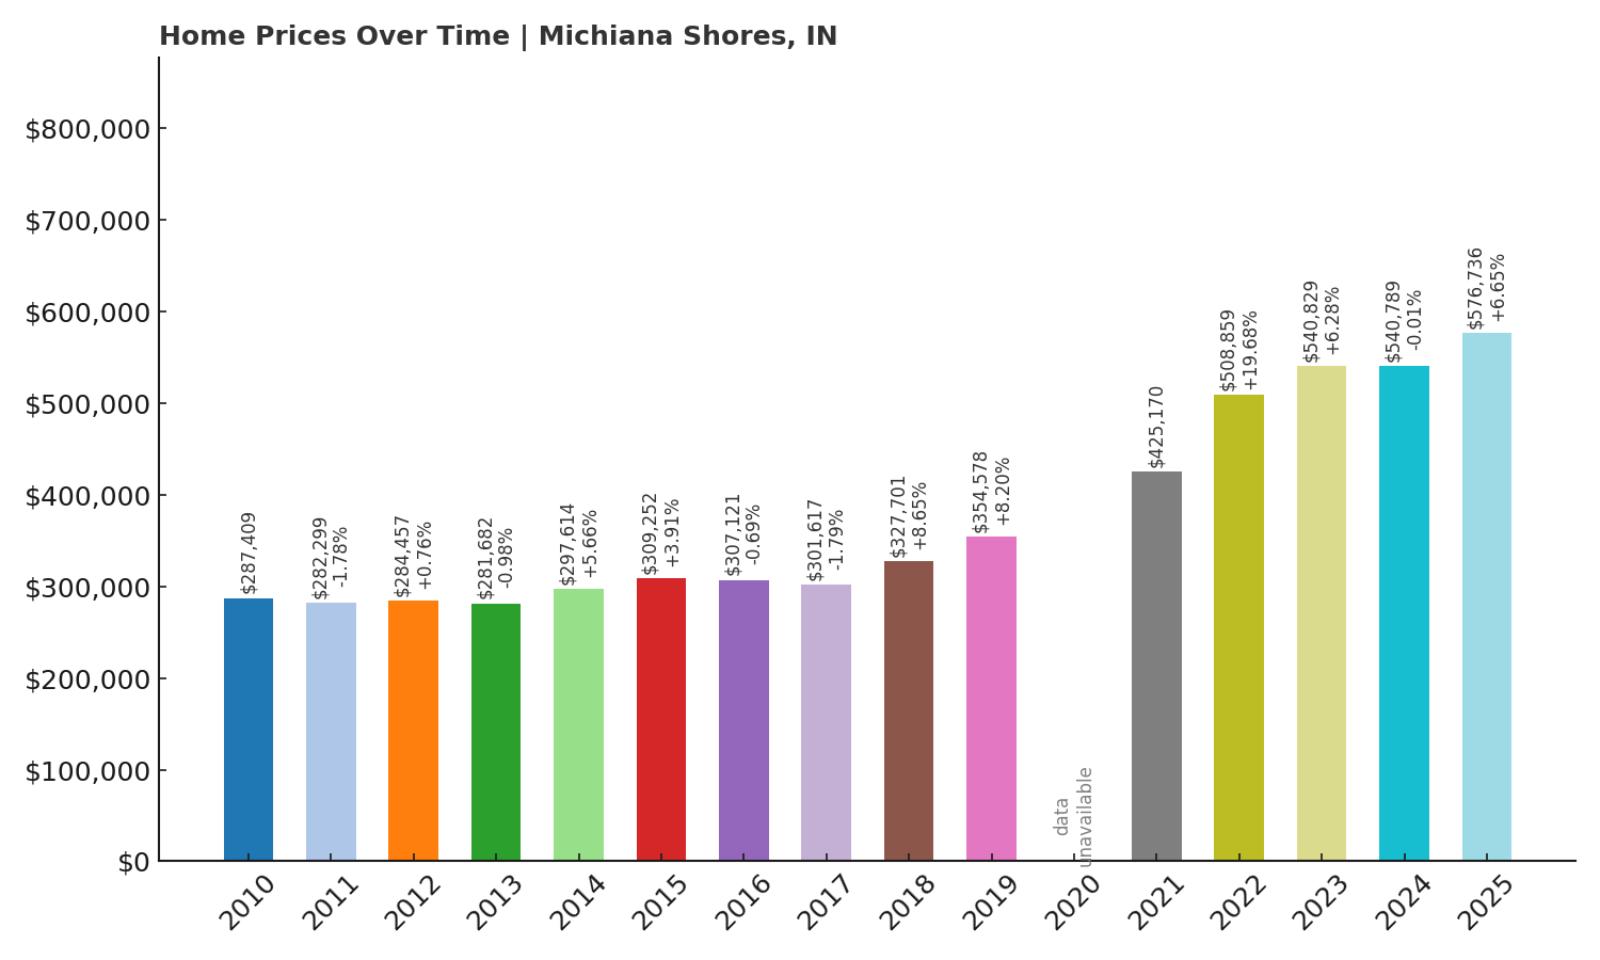
- 2010: $287,409
- 2011: $282,299 (-$5,110, -1.78% from previous year)
- 2012: $284,457 (+$2,159, +0.76% from previous year)
- 2013: $281,682 (-$2,775, -0.98% from previous year)
- 2014: $297,614 (+$15,932, +5.66% from previous year)
- 2015: $309,252 (+$11,637, +3.91% from previous year)
- 2016: $307,121 (-$2,131, -0.69% from previous year)
- 2017: $301,617 (-$5,504, -1.79% from previous year)
- 2018: $327,701 (+$26,084, +8.65% from previous year)
- 2019: $354,578 (+$26,877, +8.20% from previous year)
- 2020: N/A
- 2021: $425,170
- 2022: $508,859 (+$83,689, +19.68% from previous year)
- 2023: $540,829 (+$31,970, +6.28% from previous year)
- 2024: $540,789 (-$40, -0.01% from previous year)
- 2025: $576,736 (+$35,947, +6.65% from previous year)
Michiana Shores has seen its home values more than double since 2010, increasing from $287,409 to $576,736—a 101% gain. While the early 2010s were marked by fluctuations and mild losses, momentum picked up dramatically from 2018 onward. The town posted especially sharp gains in 2022 and 2023, with consecutive double-digit increases. These spikes likely reflect both rising demand for vacation homes and limited inventory. Though prices held steady in 2024, growth resumed in 2025 with another strong jump. The current price level places Michiana Shores firmly among Indiana’s priciest markets. Over the long term, appreciation has been both steady and impressive. The data points to a high-value market with ongoing appeal to well-capitalized buyers seeking premium lakefront property.
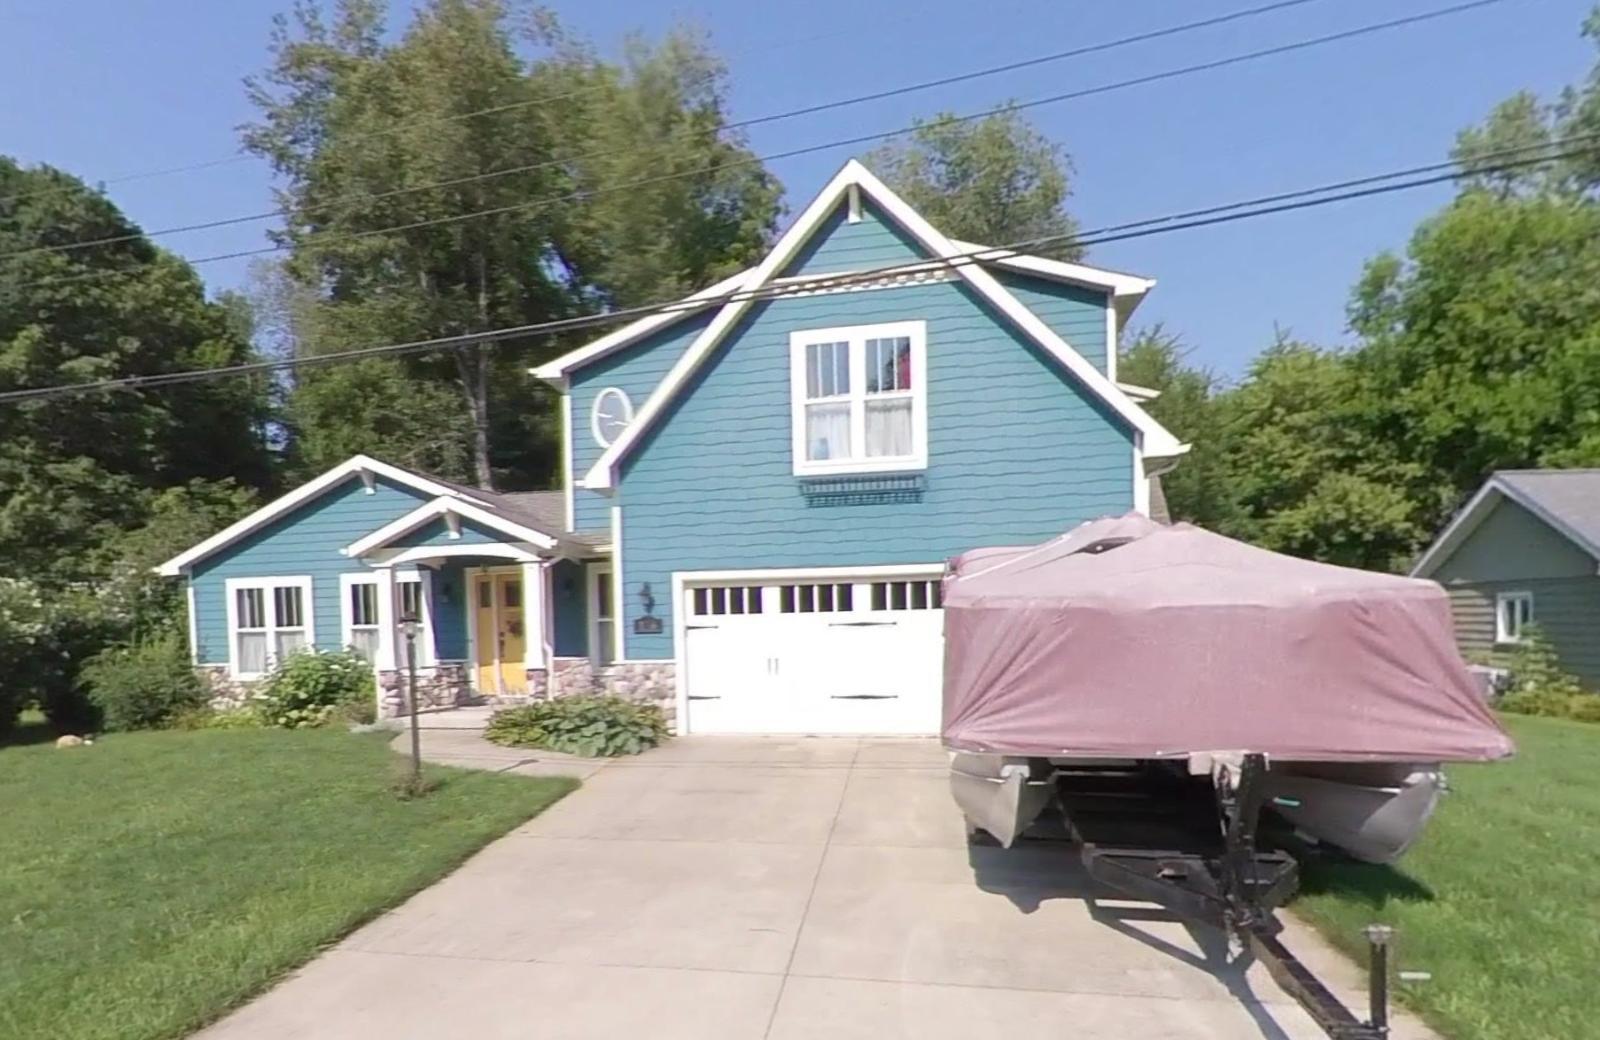
Michiana Shores – Luxury Living by the Lake

Michiana Shores is tucked along Indiana’s northwestern shoreline and is known for its quiet, wooded lots and direct access to Lake Michigan beaches. It’s a popular retreat for both Illinois and Indiana residents, with many homes used as second properties or vacation rentals. The town has a distinct, laid-back feel that sets it apart from more developed lakefront communities. The scarcity of available properties and its proximity to Chicago continue to fuel price appreciation. In recent years, demand has grown significantly, particularly among buyers seeking a blend of privacy and coastal charm. Michiana Shores has benefited from this interest while maintaining its character, with strict zoning helping to preserve its appeal. For buyers with deep pockets, it’s one of the most attractive and exclusive lakefront enclaves in Indiana.
4. Zionsville – 103% Home Price Increase Since 2010
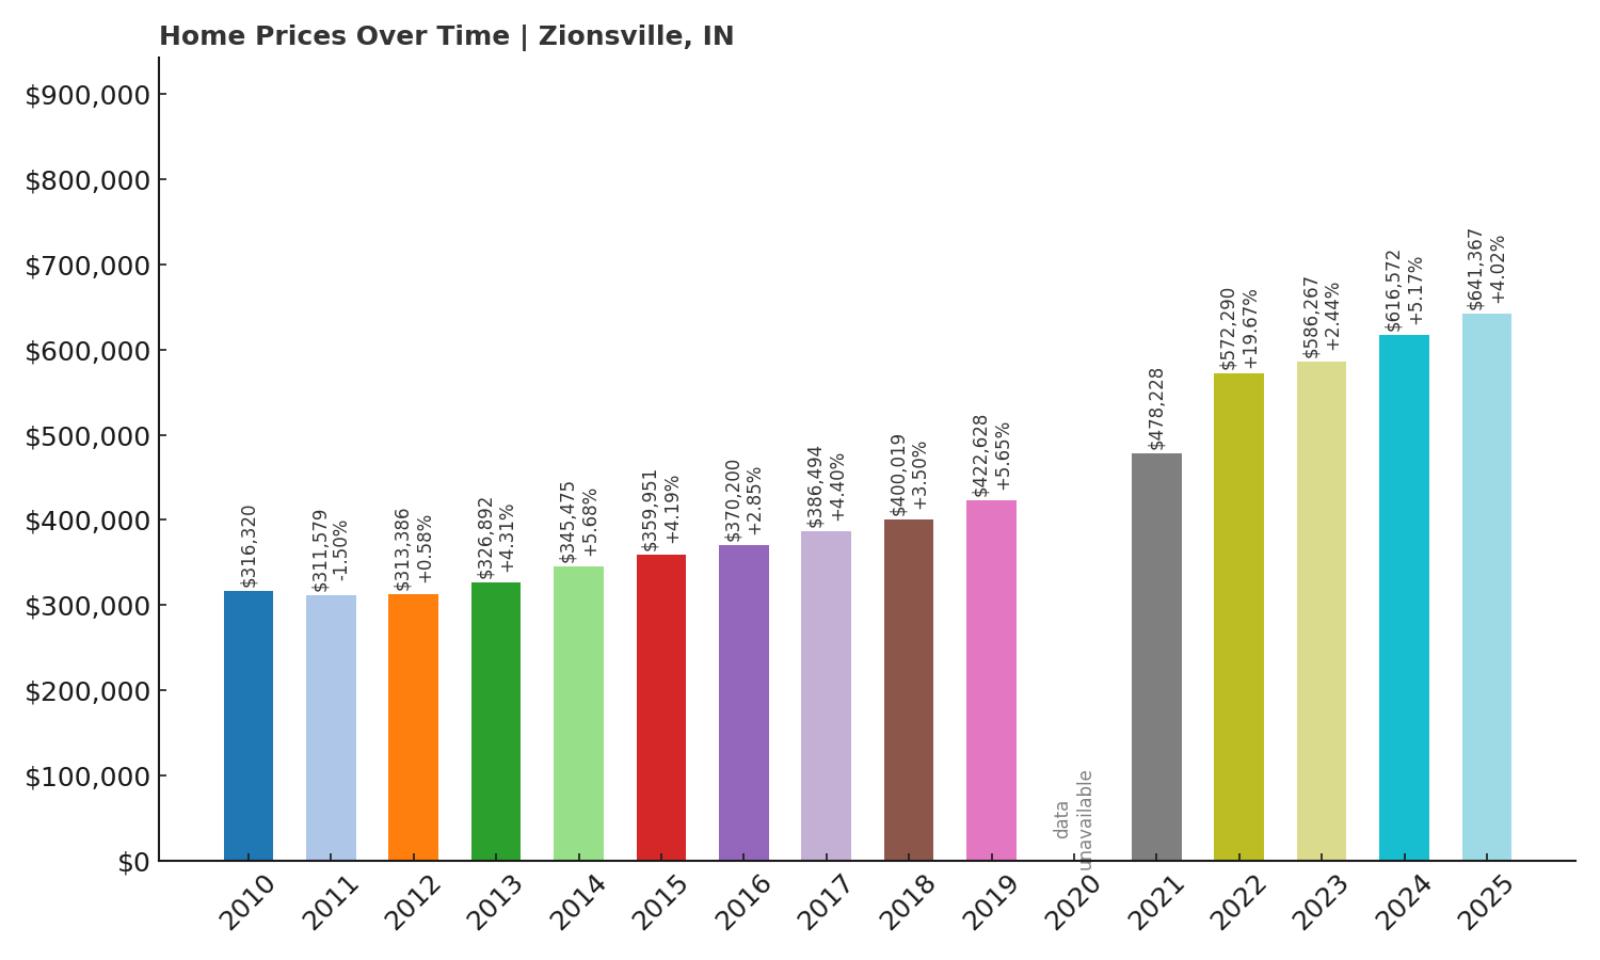
- 2010: $316,320
- 2011: $311,579 (-$4,741, -1.50% from previous year)
- 2012: $313,386 (+$1,807, +0.58% from previous year)
- 2013: $326,892 (+$13,506, +4.31% from previous year)
- 2014: $345,475 (+$18,583, +5.68% from previous year)
- 2015: $359,951 (+$14,476, +4.19% from previous year)
- 2016: $370,200 (+$10,249, +2.85% from previous year)
- 2017: $386,494 (+$16,295, +4.40% from previous year)
- 2018: $400,019 (+$13,525, +3.50% from previous year)
- 2019: $422,628 (+$22,609, +5.65% from previous year)
- 2020: N/A
- 2021: $478,228
- 2022: $572,290 (+$94,063, +19.67% from previous year)
- 2023: $586,267 (+$13,977, +2.44% from previous year)
- 2024: $616,572 (+$30,304, +5.17% from previous year)
- 2025: $641,367 (+$24,795, +4.02% from previous year)
Zionsville’s home values have climbed from $316,320 in 2010 to $641,367 in 2025, marking a 103% increase. The town experienced consistent year-over-year growth with only a slight dip in 2011. The biggest gain came in 2022, when values soared by over $94,000 in just one year. Since then, price increases have remained positive, reflecting strong market fundamentals. Zionsville has clearly become one of the state’s most desirable places to live. The steady growth trajectory and recent acceleration suggest a housing market with both strong demand and high buyer confidence. With current prices well over $600,000, the town sits firmly in Indiana’s luxury housing tier. Its price history underscores both its appeal and resilience.
Zionsville – Elegant Suburban Living with Lasting Value

Zionsville is an upscale town located northwest of Indianapolis, celebrated for its brick-paved Main Street, boutique shopping, and top-rated schools. Its historic charm and high-end residential developments have made it a magnet for affluent homebuyers. The town has carefully managed growth while maintaining a strong sense of identity, and that planning is reflected in the strength of its housing market. Newer neighborhoods offer modern conveniences, while older areas preserve architectural character. Zionsville’s proximity to major employers and the city core gives it an edge over other suburbs. Combined with a strong school system and high community engagement, it’s no surprise that prices have more than doubled. For families and professionals alike, Zionsville offers both luxury and livability in one of Indiana’s most prestigious settings.
3. Clear Lake – 103% Home Price Increase Since 2010

- 2010: $351,938
- 2011: $367,414 (+$15,476, +4.40% from previous year)
- 2012: $359,720 (-$7,694, -2.09% from previous year)
- 2013: $349,215 (-$10,505, -2.92% from previous year)
- 2014: $370,370 (+$21,154, +6.06% from previous year)
- 2015: $390,911 (+$20,542, +5.55% from previous year)
- 2016: $413,917 (+$23,005, +5.89% from previous year)
- 2017: $410,369 (-$3,548, -0.86% from previous year)
- 2018: $423,500 (+$13,131, +3.20% from previous year)
- 2019: $460,366 (+$36,866, +8.70% from previous year)
- 2020: N/A
- 2021: $531,511
- 2022: $659,099 (+$127,588, +24.00% from previous year)
- 2023: $676,895 (+$17,796, +2.70% from previous year)
- 2024: $703,849 (+$26,955, +3.98% from previous year)
- 2025: $713,045 (+$9,196, +1.31% from previous year)
Clear Lake’s home values have surged by 103% since 2010, rising from $351,938 to $713,045. After some early fluctuations, the town posted massive gains from 2020 onward. The standout year was 2022, when home prices jumped by over $127,000. Though the rate of increase has moderated since, prices have continued to rise each year. This sustained appreciation points to Clear Lake’s enduring desirability among buyers. Waterfront properties and limited land availability likely play a major role in supporting prices. By 2025, the median home value crossed the $700,000 mark, reflecting both luxury status and market strength. Over time, Clear Lake has proven to be a high-return market for homeowners and investors alike.
Clear Lake – Exclusive Waterfront Growth
Located in far northeastern Indiana near the Ohio border, Clear Lake is a small town centered around its namesake lake. Known for crystal-clear water and upscale homes, the area attracts vacationers and second-home buyers from across the Midwest. Its seclusion and tight inventory have kept demand high and turnover low, making prices climb steadily. Many homes feature lakefront access or panoramic water views, adding substantial value. With fewer than 400 residents, the market is small but powerful—homes rarely stay available for long. Over the past decade, Clear Lake has become one of Indiana’s top-tier luxury destinations. As remote work has expanded possibilities, more full-time residents have joined the seasonal crowd. The result is a housing market where supply remains tight and value continues to soar.
2. Long Beach – 95% Home Price Increase Since 2010

- 2010: $377,448
- 2011: $372,660 (-$4,788, -1.27% from previous year)
- 2012: $373,507 (+$847, +0.23% from previous year)
- 2013: $358,176 (-$15,331, -4.10% from previous year)
- 2014: $355,464 (-$2,712, -0.76% from previous year)
- 2015: $372,029 (+$16,565, +4.66% from previous year)
- 2016: $394,625 (+$22,596, +6.07% from previous year)
- 2017: $391,836 (-$2,789, -0.71% from previous year)
- 2018: $403,750 (+$11,914, +3.04% from previous year)
- 2019: $442,944 (+$39,195, +9.71% from previous year)
- 2020: N/A
- 2021: $557,837
- 2022: $665,668 (+$107,832, +19.33% from previous year)
- 2023: $690,502 (+$24,834, +3.73% from previous year)
- 2024: $694,367 (+$3,865, +0.56% from previous year)
- 2025: $735,066 (+$40,699, +5.86% from previous year)
From 2010 to 2025, Long Beach home prices rose from $377,448 to $735,066—a 95% increase. The market saw some fluctuation early on, but by 2016, prices began rising more consistently. The post-pandemic years brought the sharpest growth, especially a $107,000 gain in 2022 alone. Demand has remained strong since, and current prices are among the highest in the state. Despite being a small town, Long Beach consistently commands a premium. This pattern suggests long-term confidence from both local and out-of-state buyers. With values nearing three-quarters of a million dollars, it’s clearly a luxury housing destination. For those seeking a solid investment and lakeside lifestyle, Long Beach continues to deliver.
Long Beach – Premier Coastal Market in Northwest Indiana
🔥 Would you like to save this?
Long Beach is located on the southern shore of Lake Michigan and has long been one of Indiana’s most coveted beach towns. Its tree-lined streets, private beach access, and architectural variety make it appealing to both seasonal and full-time residents. Located just a short drive from Chicago, it attracts buyers looking for upscale coastal property within commuting distance of the city. Many homes here are custom-built and feature amenities like lake views, walkability, and large lots. The town has carefully preserved its charm while supporting new construction that complements the landscape. As a result, prices have steadily climbed over the years. Long Beach remains a top choice for luxury buyers seeking beachfront privacy without leaving Indiana.
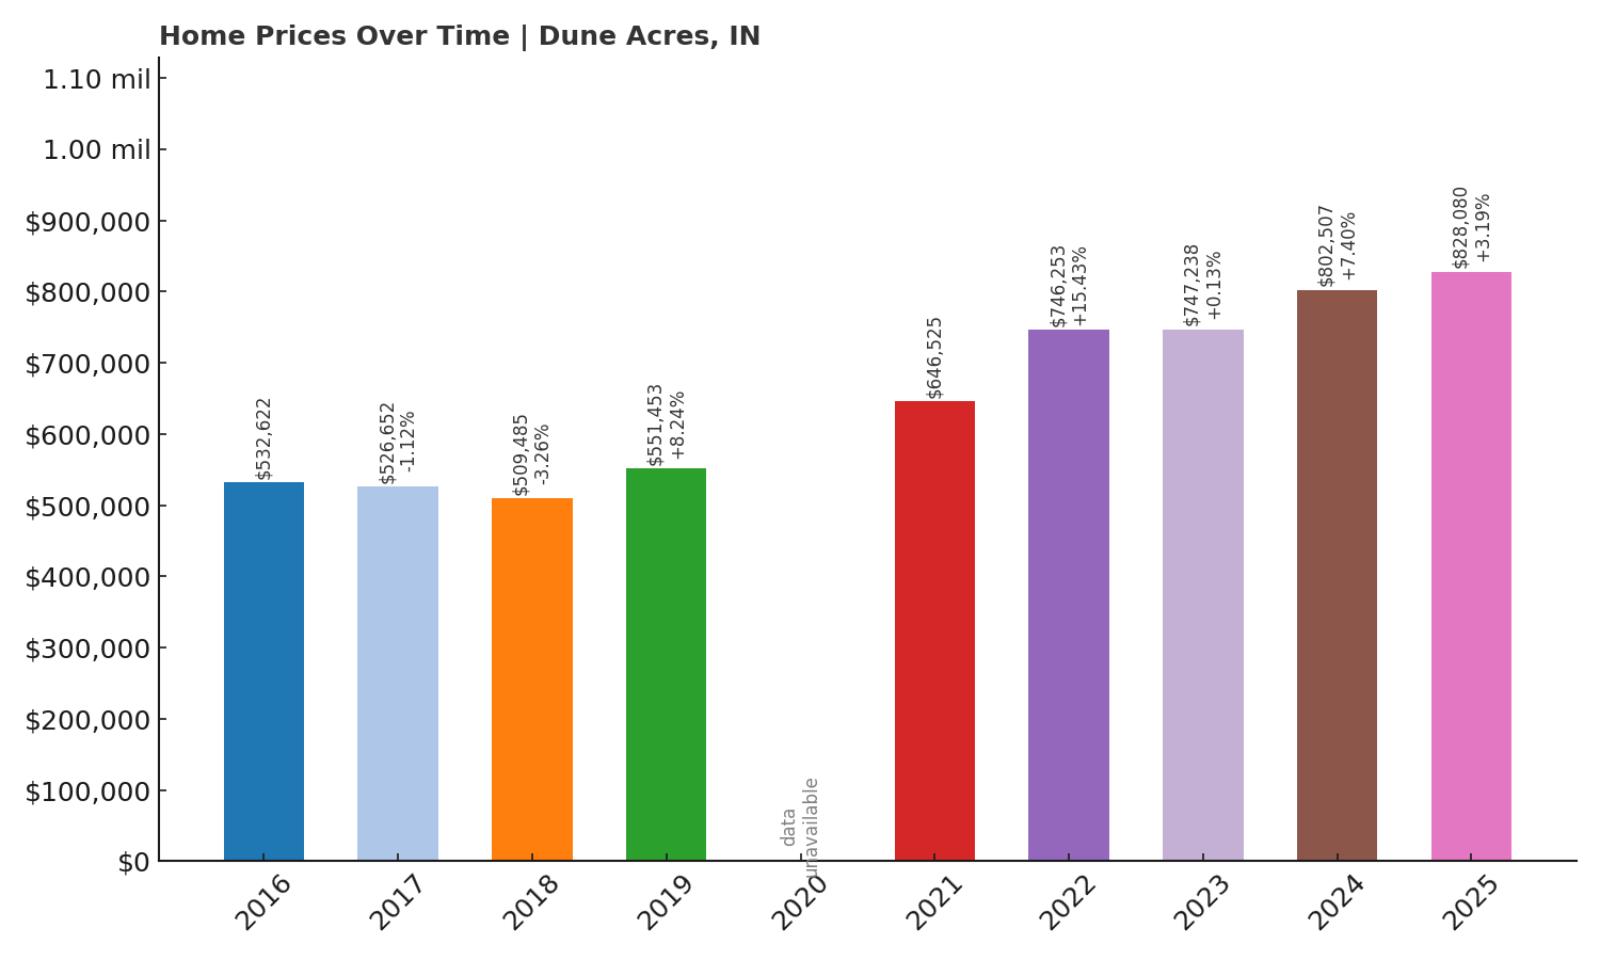
1. Dune Acres – 55% Home Price Increase Since 2016
- 2010: N/A
- 2011: N/A
- 2012: N/A
- 2013: N/A
- 2014: N/A
- 2015: N/A
- 2016: $532,622
- 2017: $526,652 (-$5,970, -1.12% from previous year)
- 2018: $509,485 (-$17,167, -3.26% from previous year)
- 2019: $551,453 (+$41,969, +8.24% from previous year)
- 2020: N/A
- 2021: $646,525
- 2022: $746,253 (+$99,728, +15.43% from previous year)
- 2023: $747,238 (+$985, +0.13% from previous year)
- 2024: $802,507 (+$55,269, +7.40% from previous year)
- 2025: $828,080 (+$25,573, +3.19% from previous year)
Dune Acres has seen a 55% increase in home values since 2016, rising from $532,622 to $828,080 by 2025. While the market dipped briefly in the late 2010s, strong appreciation followed starting in 2019. The biggest surge came in 2022, with home values increasing nearly $100,000 in a single year. Since then, prices have continued rising steadily, even if more moderately. This growth pattern points to sustained interest in Dune Acres’ rare and scenic properties. The current median price makes it the most expensive town in Indiana by a significant margin. With lakefront views and limited housing stock, the high prices reflect genuine scarcity. Buyers continue to see Dune Acres as a luxury destination worth the premium.
Dune Acres – Indiana’s Most Expensive Coastal Community

Dune Acres sits inside Indiana Dunes National Park and is one of the most exclusive residential areas in the state. Its homes are nestled in the dunes and woodlands, offering dramatic views of Lake Michigan and unmatched privacy. The town is gated and highly regulated, with only a few dozen residences, which keeps supply extremely limited. Residents enjoy private beach access, hiking trails, and the kind of tranquility that’s hard to find anywhere else in the Midwest. The area’s natural beauty, paired with strict building codes, helps preserve both views and values. Because of this, Dune Acres is not only Indiana’s most expensive town but also one of its most protected. Its housing market caters to high-net-worth individuals who value seclusion, scenery, and exclusivity.


