🔥 Would you like to save this?
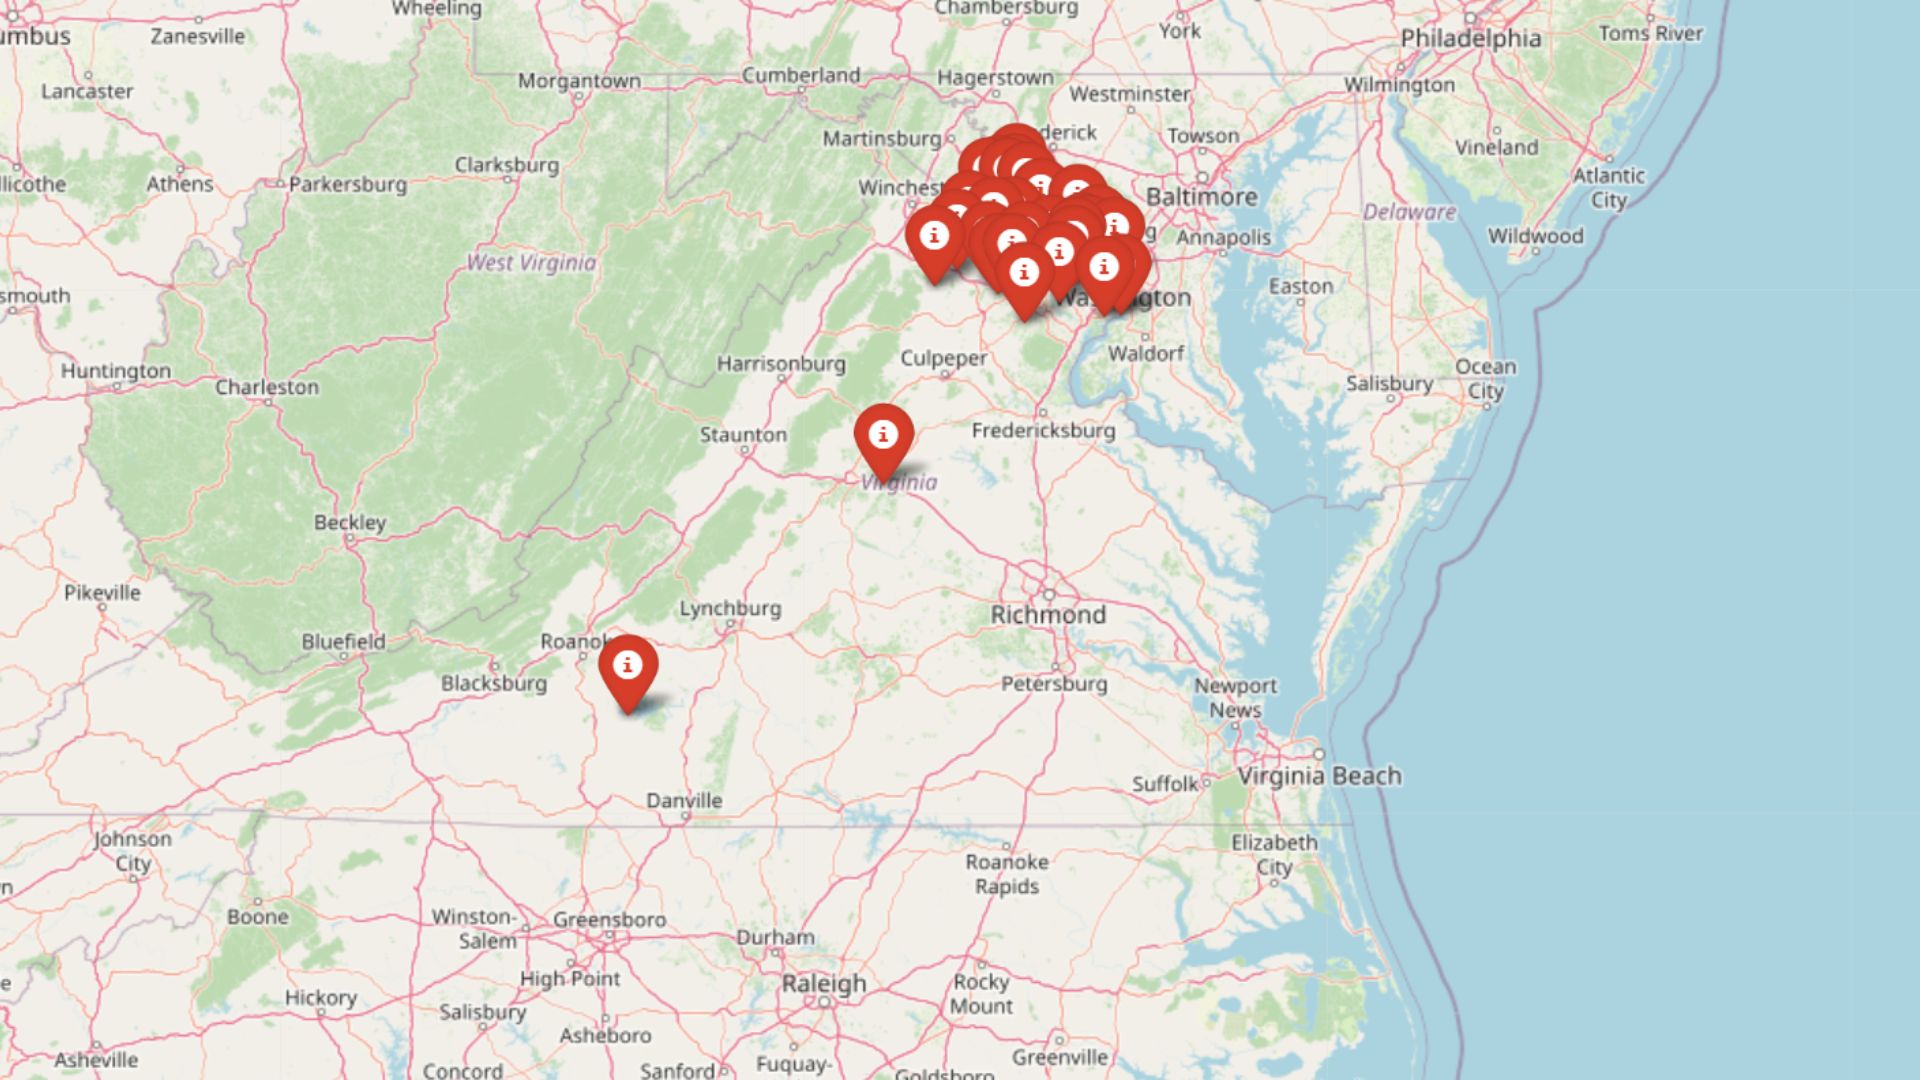
Virginia’s top-tier housing markets aren’t just expensive—they’re dynamic, in-demand, and rapidly evolving. According to the Zillow Home Value Index, 30 towns across the state now lead the pack for home prices in 2025. From historic enclaves to fast-growing suburbs, these communities reflect a mix of wealth, lifestyle appeal, and market pressure that continues to drive values upward. Whether prices rose slowly over time or jumped in recent years, these towns represent the most exclusive real estate markets in Virginia today.
30. Nokesville – 96.9% Home Price Increase Since 2010
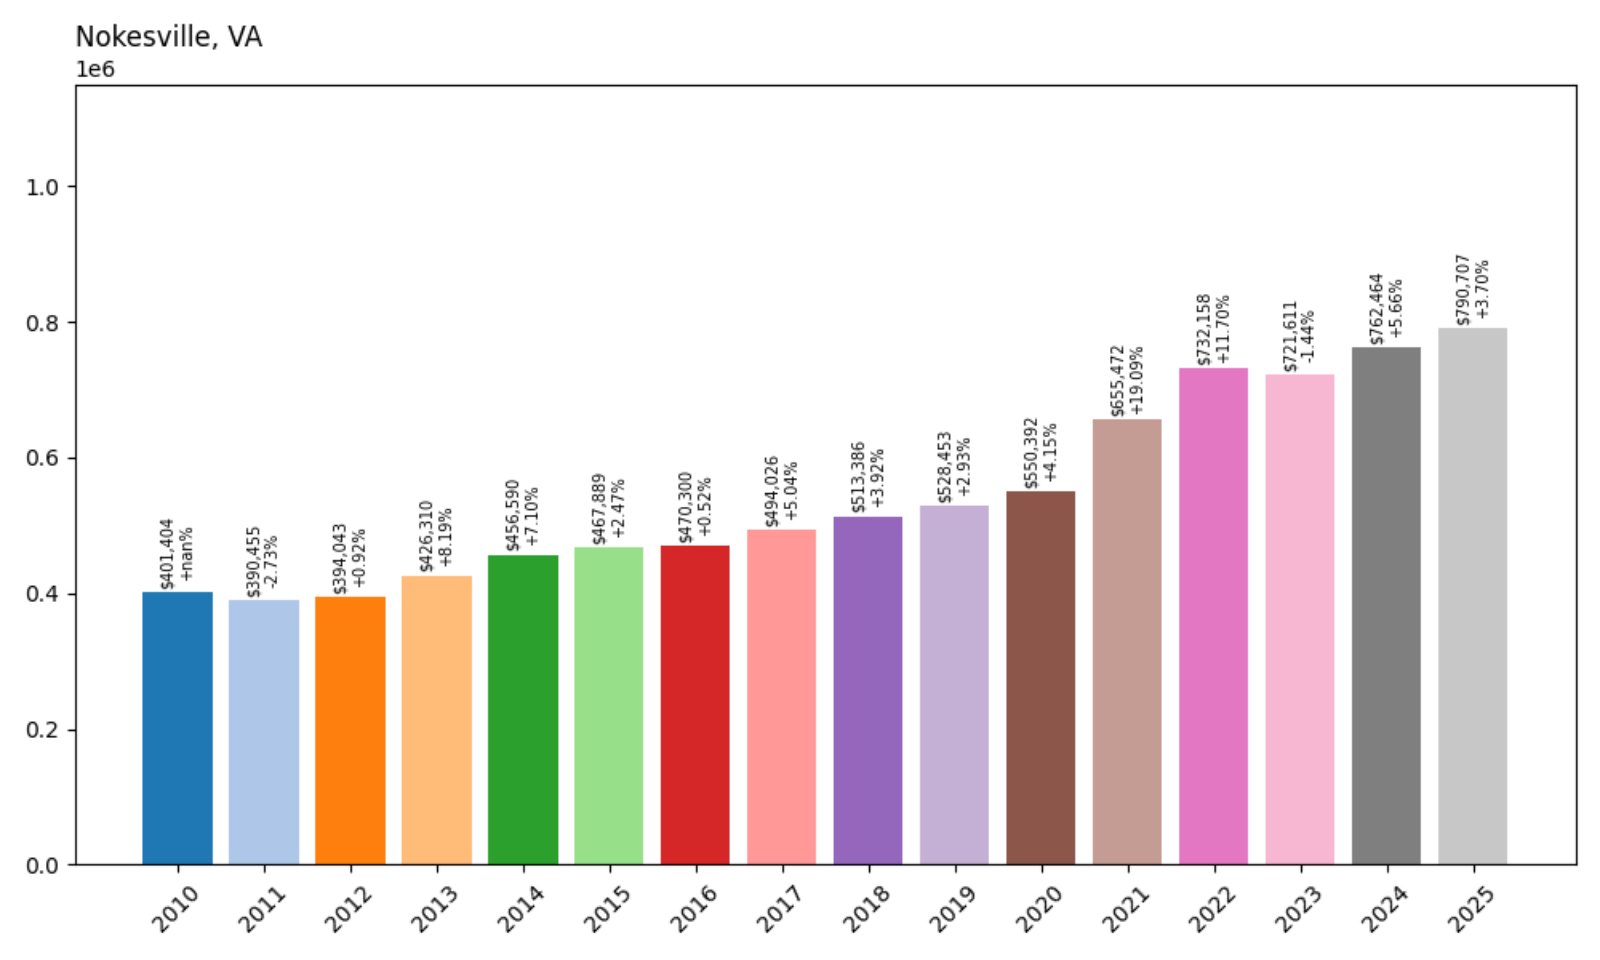
- 2010: $401,404
- 2011: $390,455 (−$10,949, −2.73% from previous year)
- 2012: $394,043 (+$3,588, +0.92%)
- 2013: $426,310 (+$32,268, +8.19%)
- 2014: $456,590 (+$30,280, +7.10%)
- 2015: $467,889 (+$11,299, +2.47%)
- 2016: $470,300 (+$2,411, +0.52%)
- 2017: $494,026 (+$23,726, +5.04%)
- 2018: $513,386 (+$19,360, +3.92%)
- 2019: $528,453 (+$15,067, +2.93%)
- 2020: $550,392 (+$21,939, +4.15%)
- 2021: $655,472 (+$105,080, +19.09%)
- 2022: $732,158 (+$76,685, +11.70%)
- 2023: $721,611 (−$10,547, −1.44%)
- 2024: $762,464 (+$40,853, +5.66%)
- 2025: $790,707 (+$28,243, +3.70%)
Nokesville’s home values have nearly doubled since 2010, with prices rising from just over $400,000 to nearly $791,000 by mid-2025. A brief dip in 2023 didn’t slow momentum for long — the following two years saw solid gains as buyers returned to more rural-feeling, low-density communities with space to spread out.
In order to come up with the very specific design ideas, we create most designs with the assistance of state-of-the-art AI interior design software.
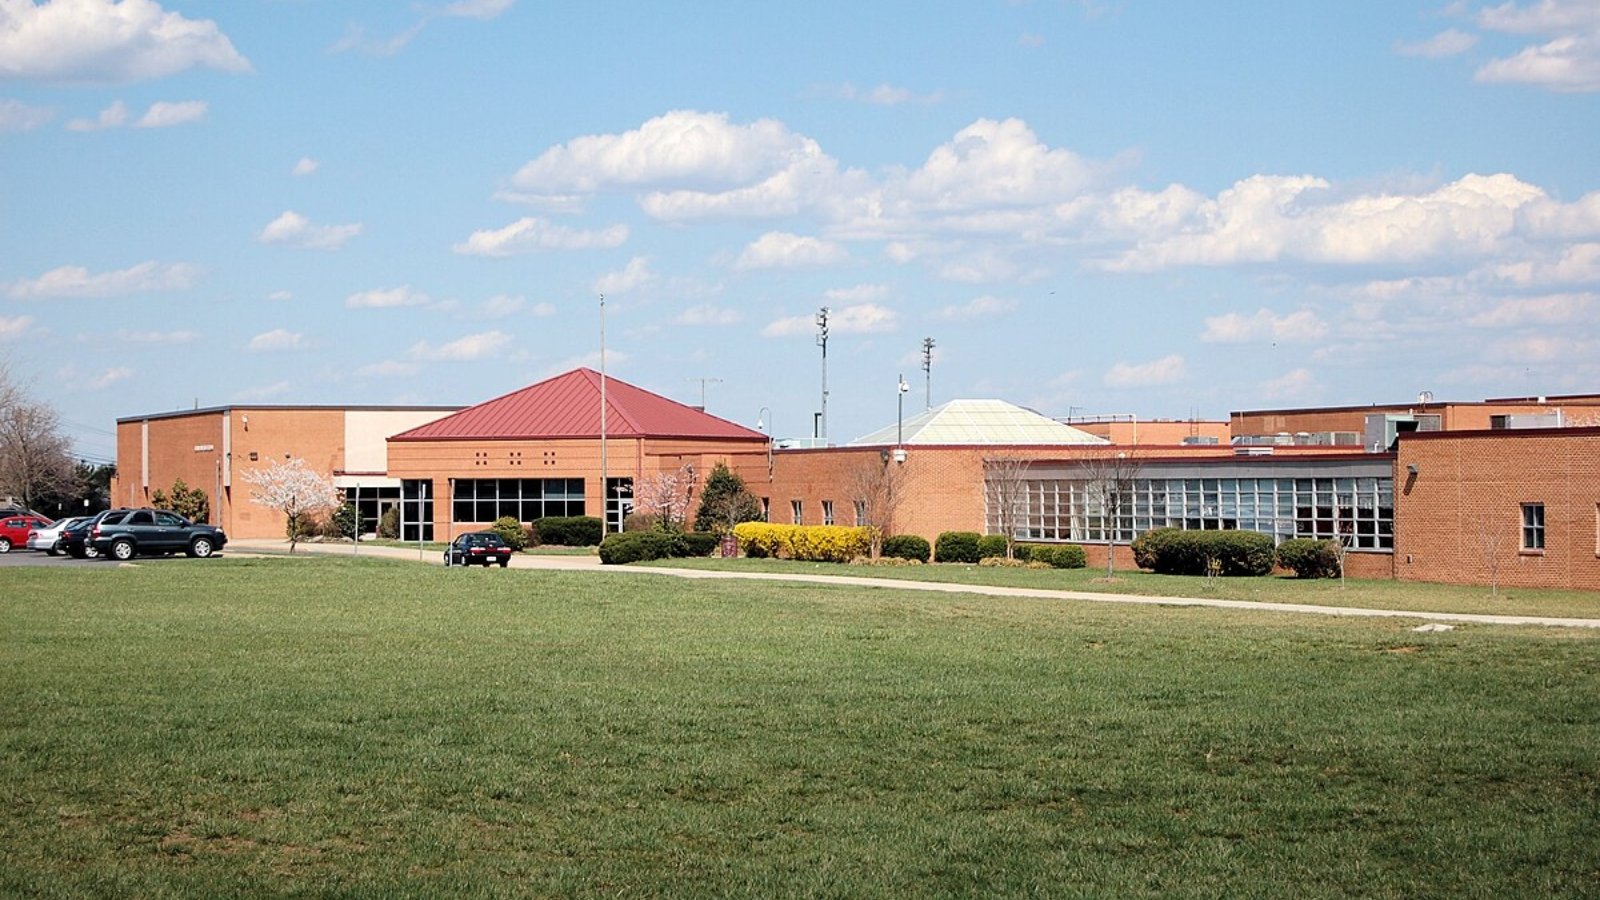
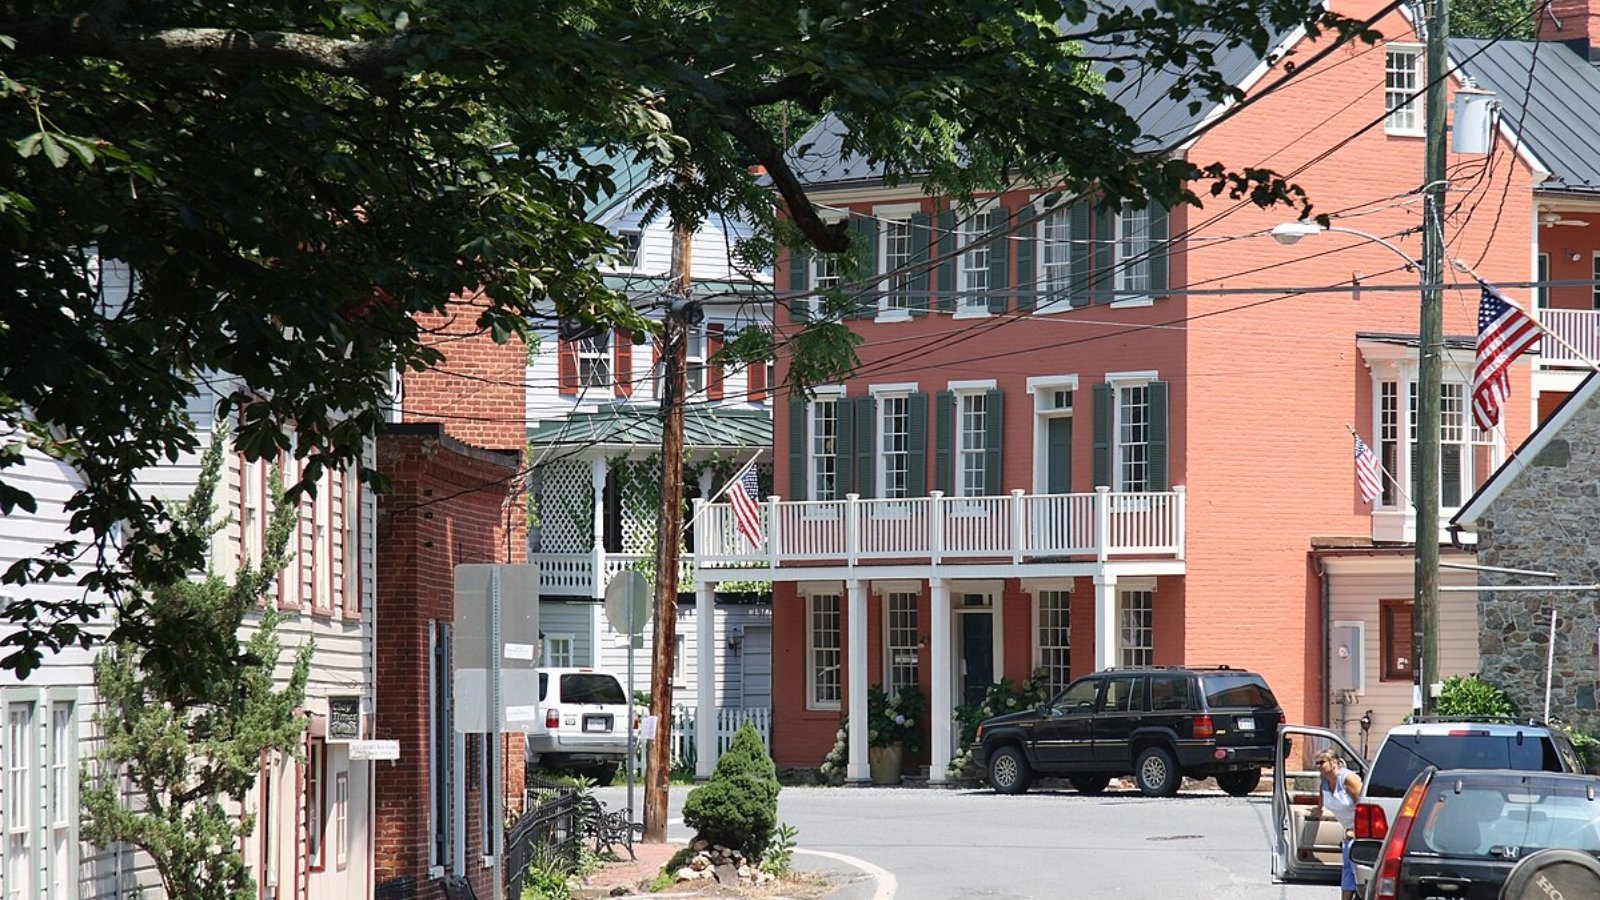
Nokesville – A Quiet Market With Steady Long-Term Gains
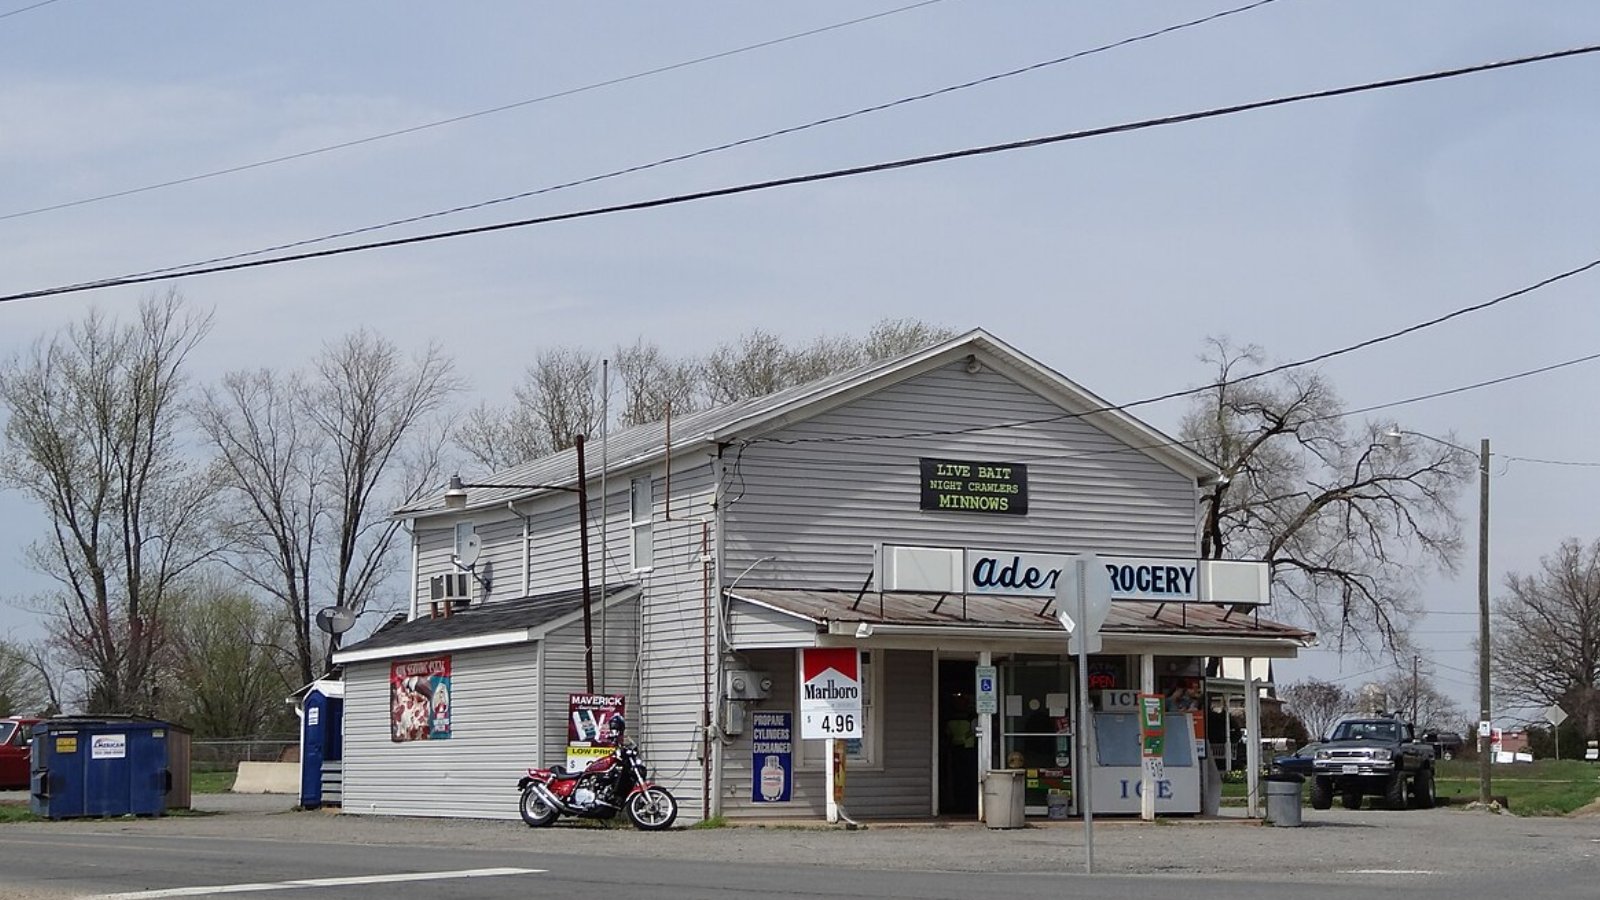
Set in Prince William County, Nokesville is known for its rural charm and open land — a rarity in Northern Virginia. This community has drawn families looking for peace, acreage, and access to highly rated schools. While not as dense or commercial as other areas, Nokesville’s location near major commuter routes like Route 28 and I-66 gives it appeal for those balancing work in the city with a desire for breathing room. Its prices reflect that growing demand, especially after 2020, when suburban and rural properties gained ground across the board.
29. Broad Run – 114.1% Home Price Increase Since 2010

- 2010: $369,906
- 2011: $394,326 (+$24,420, +6.60%)
- 2012: $391,942 (−$2,384, −0.60%)
- 2013: $421,326 (+$29,384, +7.50%)
- 2014: $448,799 (+$27,473, +6.52%)
- 2015: $453,809 (+$5,009, +1.12%)
- 2016: $467,018 (+$13,210, +2.91%)
- 2017: $488,433 (+$21,415, +4.59%)
- 2018: $508,369 (+$19,936, +4.08%)
- 2019: $524,934 (+$16,565, +3.26%)
- 2020: $538,904 (+$13,971, +2.66%)
- 2021: $645,024 (+$106,119, +19.69%)
- 2022: $719,761 (+$74,737, +11.59%)
- 2023: $728,044 (+$8,283, +1.15%)
- 2024: $761,209 (+$33,165, +4.56%)
- 2025: $792,096 (+$30,887, +4.06%)
Broad Run’s home values have risen by over 114% since 2010, crossing the $790K mark in 2025. After a particularly strong surge from 2020 through 2022, the town has continued to grow at a more moderate pace, with consistent annual gains indicating long-term stability in demand.
Broad Run – Growth Fueled by Open Space and Location
Broad Run sits in Fauquier County and offers a mix of farmland, residential enclaves, and proximity to larger employment centers. It’s a draw for buyers looking for room to grow without sacrificing access to Northern Virginia’s economy. With wineries, historic sites, and rolling hills, Broad Run has long attracted a mix of longtime residents and newcomers who prefer privacy and charm over density. The 2020–2022 price leap solidified its place on the luxury map.
28. Fairfax – 81.8% Home Price Increase Since 2010
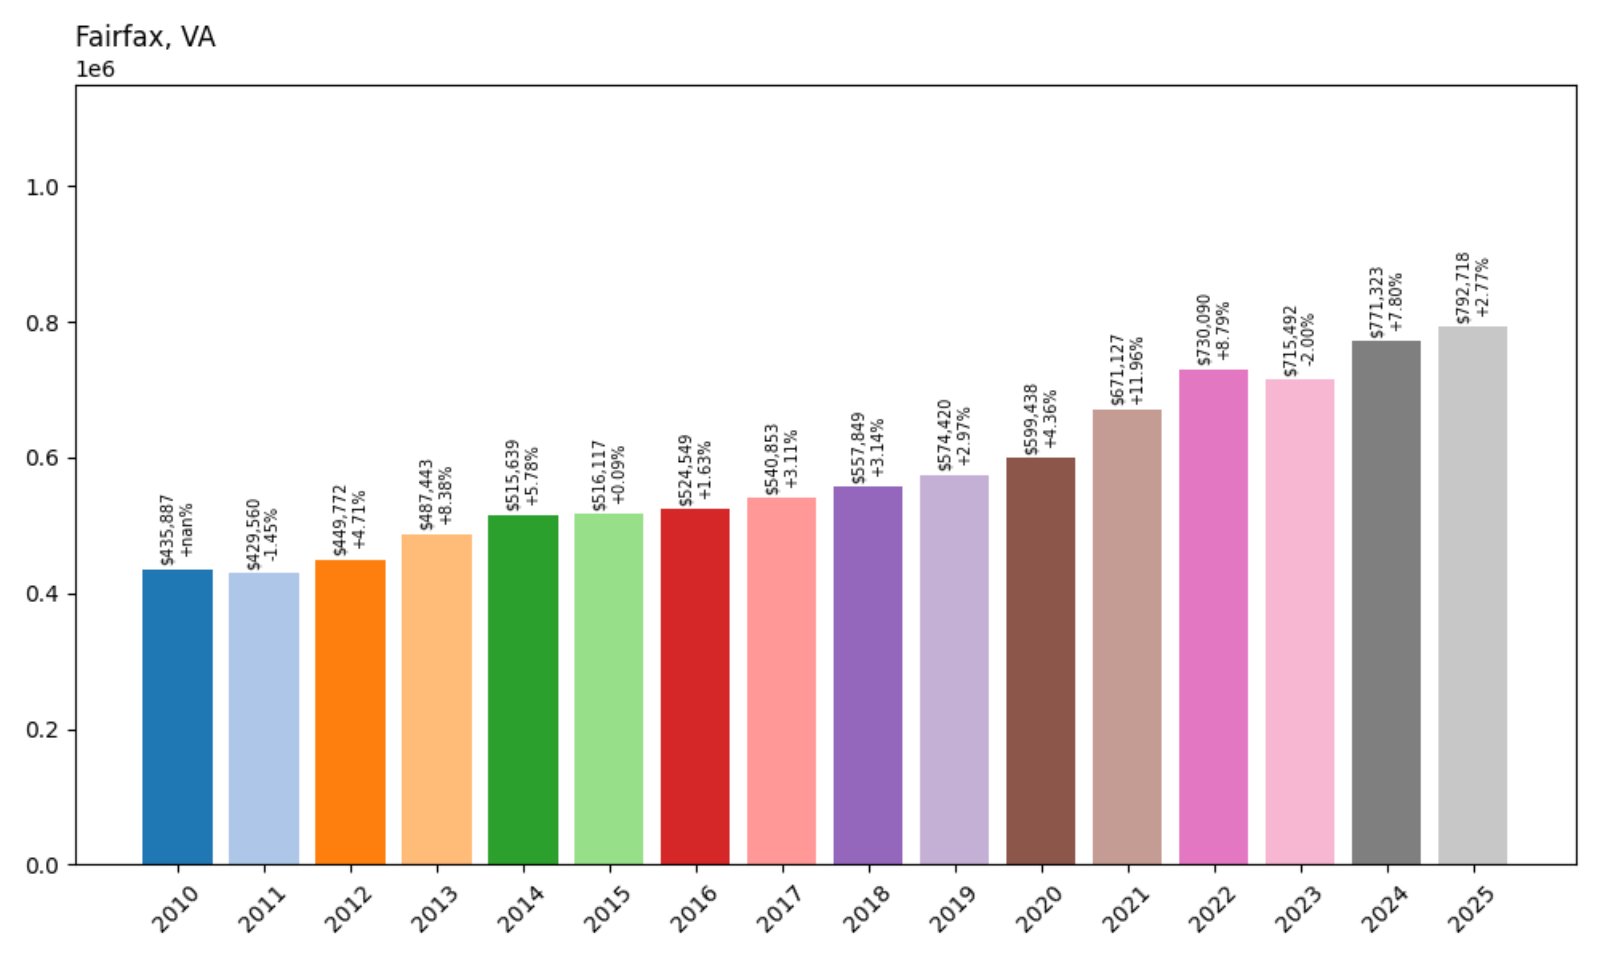
- 2010: $435,887
- 2011: $429,560 (−$6,327, −1.45%)
- 2012: $449,772 (+$20,212, +4.71%)
- 2013: $487,443 (+$37,671, +8.38%)
- 2014: $515,639 (+$28,196, +5.78%)
- 2015: $516,117 (+$478, +0.09%)
- 2016: $524,549 (+$8,433, +1.63%)
- 2017: $540,853 (+$16,303, +3.11%)
- 2018: $557,849 (+$16,996, +3.14%)
- 2019: $574,420 (+$16,571, +2.97%)
- 2020: $599,438 (+$25,018, +4.36%)
- 2021: $671,127 (+$71,689, +11.96%)
- 2022: $730,090 (+$58,963, +8.79%)
- 2023: $715,492 (−$14,598, −2.00%)
- 2024: $771,323 (+$55,831, +7.80%)
- 2025: $792,718 (+$21,395, +2.77%)
Home values in Fairfax have climbed over 81% since 2010, now approaching $793K. The city saw rapid appreciation during the pandemic years, followed by a slight dip in 2023 and a strong rebound. The upward trend reflects Fairfax’s appeal as a center of commerce, education, and accessibility in Northern Virginia.
Fairfax – Anchored by Schools, Transit, and Steady Demand
Fairfax boasts one of the region’s most central locations, along with proximity to George Mason University, top-tier public schools, and Metro access. It’s a mature market, with limited space for expansion but consistent buyer interest. While its home prices don’t skyrocket like newer luxury enclaves, Fairfax’s dependable value growth has kept it squarely among Virginia’s most expensive communities. That stability has become especially appealing in 2025 as buyers seek long-term investment value.
27. Fort Belvoir – 64.2% Home Price Increase Since 2010
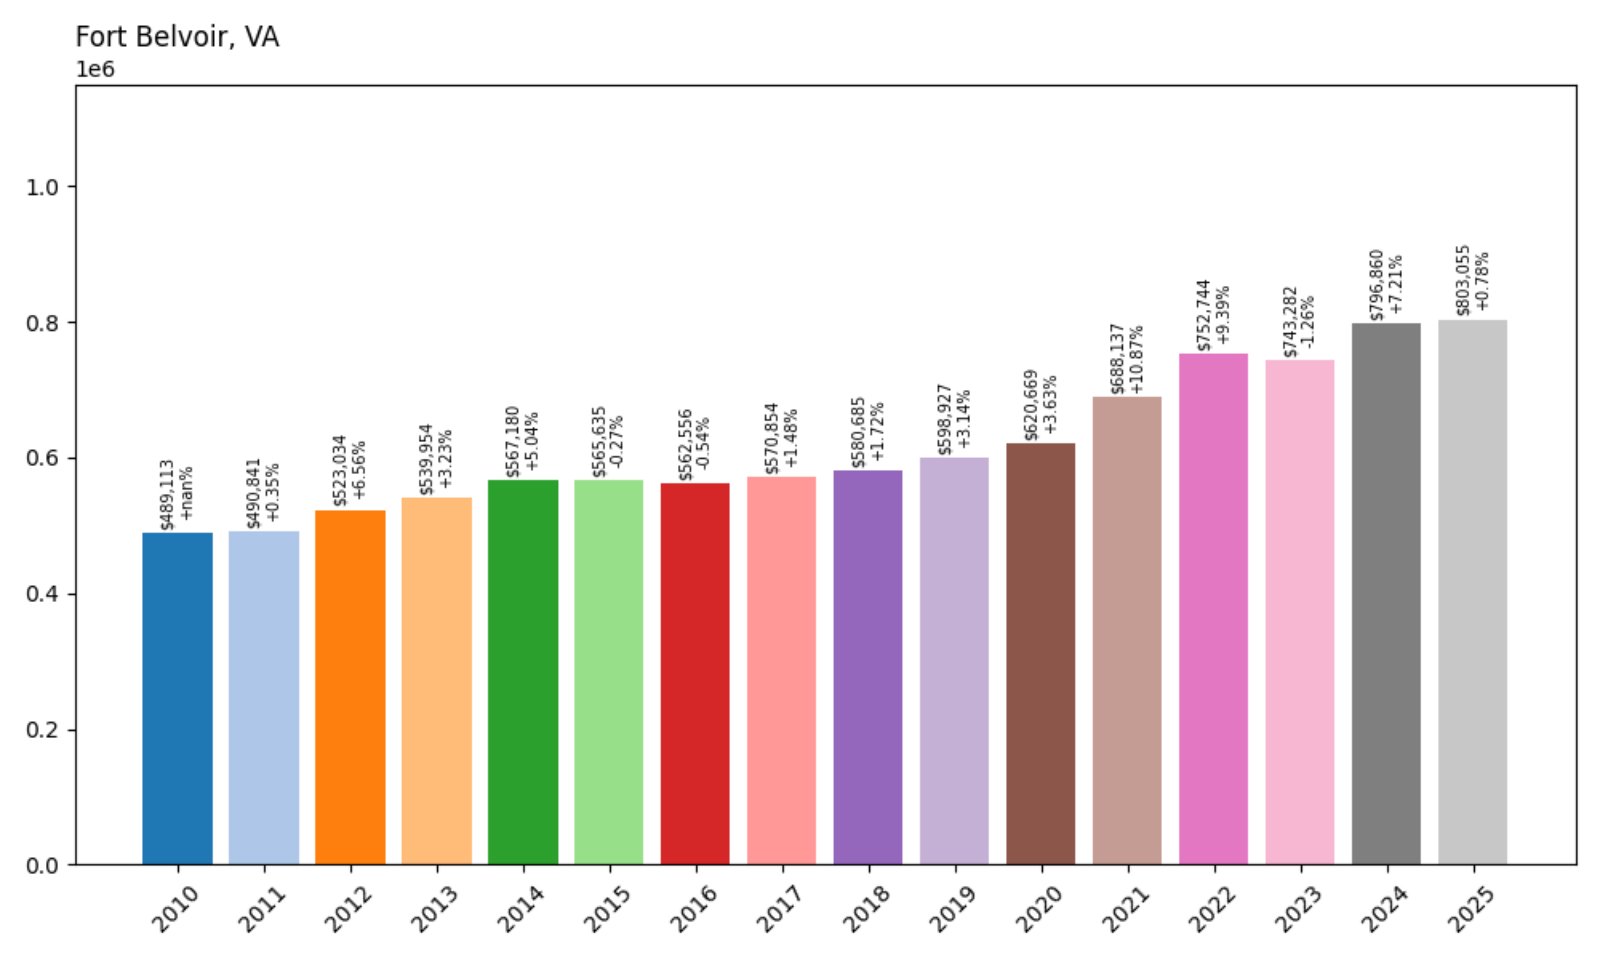
- 2010: $489,113
- 2011: $490,841 (+$1,728, +0.35%)
- 2012: $523,034 (+$32,193, +6.56%)
- 2013: $539,954 (+$16,920, +3.23%)
- 2014: $567,180 (+$27,226, +5.04%)
- 2015: $565,635 (−$1,545, −0.27%)
- 2016: $562,556 (−$3,079, −0.54%)
- 2017: $570,854 (+$8,298, +1.48%)
- 2018: $580,685 (+$9,830, +1.72%)
- 2019: $598,927 (+$18,242, +3.14%)
- 2020: $620,669 (+$21,742, +3.63%)
- 2021: $688,137 (+$67,468, +10.87%)
- 2022: $752,744 (+$64,607, +9.39%)
- 2023: $743,282 (−$9,462, −1.26%)
- 2024: $796,860 (+$53,578, +7.21%)
- 2025: $803,055 (+$6,194, +0.78%)
Fort Belvoir has seen a 64% increase in home prices since 2010, landing at just over $803K in 2025. It experienced strong growth in the early 2020s, with a brief price correction in 2023 followed by continued but slower appreciation into 2025.
Fort Belvoir – Military Roots, Market Stability
This community centers around the Fort Belvoir Army installation in Fairfax County. Housing demand here is partly driven by military personnel and defense-related workers. Fort Belvoir’s location near the Potomac River and its extensive green spaces add to the residential appeal. While turnover is higher than in most towns due to military movement, that churn helps maintain steady sales activity — and steady values. Growth may be modest now, but the market remains durable.
26. Ashburn – 94.6% Home Price Increase Since 2010

- 2010: $417,945
- 2011: $420,014 (+$2,070, +0.50%)
- 2012: $432,340 (+$12,325, +2.93%)
- 2013: $468,706 (+$36,366, +8.41%)
- 2014: $500,326 (+$31,619, +6.75%)
- 2015: $499,451 (−$875, −0.17%)
- 2016: $500,784 (+$1,333, +0.27%)
- 2017: $517,674 (+$16,890, +3.37%)
- 2018: $538,376 (+$20,703, +4.00%)
- 2019: $562,507 (+$24,130, +4.48%)
- 2020: $587,069 (+$24,562, +4.37%)
- 2021: $669,680 (+$82,611, +14.07%)
- 2022: $763,098 (+$93,418, +13.95%)
- 2023: $748,436 (−$14,661, −1.92%)
- 2024: $797,661 (+$49,225, +6.58%)
- 2025: $813,580 (+$15,919, +2.00%)
Ashburn’s home values have risen nearly 95% since 2010. From early gains in the mid-2010s to a steep rise in 2021–2022, the town’s trajectory has placed it firmly among Virginia’s most expensive housing markets, hitting $814K in 2025.
Ashburn – From Data Hubs to Desirable Homes

Located in Loudoun County, Ashburn is a major tech corridor and one of the fastest-growing suburbs in Northern Virginia. It’s home to countless data centers, master-planned communities, and the Silver Line Metro. That mix of job proximity, new construction, and infrastructure has pushed demand — and prices — sky-high. Even as market growth cools slightly, Ashburn remains one of the state’s most resilient markets for upscale buyers.
25. Haymarket – 90.0% Home Price Increase Since 2010

- 2010: $432,847
- 2011: $430,662 (−$2,185, −0.50%)
- 2012: $435,552 (+$4,890, +1.14%)
- 2013: $469,078 (+$33,526, +7.70%)
- 2014: $501,230 (+$32,153, +6.85%)
- 2015: $509,053 (+$7,823, +1.56%)
- 2016: $507,167 (−$1,886, −0.37%)
- 2017: $515,372 (+$8,204, +1.62%)
- 2018: $532,398 (+$17,026, +3.30%)
- 2019: $552,699 (+$20,302, +3.81%)
- 2020: $574,297 (+$21,598, +3.91%)
- 2021: $676,379 (+$102,082, +17.78%)
- 2022: $776,744 (+$100,364, +14.84%)
- 2023: $753,878 (−$22,865, −2.94%)
- 2024: $798,578 (+$44,700, +5.93%)
- 2025: $822,542 (+$23,963, +3.00%)
Haymarket’s home values have climbed 90% over the past 15 years, now reaching just over $822,000. While 2023 showed a mild retreat, strong gains in 2024 and continued growth in 2025 reflect the area’s lasting buyer appeal and a return to upward momentum.
Haymarket – Golf Courses, Views, and Upscale Appeal
Haymarket is tucked against the base of the Bull Run Mountains in Prince William County, offering a picturesque setting and a cluster of upscale communities like Dominion Valley. The town’s semi-rural vibe, coupled with luxury housing and access to I-66, has turned it into a go-to for affluent buyers escaping the denser suburbs. Demand surged during the pandemic as remote work made longer commutes more tolerable — and while growth has slowed, Haymarket’s reputation and amenities continue to attract buyers.
24. Chantilly – 94.5% Home Price Increase Since 2010

🔥 Would you like to save this?
- 2010: $424,444
- 2011: $417,344 (−$7,100, −1.67%)
- 2012: $435,011 (+$17,667, +4.23%)
- 2013: $465,172 (+$30,161, +6.93%)
- 2014: $495,047 (+$29,875, +6.42%)
- 2015: $494,321 (−$726, −0.15%)
- 2016: $498,869 (+$4,549, +0.92%)
- 2017: $517,500 (+$18,630, +3.73%)
- 2018: $538,949 (+$21,450, +4.14%)
- 2019: $559,850 (+$20,900, +3.88%)
- 2020: $591,498 (+$31,648, +5.65%)
- 2021: $680,283 (+$88,785, +15.01%)
- 2022: $769,466 (+$89,183, +13.11%)
- 2023: $753,580 (−$15,886, −2.06%)
- 2024: $807,054 (+$53,474, +7.10%)
- 2025: $825,559 (+$18,505, +2.29%)
Chantilly’s housing market has grown nearly 95% since 2010, reflecting the town’s desirable location and consistent buyer demand. Prices peaked during the early 2020s boom, with a minor dip in 2023, then returned to a strong upward trend into 2025.
Chantilly – Convenience and Stability Drive Demand
Chantilly offers a suburban balance of housing, shopping, and easy access to Washington Dulles International Airport. Its proximity to major employment hubs like Reston and Herndon makes it ideal for professionals seeking short commutes and solid amenities. While many communities experienced volatility during the post-pandemic slowdown, Chantilly remained stable and is again trending upward, thanks to consistent buyer interest and new construction options.
23. Arlington – 63.2% Home Price Increase Since 2010
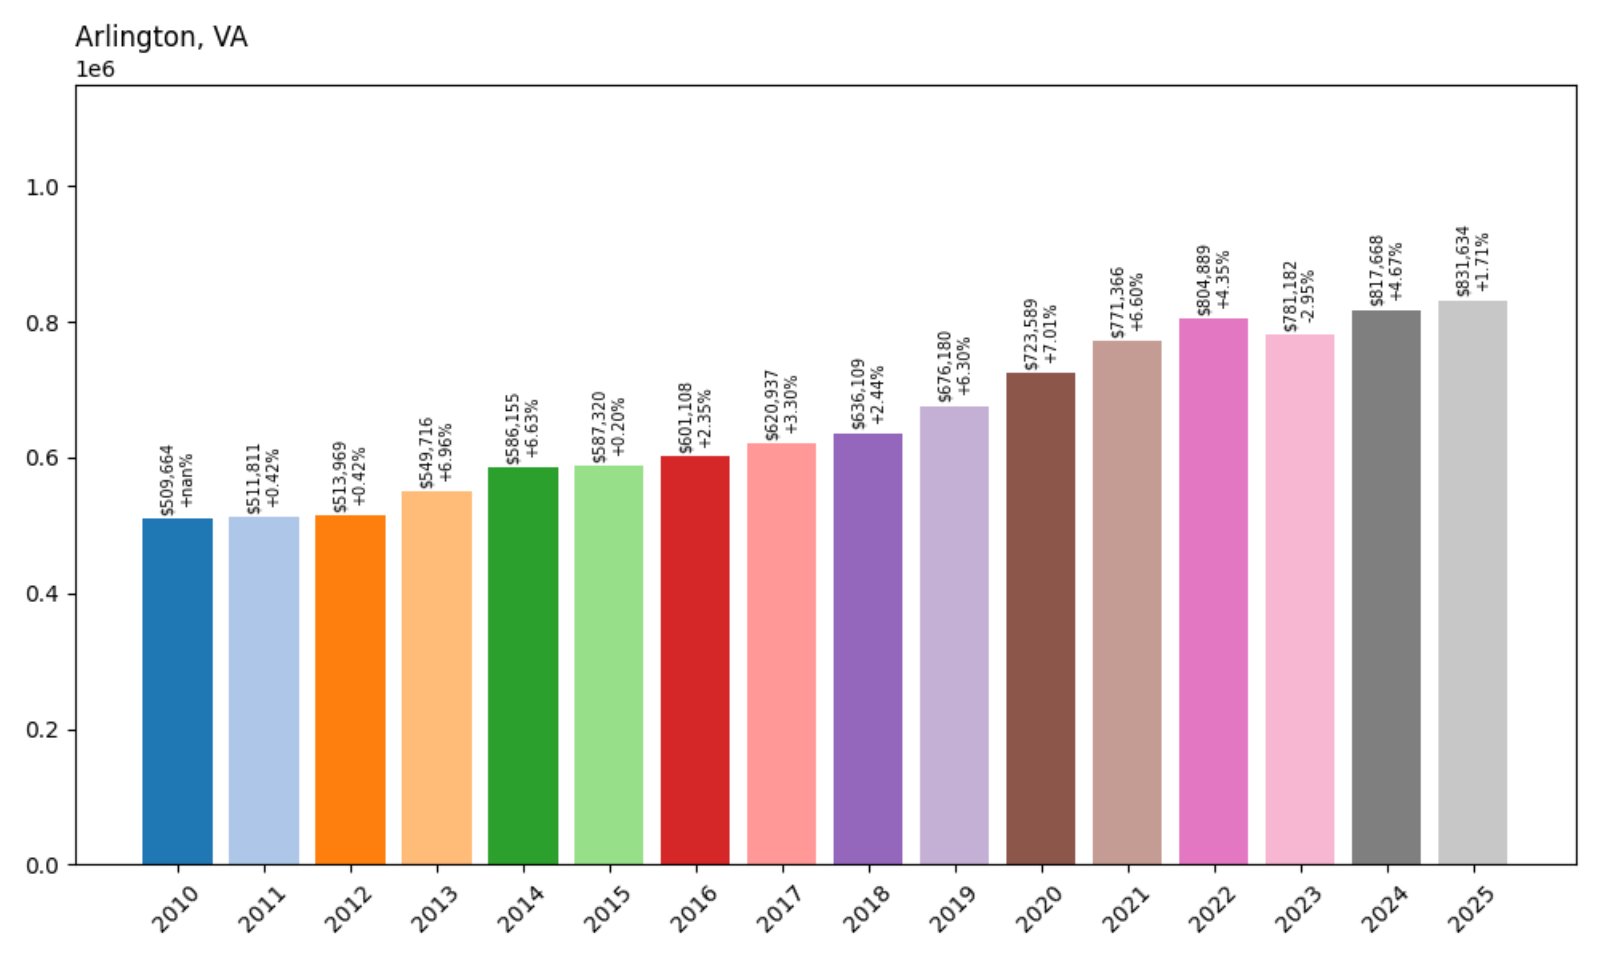
- 2010: $509,664
- 2011: $511,811 (+$2,148, +0.42%)
- 2012: $513,969 (+$2,158, +0.42%)
- 2013: $549,716 (+$35,747, +6.96%)
- 2014: $586,155 (+$36,438, +6.63%)
- 2015: $587,320 (+$1,165, +0.20%)
- 2016: $601,108 (+$13,788, +2.35%)
- 2017: $620,937 (+$19,829, +3.30%)
- 2018: $636,109 (+$15,172, +2.44%)
- 2019: $676,180 (+$40,071, +6.30%)
- 2020: $723,589 (+$47,410, +7.01%)
- 2021: $771,366 (+$47,777, +6.60%)
- 2022: $804,889 (+$33,523, +4.35%)
- 2023: $781,182 (−$23,707, −2.95%)
- 2024: $817,668 (+$36,486, +4.67%)
- 2025: $831,634 (+$13,965, +1.71%)
Arlington’s home prices have risen 63% since 2010, topping $831K in 2025. While growth here has been steadier than some of the flashier suburbs, Arlington remains a dependable high-end market with a long history of rising value.
Arlington – Urban Energy, Enduring Appeal
Arlington’s proximity to Washington, D.C., top-rated schools, and robust transit network have made it one of the region’s most sought-after communities. It blends urban conveniences with walkable neighborhoods, popular parks, and new development. Though home prices flattened briefly in 2023, the rebound in 2024 and 2025 suggests renewed buyer confidence and limited supply are again pushing values upward.
22. Union Hall – 107.4% Home Price Increase Since 2010

- 2010: $401,875
- 2011: $408,923 (+$7,048, +1.75%)
- 2012: $406,660 (−$2,263, −0.55%)
- 2013: $387,939 (−$18,721, −4.60%)
- 2014: $411,815 (+$23,877, +6.15%)
- 2015: $420,964 (+$9,148, +2.22%)
- 2016: $416,670 (−$4,294, −1.02%)
- 2017: $431,680 (+$15,010, +3.60%)
- 2018: $443,418 (+$11,738, +2.72%)
- 2019: $454,499 (+$11,081, +2.50%)
- 2020: $455,865 (+$1,366, +0.30%)
- 2021: $565,147 (+$109,282, +23.97%)
- 2022: $706,854 (+$141,707, +25.07%)
- 2023: $742,157 (+$35,303, +4.99%)
- 2024: $785,633 (+$43,476, +5.86%)
- 2025: $833,533 (+$47,901, +6.10%)
Union Hall has more than doubled in value since 2010, climbing from just over $400K to $834K in 2025. The biggest jumps occurred between 2020 and 2022, but growth has continued at a strong pace through 2025.
Union Hall – Lake Living and Rural Luxury
Located near Smith Mountain Lake in Franklin County, Union Hall combines waterfront living with privacy and scenic beauty. As one of the more remote towns on this list, it’s particularly attractive to second-home buyers and retirees. The explosive price gains of the early 2020s reflect shifting preferences toward open space and recreation — a trend that remains strong in this part of Virginia. With limited development and continued interest in lakefront property, values are expected to remain high.
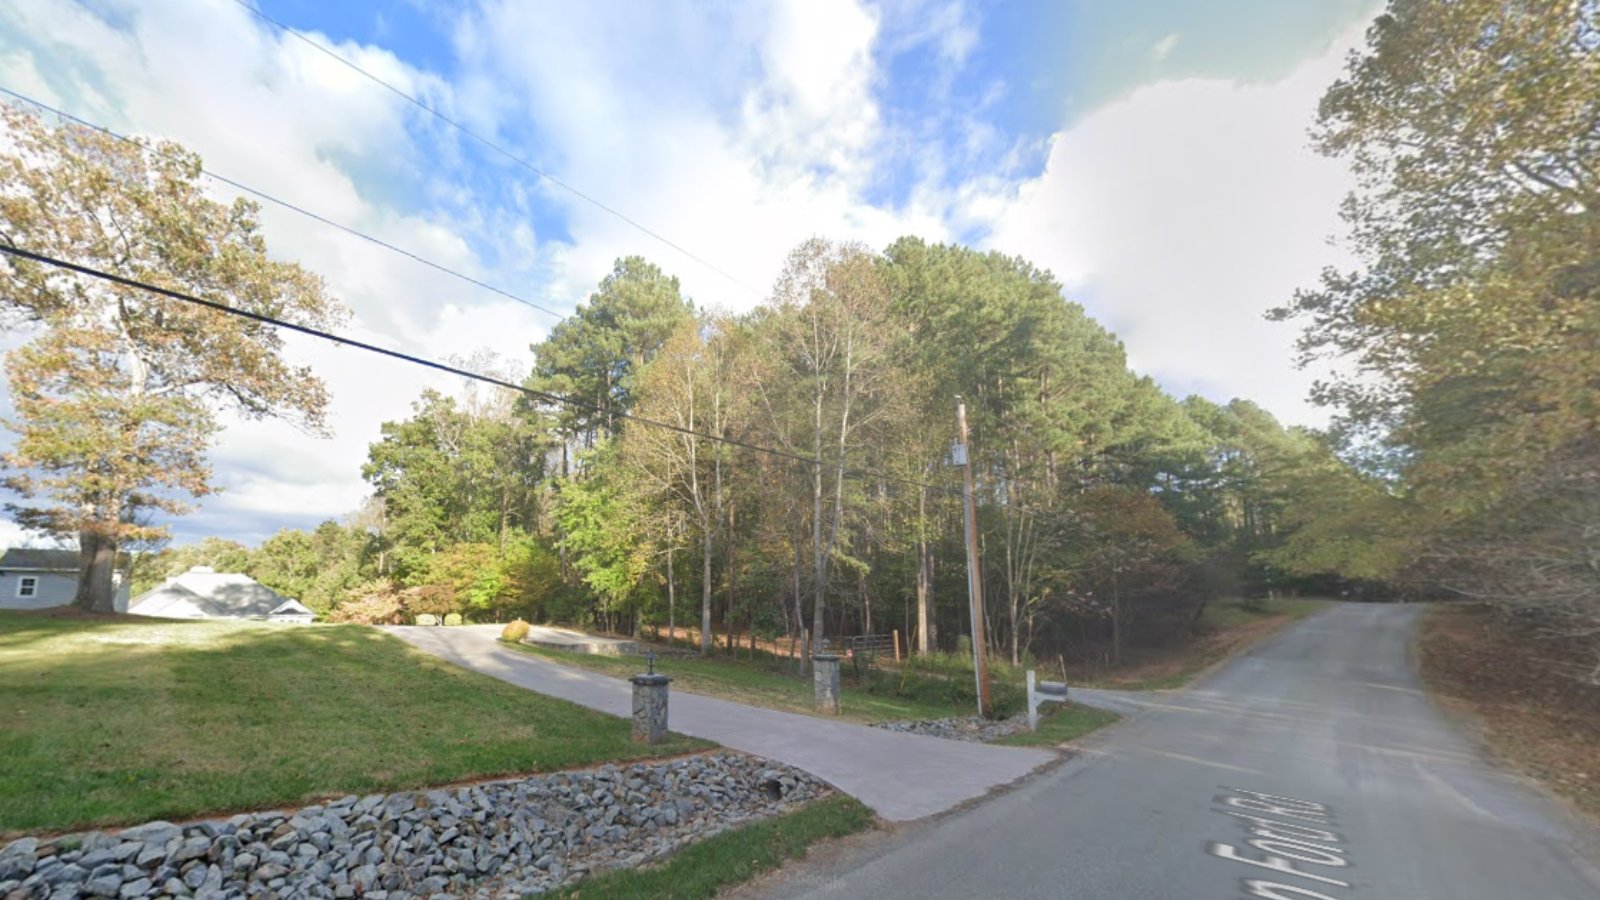
21. Round Hill – 114.3% Home Price Increase Since 2010
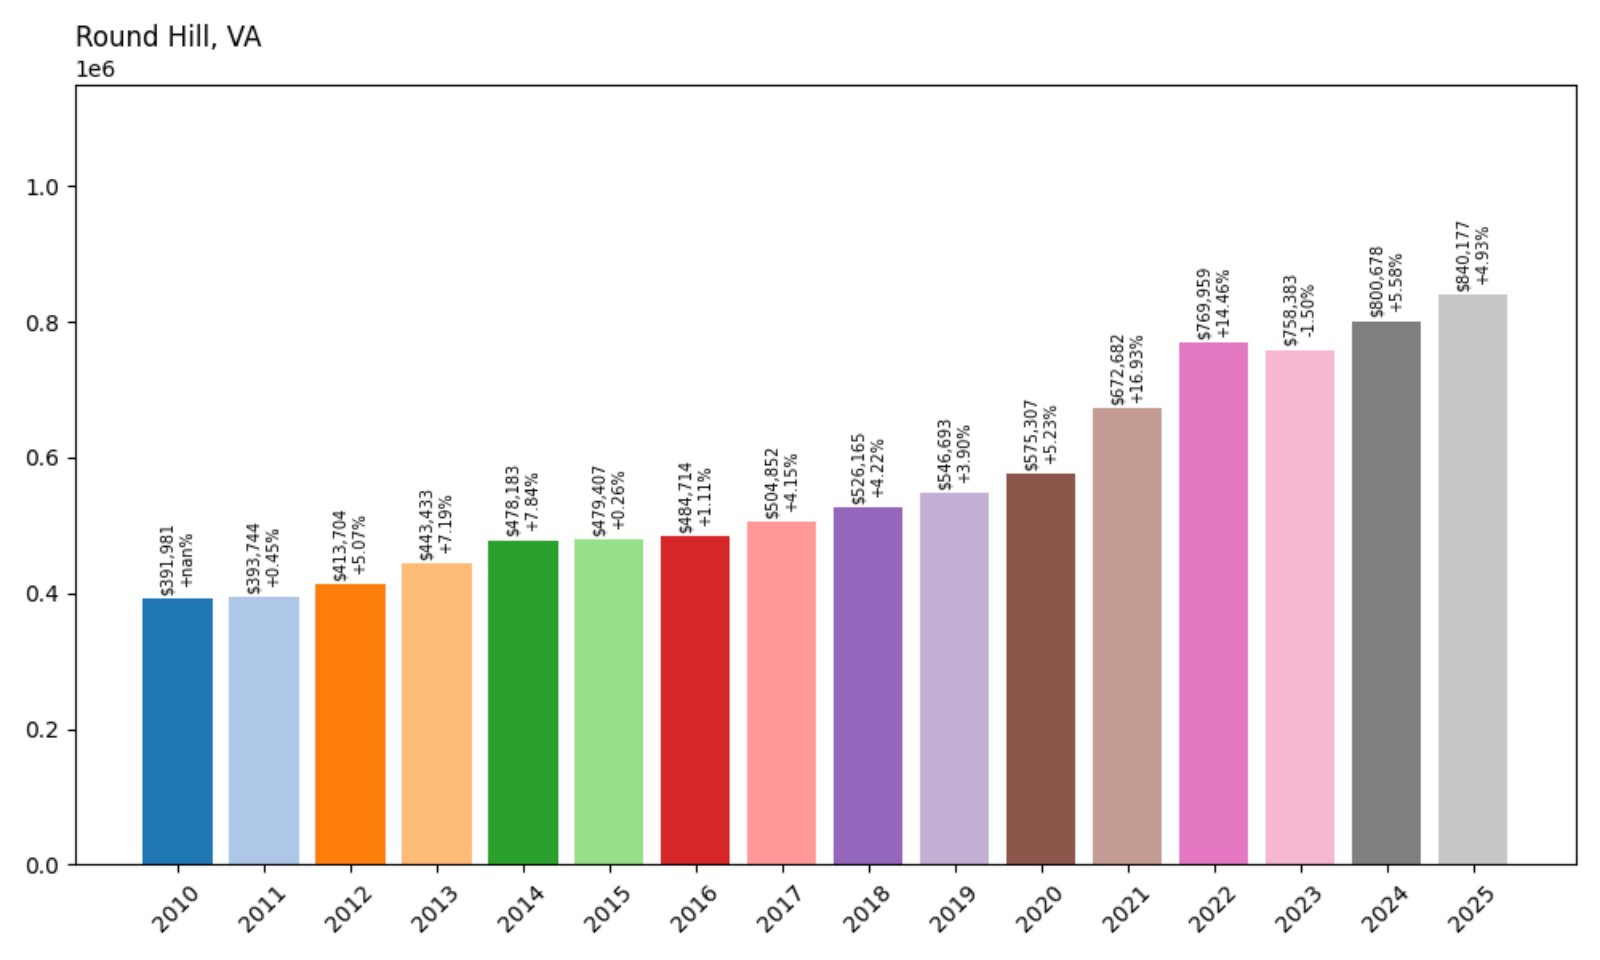
- 2010: $391,981
- 2011: $393,744 (+$1,763, +0.45%)
- 2012: $413,704 (+$19,960, +5.07%)
- 2013: $443,433 (+$29,729, +7.19%)
- 2014: $478,183 (+$34,750, +7.84%)
- 2015: $479,407 (+$1,224, +0.26%)
- 2016: $484,714 (+$5,307, +1.11%)
- 2017: $504,852 (+$20,138, +4.15%)
- 2018: $526,165 (+$21,313, +4.22%)
- 2019: $546,693 (+$20,528, +3.90%)
- 2020: $575,307 (+$28,614, +5.23%)
- 2021: $672,682 (+$97,376, +16.93%)
- 2022: $769,959 (+$97,276, +14.46%)
- 2023: $758,383 (−$11,575, −1.50%)
- 2024: $800,678 (+$42,295, +5.58%)
- 2025: $840,177 (+$39,499, +4.93%)
Round Hill’s home prices have climbed more than 114% since 2010, hitting over $840K in 2025. After a modest decline in 2023, growth bounced back with strong gains through 2024 and into this year.
Round Hill – Country Charm With Commuter Access
This small town in Loudoun County offers mountain views, quiet neighborhoods, and commuter proximity to Leesburg and the D.C. metro area. Round Hill has drawn buyers looking for a slower pace of life without giving up the convenience of Northern Virginia’s job centers. Newer subdivisions and ongoing development have helped push prices steadily upward. Its location at the edge of the region’s sprawl makes it a magnet for those seeking both value and tranquility.
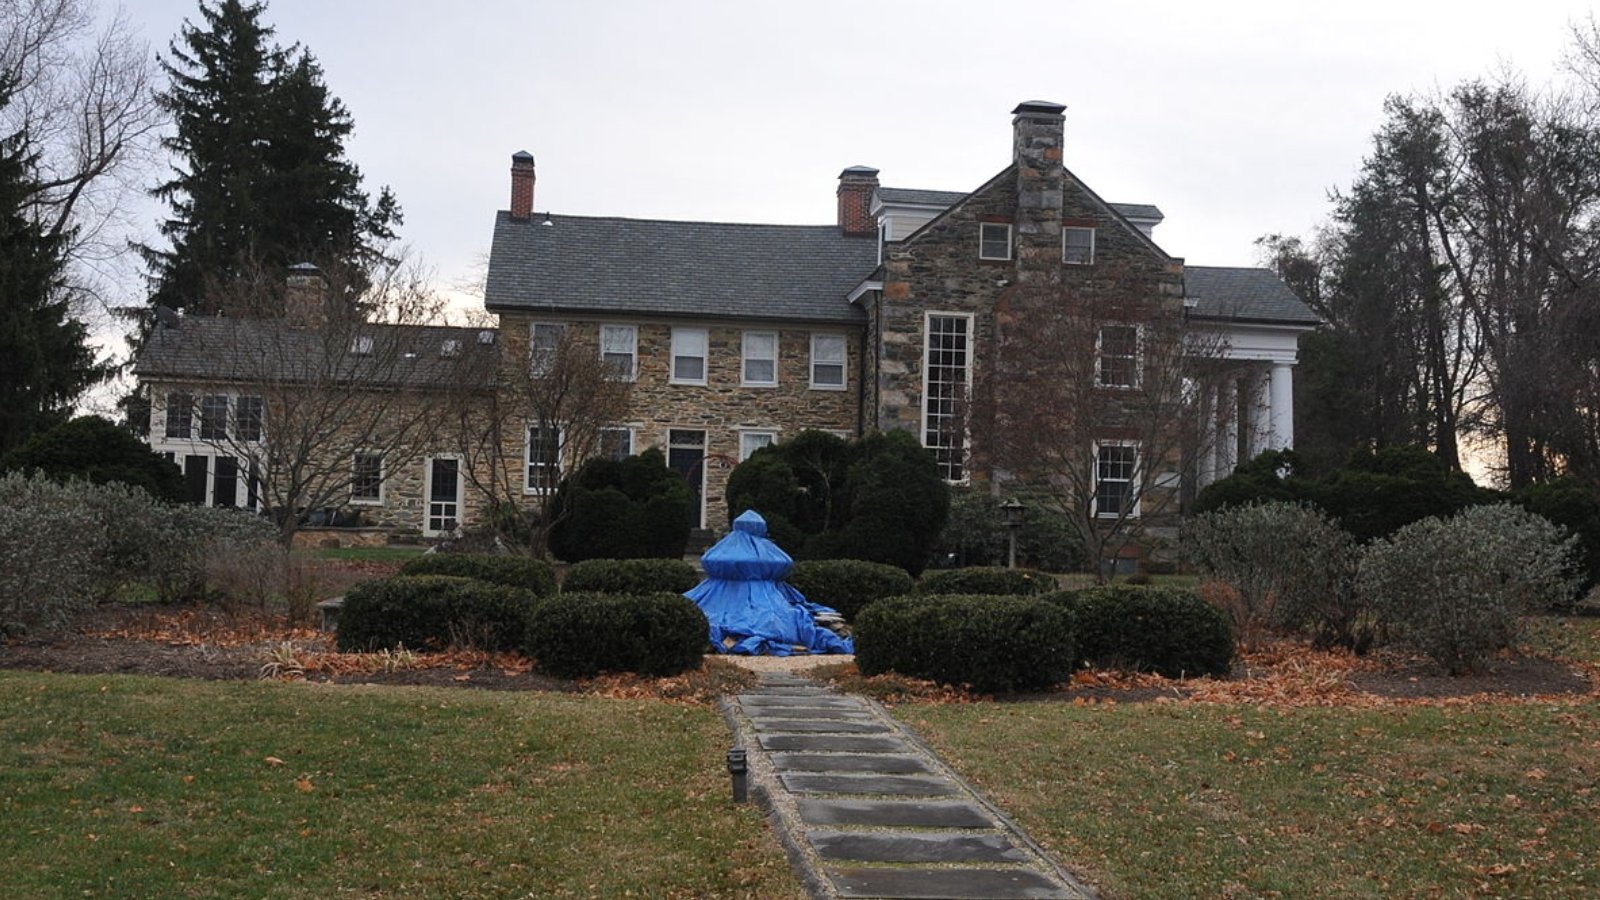
20. Hume – 92.8% Home Price Increase Since 2010
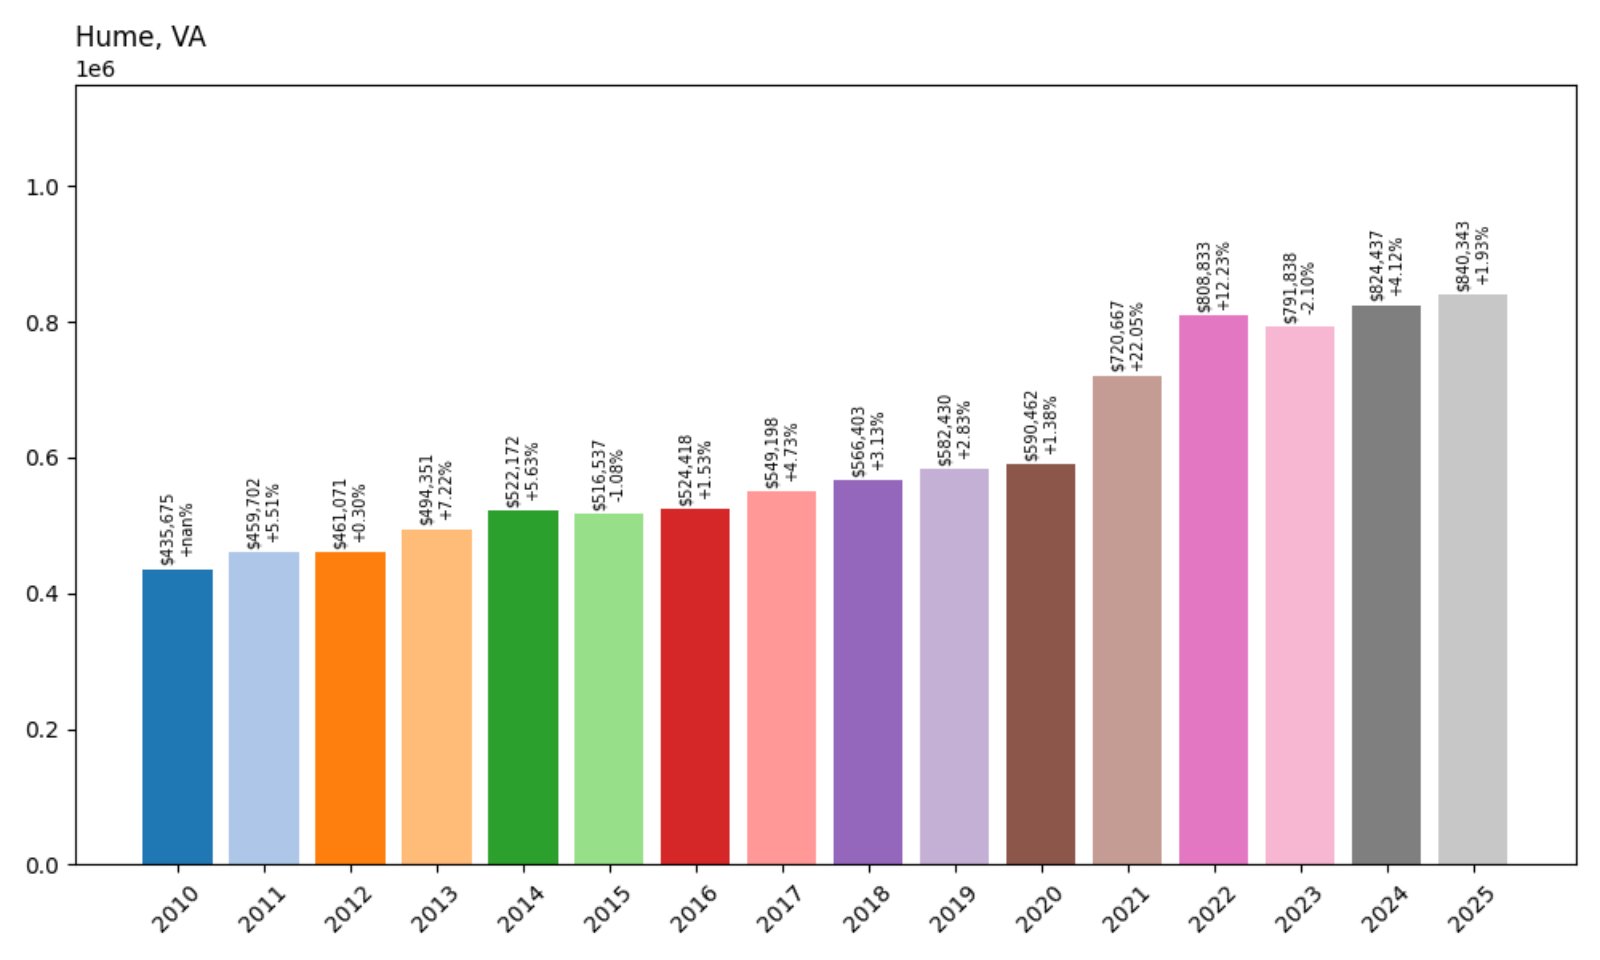
- 2010: $435,675
- 2011: $459,702 (+$24,027, +5.51%)
- 2012: $461,071 (+$1,369, +0.30%)
- 2013: $494,351 (+$33,280, +7.22%)
- 2014: $522,172 (+$27,821, +5.63%)
- 2015: $516,537 (−$5,635, −1.08%)
- 2016: $524,418 (+$7,881, +1.53%)
- 2017: $549,198 (+$24,780, +4.73%)
- 2018: $566,403 (+$17,205, +3.13%)
- 2019: $582,430 (+$16,027, +2.83%)
- 2020: $590,462 (+$8,033, +1.38%)
- 2021: $720,667 (+$130,204, +22.05%)
- 2022: $808,833 (+$88,167, +12.23%)
- 2023: $791,838 (−$16,995, −2.10%)
- 2024: $824,437 (+$32,599, +4.12%)
- 2025: $840,343 (+$15,906, +1.93%)
Hume’s home prices have surged by nearly 93% since 2010, peaking at just over $840K in 2025. The market soared between 2020 and 2022, then softened slightly before rebounding through 2024 and 2025.
Hume – Rural Beauty With Surging Appeal
Located in Fauquier County, Hume is one of Northern Virginia’s quieter upscale enclaves. Known for wineries, farmland, and Blue Ridge views, it has become increasingly popular with second-home buyers and remote workers. Its price growth over the past few years reflects that rising attention, especially during the pandemic when buyers traded city living for privacy and natural surroundings. As of 2025, Hume’s market remains one of quiet strength.
19. Leesburg – 104.0% Home Price Increase Since 2010

- 2010: $416,833
- 2011: $414,227 (−$2,605, −0.63%)
- 2012: $427,030 (+$12,802, +3.09%)
- 2013: $463,290 (+$36,261, +8.49%)
- 2014: $494,290 (+$30,999, +6.69%)
- 2015: $494,344 (+$54, +0.01%)
- 2016: $499,288 (+$4,944, +1.00%)
- 2017: $516,586 (+$17,298, +3.46%)
- 2018: $540,720 (+$24,134, +4.67%)
- 2019: $563,474 (+$22,754, +4.21%)
- 2020: $591,306 (+$27,832, +4.94%)
- 2021: $686,240 (+$94,935, +16.06%)
- 2022: $783,100 (+$96,860, +14.11%)
- 2023: $776,070 (−$7,030, −0.90%)
- 2024: $826,910 (+$50,840, +6.55%)
- 2025: $850,162 (+$23,252, +2.81%)
Leesburg’s home prices have more than doubled since 2010, passing $850K in 2025. Strong appreciation from 2020 to 2022 gave way to a brief lull, followed by another climb that has kept the town solidly in Virginia’s top 20.
Leesburg – Historic Core, High-Tech Growth
Leesburg blends small-town charm with big-time development. Its historic downtown draws weekend crowds and boutique shoppers, while its eastern edges host tech companies and new residential growth. That dual identity has made it a magnet for families and professionals alike. With strong schools, scenic routes, and a sense of community, Leesburg continues to deliver price performance year after year.
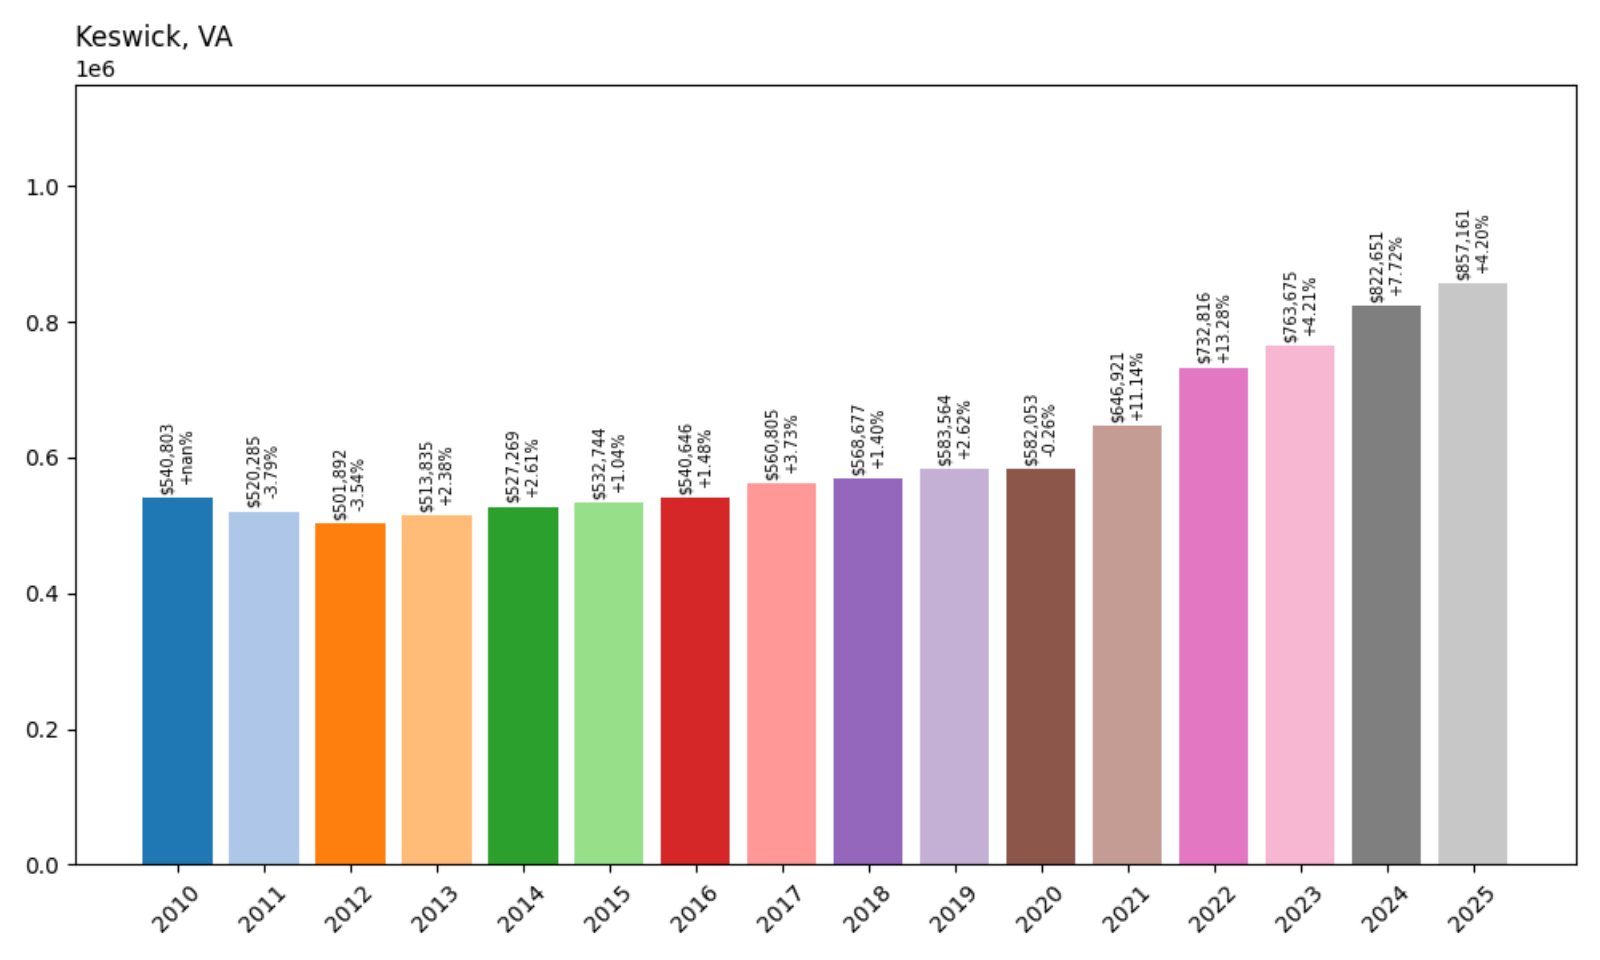
18. Keswick – 58.4% Home Price Increase Since 2010
🔥 Would you like to save this?
- 2010: $540,803
- 2011: $520,285 (−$20,519, −3.79%)
- 2012: $501,892 (−$18,393, −3.54%)
- 2013: $513,835 (+$11,943, +2.38%)
- 2014: $527,269 (+$13,434, +2.61%)
- 2015: $532,744 (+$5,475, +1.04%)
- 2016: $540,646 (+$7,902, +1.48%)
- 2017: $560,805 (+$20,158, +3.73%)
- 2018: $568,677 (+$7,873, +1.40%)
- 2019: $583,564 (+$14,887, +2.62%)
- 2020: $582,053 (−$1,511, −0.26%)
- 2021: $646,921 (+$64,868, +11.14%)
- 2022: $732,816 (+$85,895, +13.28%)
- 2023: $763,675 (+$30,859, +4.21%)
- 2024: $822,651 (+$58,976, +7.72%)
- 2025: $857,161 (+$34,510, +4.20%)
Keswick’s home prices have risen 58% since 2010, now exceeding $857K. Though growth was flat in the early years, values accelerated rapidly starting in 2020 and haven’t slowed much since.
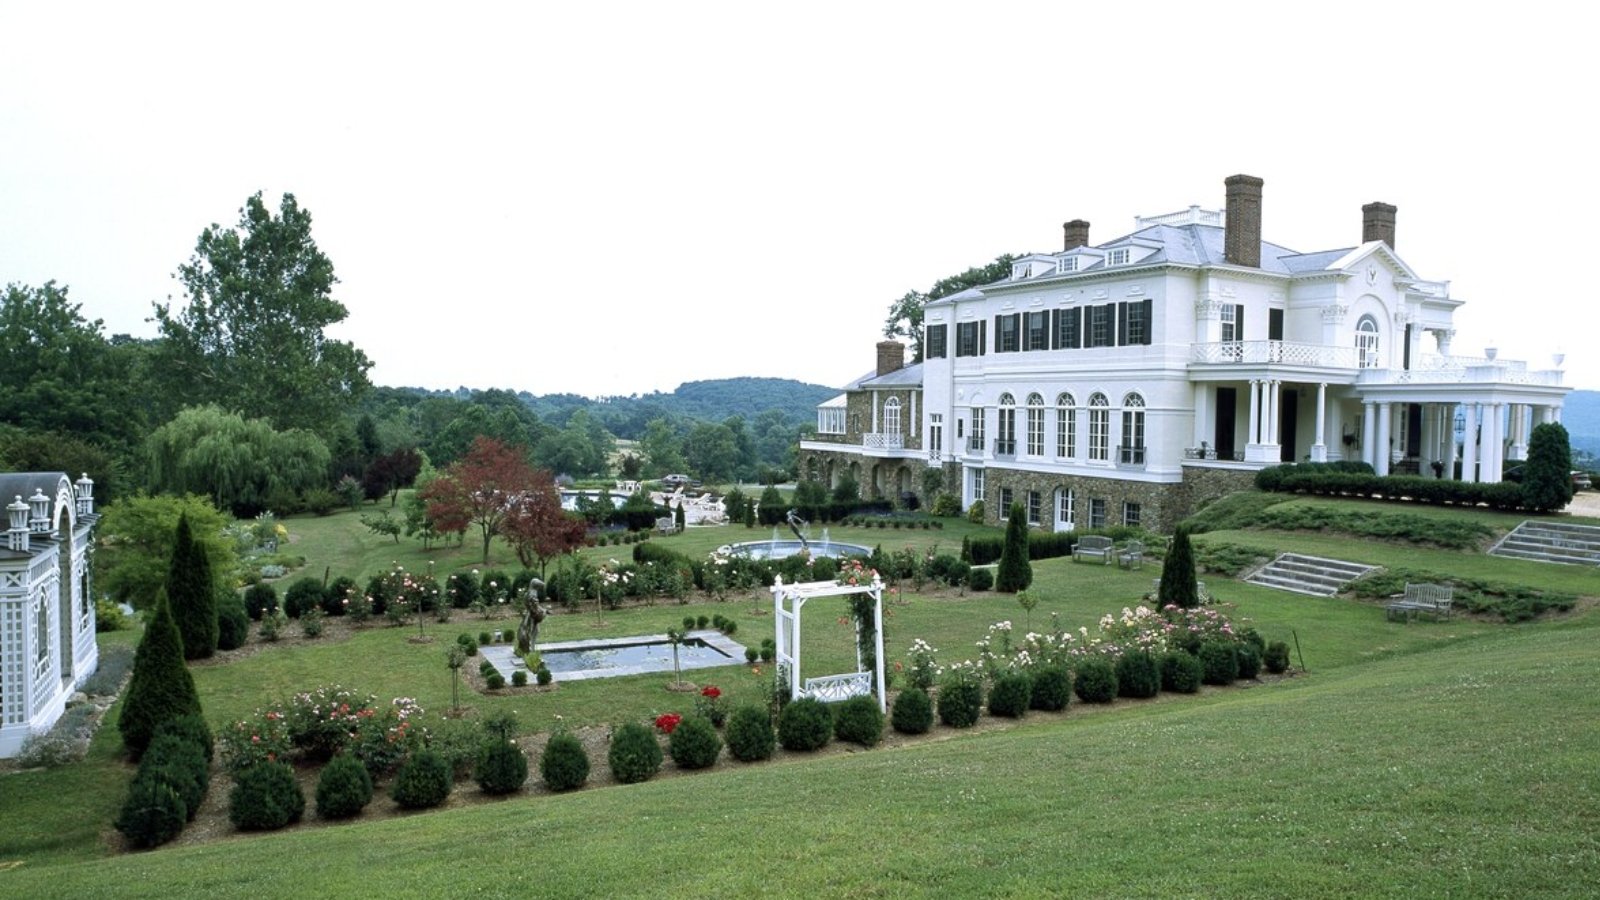
Keswick – Charlottesville’s Upscale Neighbor
Just east of Charlottesville, Keswick is known for rolling hills, equestrian estates, and one of Virginia’s most exclusive golf resorts. It’s a favored area for wealthy retirees and second-home buyers who want proximity to the University of Virginia without the bustle of town. With limited inventory and high demand, prices here are climbing steadily — and 2025 continues that trend.
17. Hamilton – 116.8% Home Price Increase Since 2010
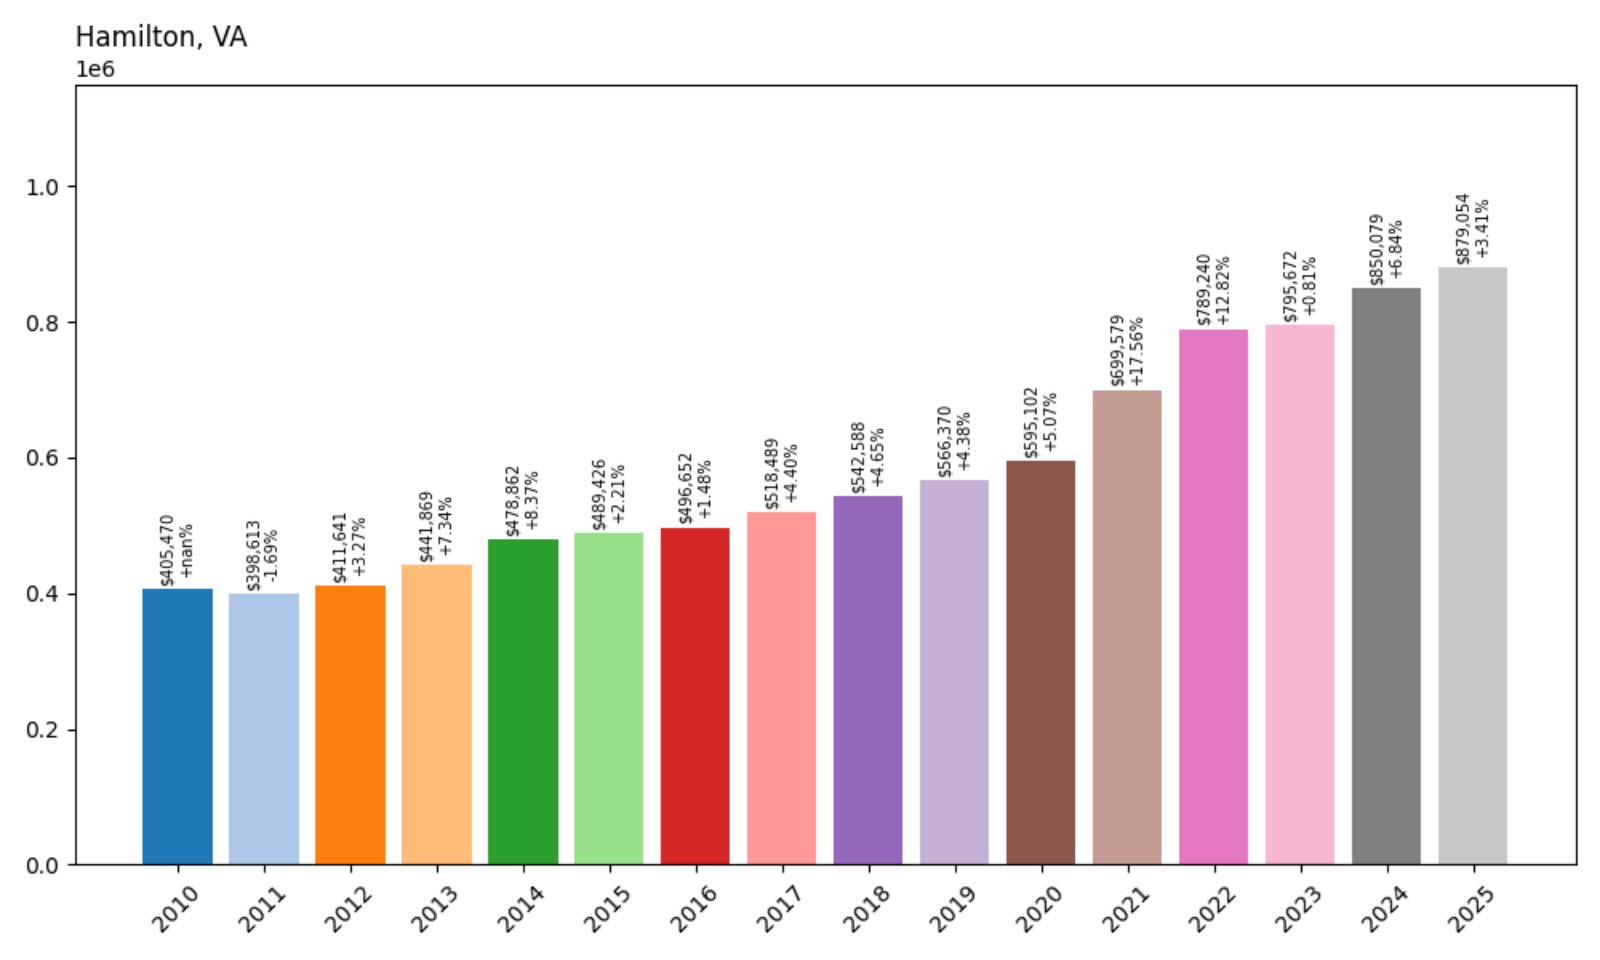
- 2010: $405,470
- 2011: $398,613 (−$6,857, −1.69%)
- 2012: $411,641 (+$13,029, +3.27%)
- 2013: $441,869 (+$30,228, +7.34%)
- 2014: $478,862 (+$36,994, +8.37%)
- 2015: $489,426 (+$10,564, +2.21%)
- 2016: $496,652 (+$7,226, +1.48%)
- 2017: $518,489 (+$21,837, +4.40%)
- 2018: $542,588 (+$24,099, +4.65%)
- 2019: $566,370 (+$23,782, +4.38%)
- 2020: $595,102 (+$28,732, +5.07%)
- 2021: $699,579 (+$104,476, +17.56%)
- 2022: $789,240 (+$89,661, +12.82%)
- 2023: $795,672 (+$6,432, +0.81%)
- 2024: $850,079 (+$54,407, +6.84%)
- 2025: $879,054 (+$28,975, +3.41%)
Hamilton’s home prices have surged by nearly 117% since 2010, now pushing $879K. Growth was steady for a decade, then exploded after 2020, as homebuyers moved west into Loudoun County in search of more space.
Hamilton – Small Town Living With Big-Time Gains
Hamilton may be small, but its location just outside Leesburg and scenic setting have made it a magnet for homebuyers seeking affordability compared to nearby Middleburg and Purcellville. As Loudoun County’s growth corridor expands, Hamilton offers charm and accessibility. With rising demand and limited inventory, price growth has outpaced expectations — and as of 2025, that upward momentum shows no signs of stopping.
16. Purcellville – 114.6% Home Price Increase Since 2010
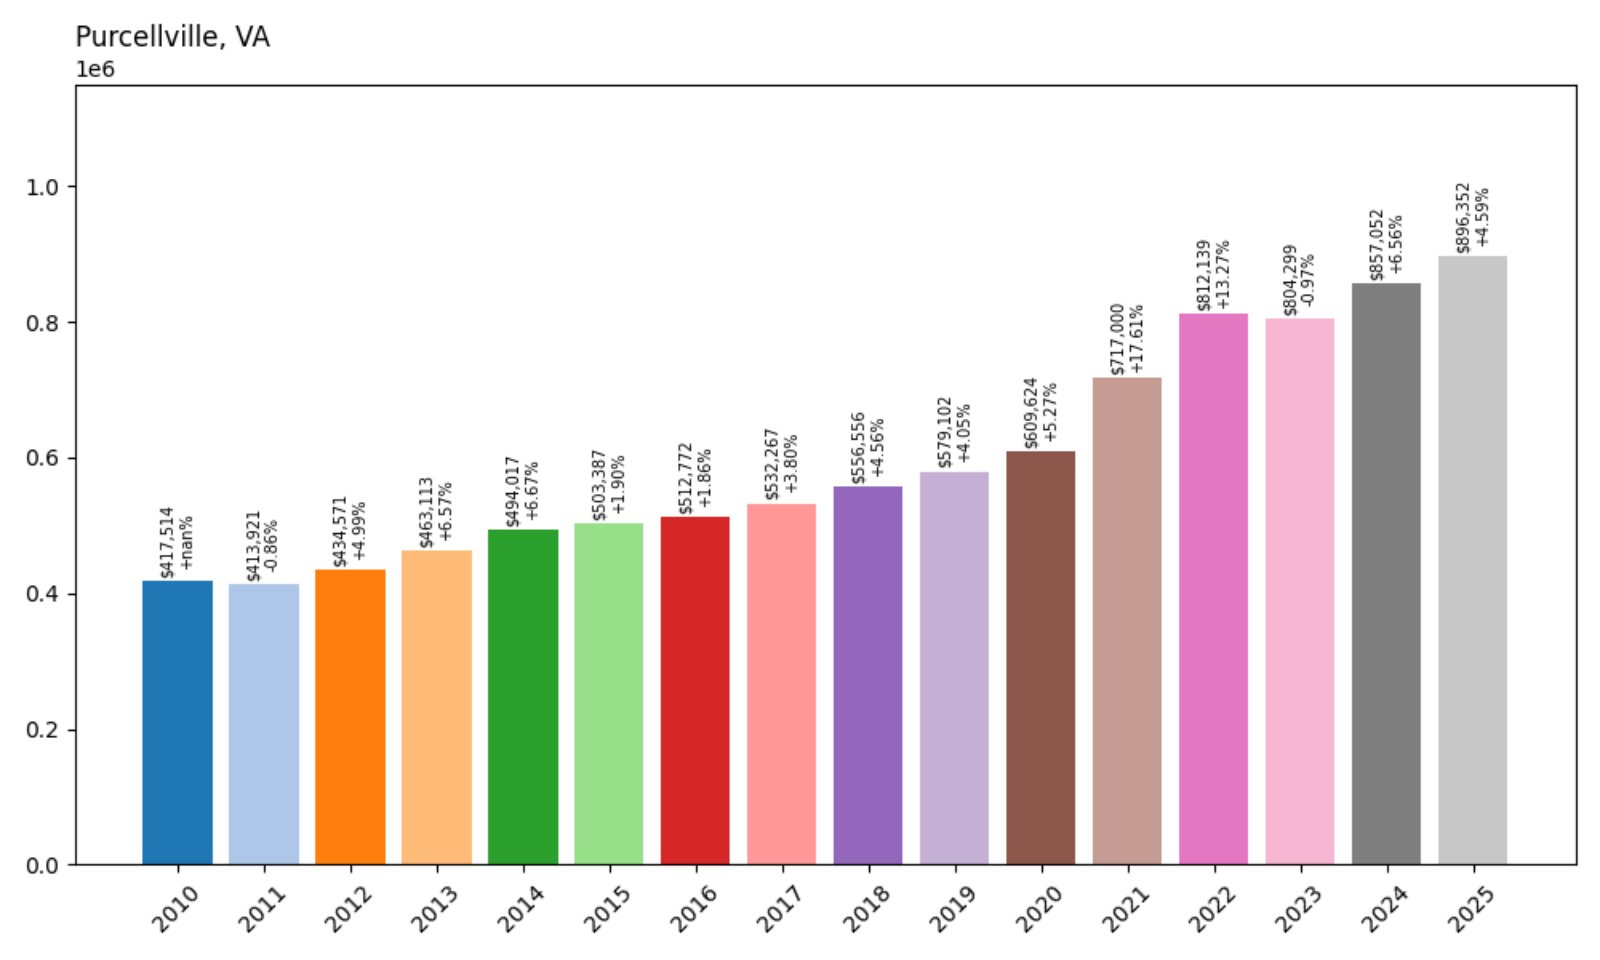
- 2010: $417,514
- 2011: $413,921 (−$3,593, −0.86%)
- 2012: $434,571 (+$20,650, +4.99%)
- 2013: $463,113 (+$28,543, +6.57%)
- 2014: $494,017 (+$30,903, +6.67%)
- 2015: $503,387 (+$9,370, +1.90%)
- 2016: $512,772 (+$9,385, +1.86%)
- 2017: $532,267 (+$19,495, +3.80%)
- 2018: $556,556 (+$24,289, +4.56%)
- 2019: $579,102 (+$22,546, +4.05%)
- 2020: $609,624 (+$30,523, +5.27%)
- 2021: $717,000 (+$107,375, +17.61%)
- 2022: $812,139 (+$95,140, +13.27%)
- 2023: $804,299 (−$7,840, −0.97%)
- 2024: $857,052 (+$52,753, +6.56%)
- 2025: $896,352 (+$39,300, +4.59%)
Purcellville has seen a 114.6% increase in home values since 2010, landing at nearly $900K in 2025. Prices soared during the pandemic years and have kept climbing with few interruptions.
Purcellville – Loudoun’s Livable Luxury Market
Known for its wineries, outdoor trails, and picturesque main street, Purcellville offers the best of western Loudoun County. It’s a favorite among families seeking excellent schools and historic charm. The town’s mix of farmland and upscale subdivisions has drawn both newcomers and long-timers, creating a resilient housing market. That’s reflected in its consistently rising prices — and its position as one of the top 20 most expensive places in Virginia this year.
15. Paeonian Springs – 13.4% Home Price Increase Since 2022
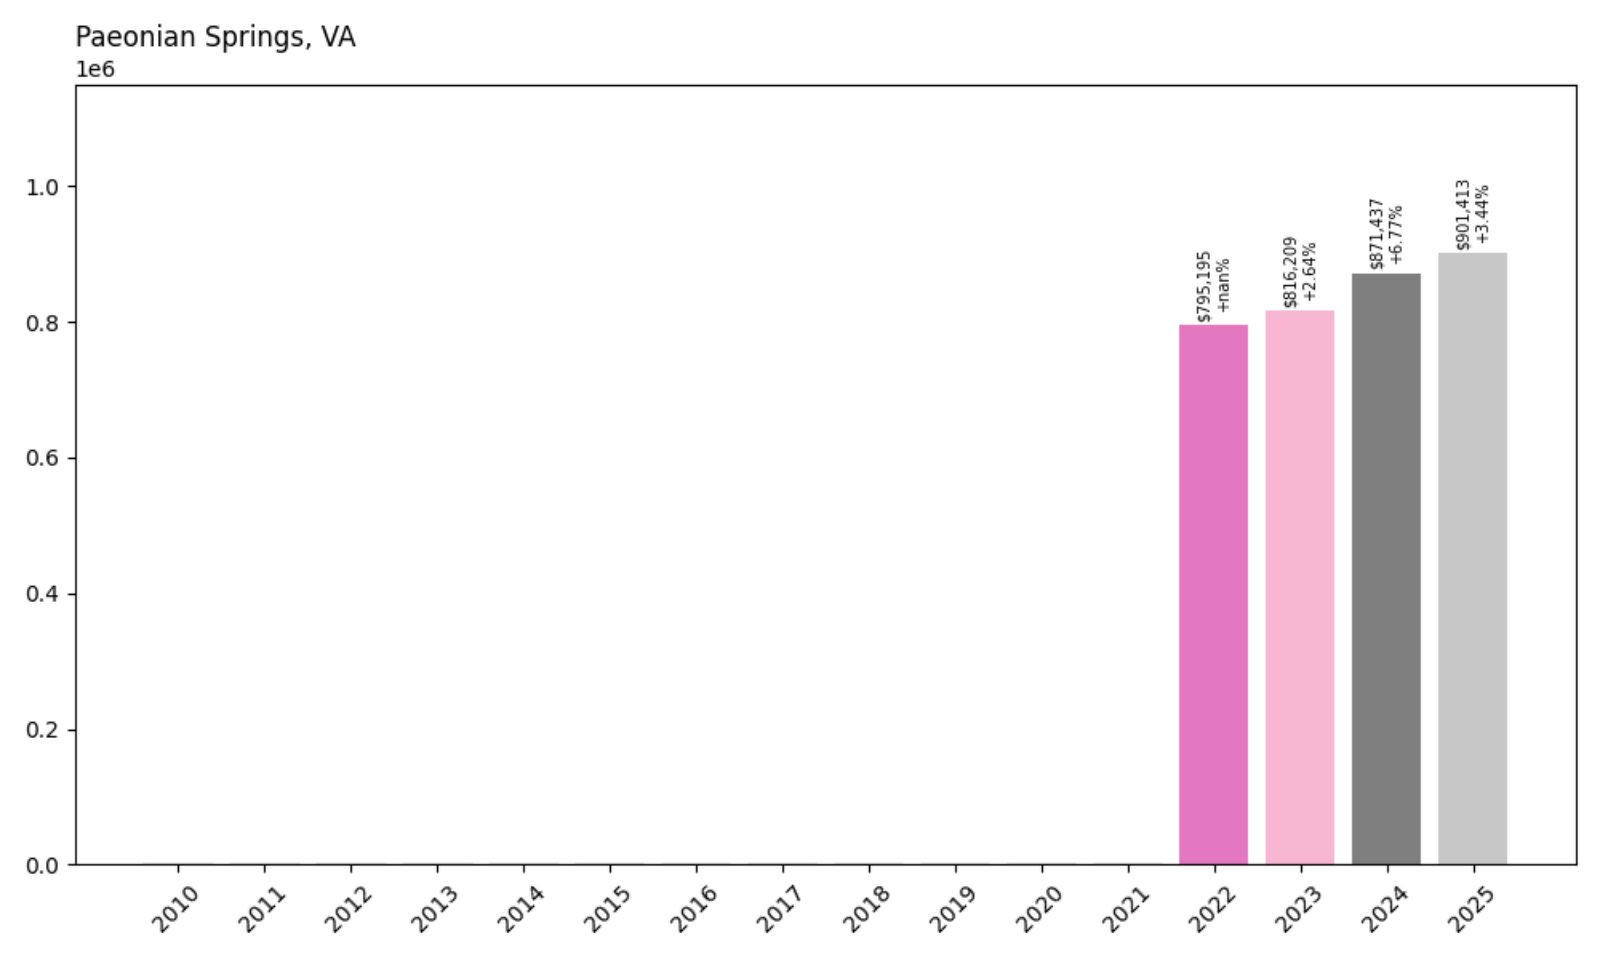
- 2022: $795,195
- 2023: $816,209 (+$21,013, +2.64%)
- 2024: $871,437 (+$55,228, +6.77%)
- 2025: $901,413 (+$29,976, +3.44%)
Though we only have data for Paeonian Springs beginning in 2022, the market has already grown by 13.4% over that short span. The area now boasts a median home price of over $901K — placing it well within Virginia’s most expensive towns by 2025.
Paeonian Springs – Exclusive, Scenic, and Rapidly Rising
Nestled in Loudoun County, Paeonian Springs is one of the smallest and most exclusive towns on this list. Its rural roads, historic architecture, and sweeping valley views make it a draw for high-end buyers looking for peace and prestige. With limited housing stock and no major commercial development, home values here are driven by rarity. Despite a lack of historical data, the recent surge in prices indicates growing attention from affluent buyers seeking something off the beaten path.
14. Delaplane – 82.8% Home Price Increase Since 2010
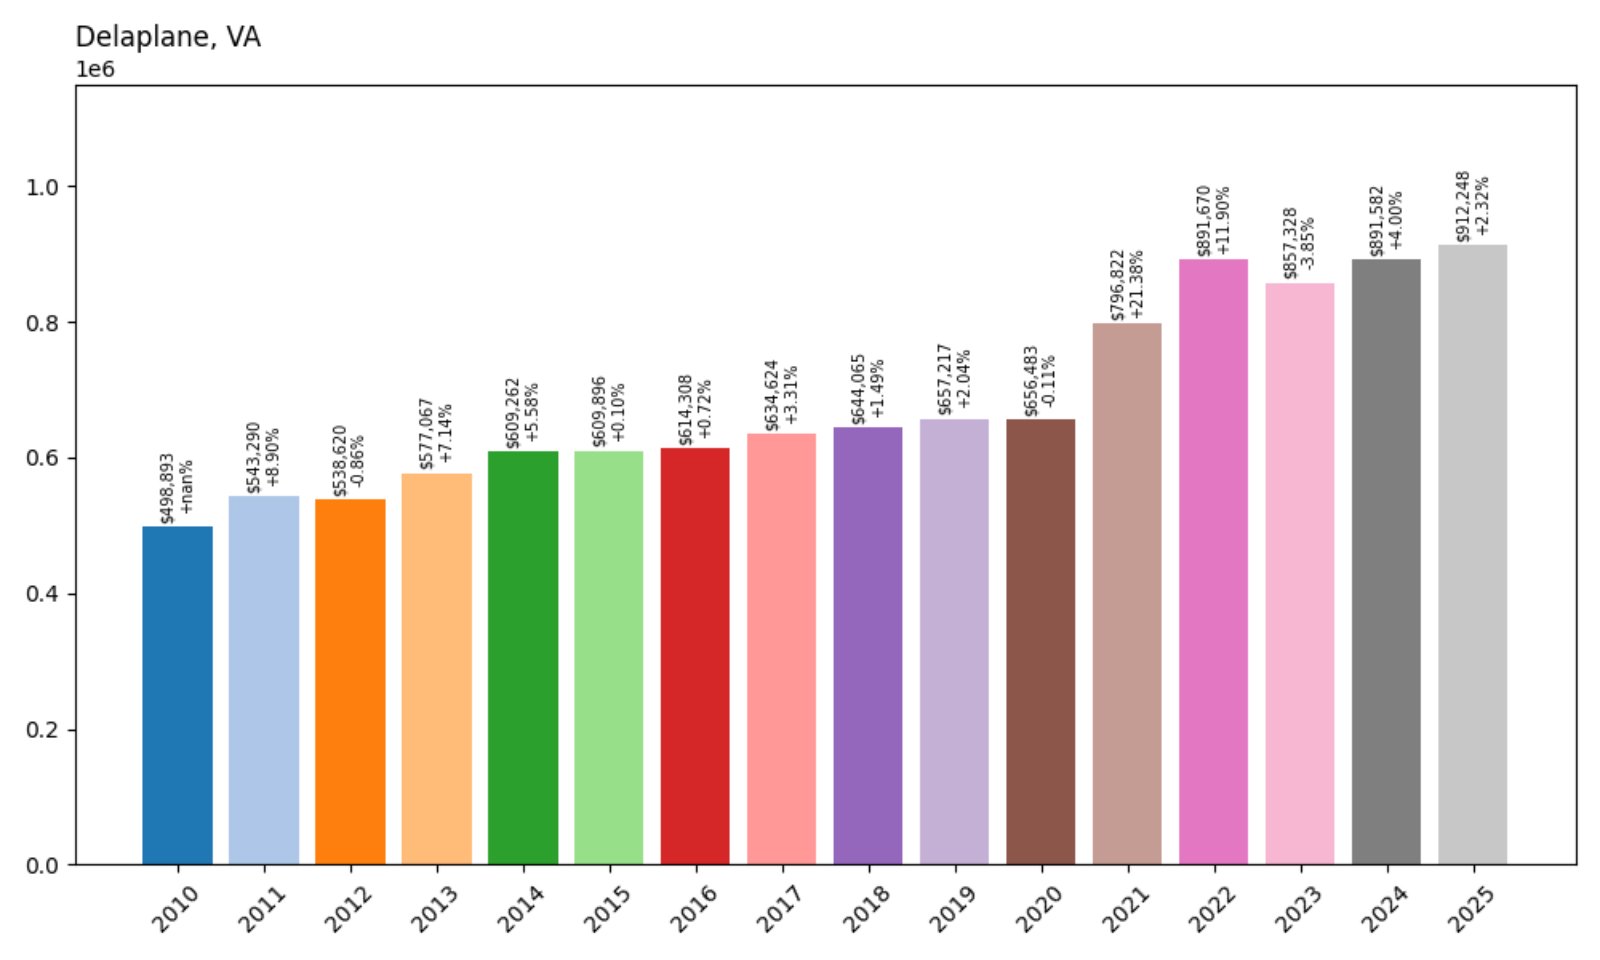
- 2010: $498,893
- 2011: $543,290 (+$44,397, +8.90%)
- 2012: $538,620 (−$4,670, −0.86%)
- 2013: $577,067 (+$38,446, +7.14%)
- 2014: $609,262 (+$32,196, +5.58%)
- 2015: $609,896 (+$633, +0.10%)
- 2016: $614,308 (+$4,412, +0.72%)
- 2017: $634,624 (+$20,317, +3.31%)
- 2018: $644,065 (+$9,440, +1.49%)
- 2019: $657,217 (+$13,152, +2.04%)
- 2020: $656,483 (−$734, −0.11%)
- 2021: $796,822 (+$140,339, +21.38%)
- 2022: $891,670 (+$94,848, +11.90%)
- 2023: $857,328 (−$34,343, −3.85%)
- 2024: $891,582 (+$34,255, +4.00%)
- 2025: $912,248 (+$20,666, +2.32%)
Home prices in Delaplane have risen more than 82% since 2010, breaking the $900K threshold in 2025. The area saw standout growth between 2020 and 2022 and has continued a gentler upward trend since.
Delaplane – Vineyards, Vistas, and Value
🔥 Would you like to save this?
Set along U.S. Route 17 in Fauquier County, Delaplane offers a mix of rolling countryside, boutique wineries, and hidden estates. It’s part of Virginia’s wine country and a popular destination for weekenders from D.C. The housing stock here tends to be older, larger, and more secluded, helping drive higher price tags. Buyers looking for luxury without the noise of development often land here — and the market’s appreciation over the last five years reflects that demand.
13. The Plains – 104.3% Home Price Increase Since 2010
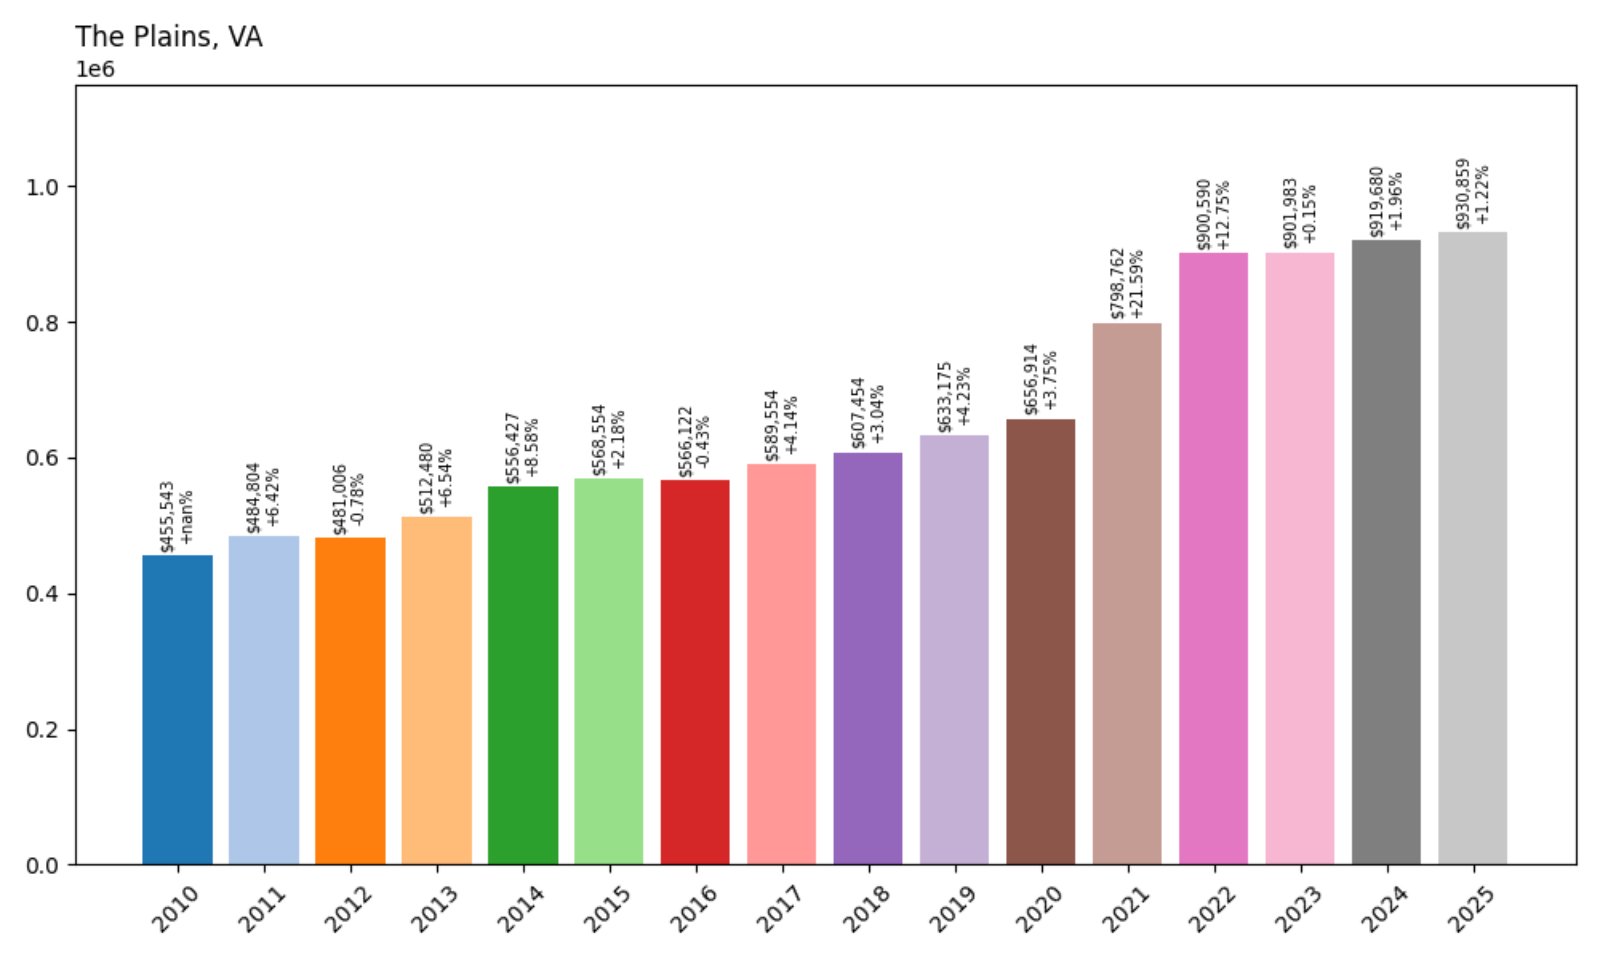
- 2010: $455,543
- 2011: $484,804 (+$29,261, +6.42%)
- 2012: $481,006 (−$3,798, −0.78%)
- 2013: $512,480 (+$31,474, +6.54%)
- 2014: $556,427 (+$43,947, +8.58%)
- 2015: $568,554 (+$12,127, +2.18%)
- 2016: $566,122 (−$2,433, −0.43%)
- 2017: $589,554 (+$23,432, +4.14%)
- 2018: $607,454 (+$17,900, +3.04%)
- 2019: $633,175 (+$25,721, +4.23%)
- 2020: $656,914 (+$23,738, +3.75%)
- 2021: $798,762 (+$141,848, +21.59%)
- 2022: $900,590 (+$101,828, +12.75%)
- 2023: $901,983 (+$1,393, +0.15%)
- 2024: $919,680 (+$17,698, +1.96%)
- 2025: $930,859 (+$11,179, +1.22%)
The Plains has more than doubled in value since 2010, rising from the mid-$450Ks to over $930K in 2025. It saw particularly sharp appreciation between 2020 and 2022, with steady if slower growth since.
The Plains – Quiet Luxury in Hunt Country
The Plains is classic Middleburg hunt country — an area where open space, polo fields, and grand estates dominate. Located in Fauquier County, it appeals to both horse lovers and city escapees. While its population is small, the real estate carries significant value due to lot sizes, privacy, and scarcity. With zoning limiting development, prices in The Plains have a built-in floor — and the market’s performance since 2020 confirms its elite status.
12. Fort Hunt – 61.3% Home Price Increase Since 2010

- 2010: $621,577
- 2011: $612,132 (−$9,445, −1.52%)
- 2012: $627,412 (+$15,281, +2.50%)
- 2013: $664,074 (+$36,662, +5.84%)
- 2014: $688,821 (+$24,747, +3.73%)
- 2015: $683,445 (−$5,376, −0.78%)
- 2016: $686,464 (+$3,019, +0.44%)
- 2017: $706,183 (+$19,720, +2.87%)
- 2018: $724,974 (+$18,791, +2.66%)
- 2019: $743,898 (+$18,924, +2.61%)
- 2020: $771,446 (+$27,547, +3.70%)
- 2021: $886,122 (+$114,676, +14.87%)
- 2022: $963,178 (+$77,056, +8.70%)
- 2023: $935,872 (−$27,306, −2.84%)
- 2024: $985,397 (+$49,526, +5.29%)
- 2025: $1,002,372 (+$16,974, +1.72%)
Fort Hunt’s home prices are up more than 61% since 2010, crossing the $1 million mark in 2025. Though growth has moderated, demand for this leafy D.C. suburb has remained strong.
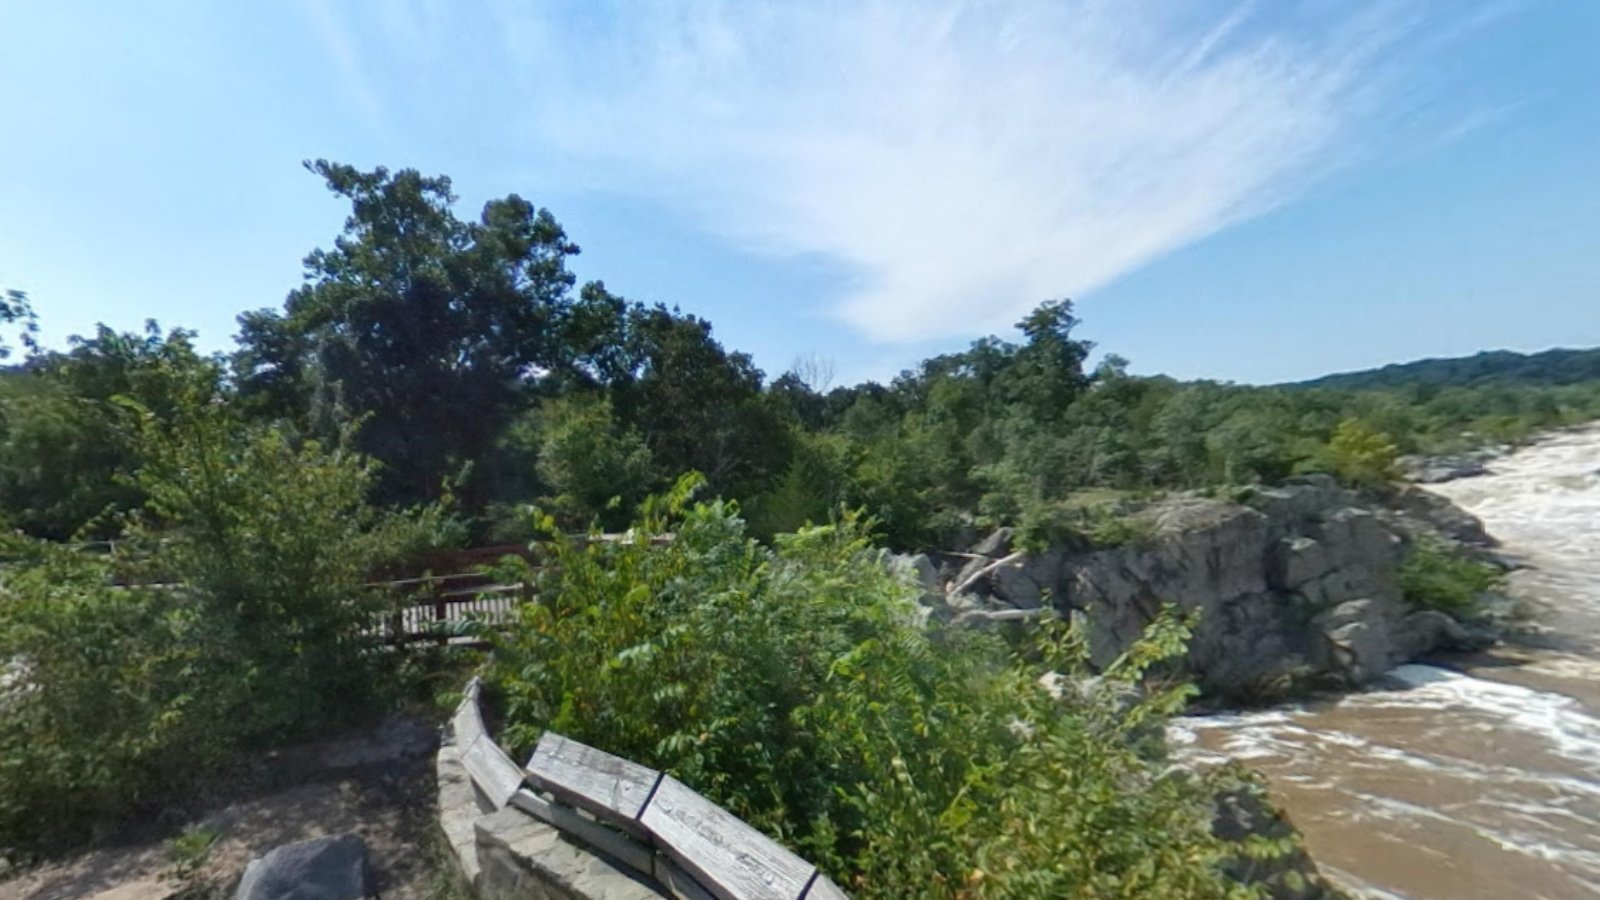
Fort Hunt – Close-In Comfort With Classic Suburban Appeal

Located along the Potomac River in Fairfax County, Fort Hunt offers mature neighborhoods, excellent schools, and easy access to both Old Town Alexandria and D.C. Its mix of mid-century homes and upscale renovations makes it popular among families and professionals alike. While not a flashy market, Fort Hunt’s values are remarkably stable — and 2025 marks a major milestone with median prices finally reaching seven figures.
11. Clifton – 72.5% Home Price Increase Since 2010
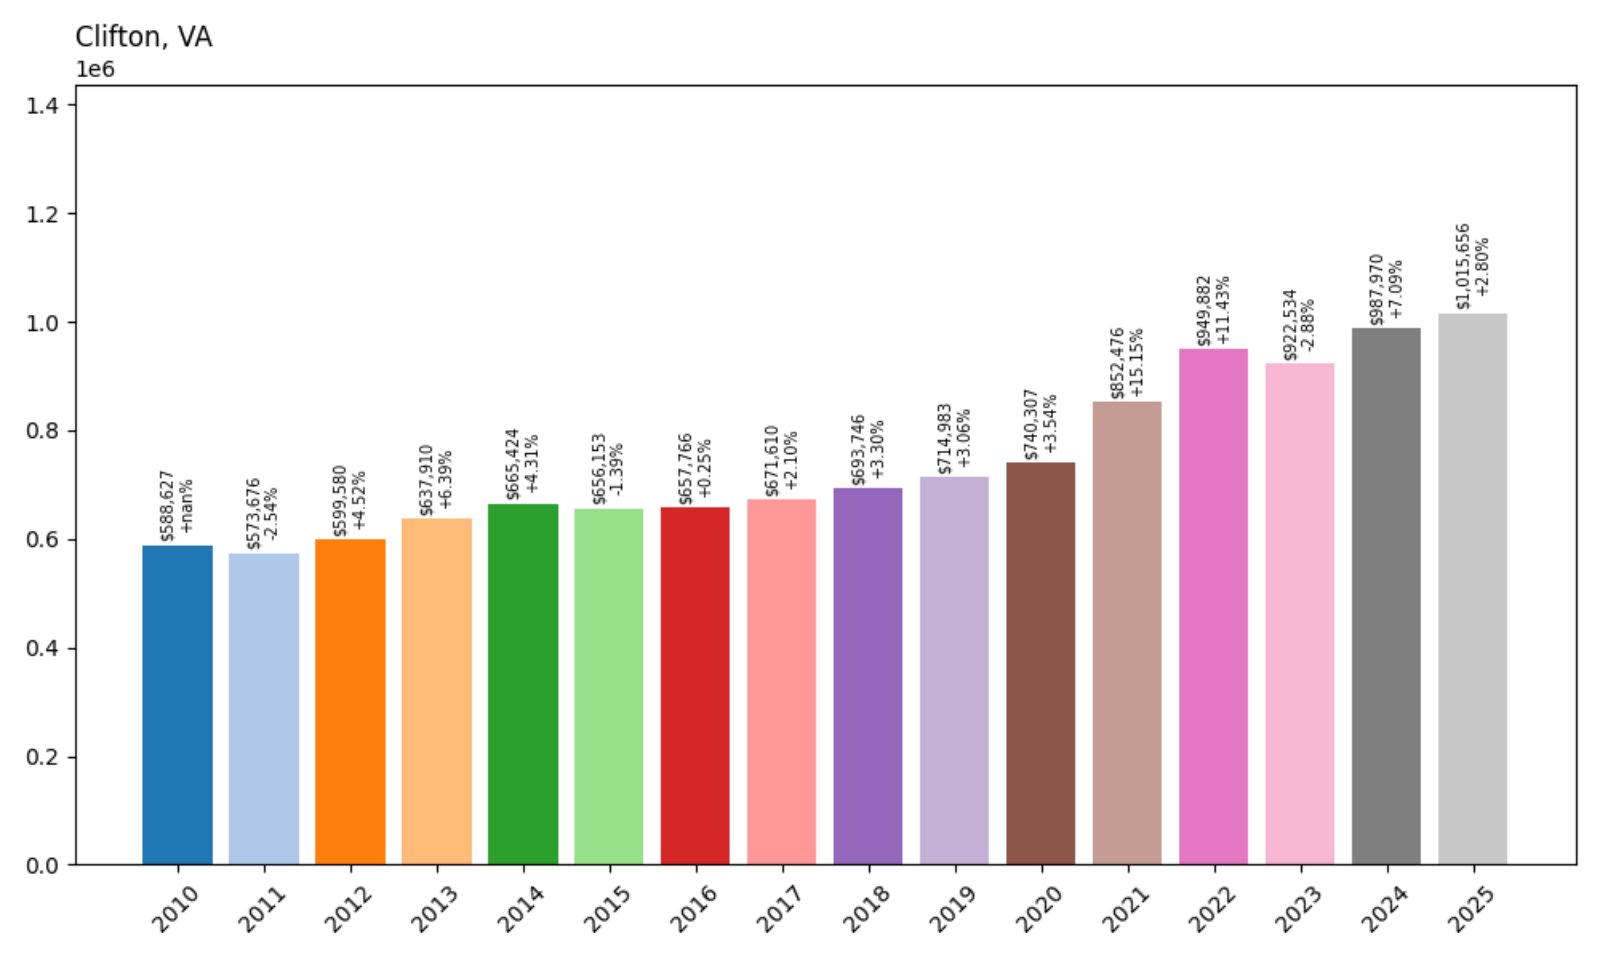
- 2010: $588,627
- 2011: $573,676 (−$14,951, −2.54%)
- 2012: $599,580 (+$25,904, +4.52%)
- 2013: $637,910 (+$38,330, +6.39%)
- 2014: $665,424 (+$27,514, +4.31%)
- 2015: $656,153 (−$9,270, −1.39%)
- 2016: $657,766 (+$1,613, +0.25%)
- 2017: $671,610 (+$13,844, +2.10%)
- 2018: $693,746 (+$22,137, +3.30%)
- 2019: $714,983 (+$21,237, +3.06%)
- 2020: $740,307 (+$25,324, +3.54%)
- 2021: $852,476 (+$112,168, +15.15%)
- 2022: $949,882 (+$97,406, +11.43%)
- 2023: $922,534 (−$27,348, −2.88%)
- 2024: $987,970 (+$65,436, +7.09%)
- 2025: $1,015,656 (+$27,685, +2.80%)
Clifton has posted a 72.5% rise in home prices since 2010, reaching $1.02 million in 2025. Gains accelerated in the early 2020s and have continued at a steady clip despite a slight dip in 2023.
Clifton – Wooded Lots and Million-Dollar Tranquility
With its winding roads and thickly wooded lots, Clifton feels like a retreat despite being just 25 miles from D.C. This Fairfax County town offers a mix of historic homes, custom estates, and a small-town vibe that’s rare in Northern Virginia. That quiet luxury — combined with limited development — has fueled rising demand and prices. As of this year, Clifton is one of a growing number of Virginia towns where the typical home fetches over a million dollars.
10. Catharpin – 92.7% Home Price Increase Since 2010
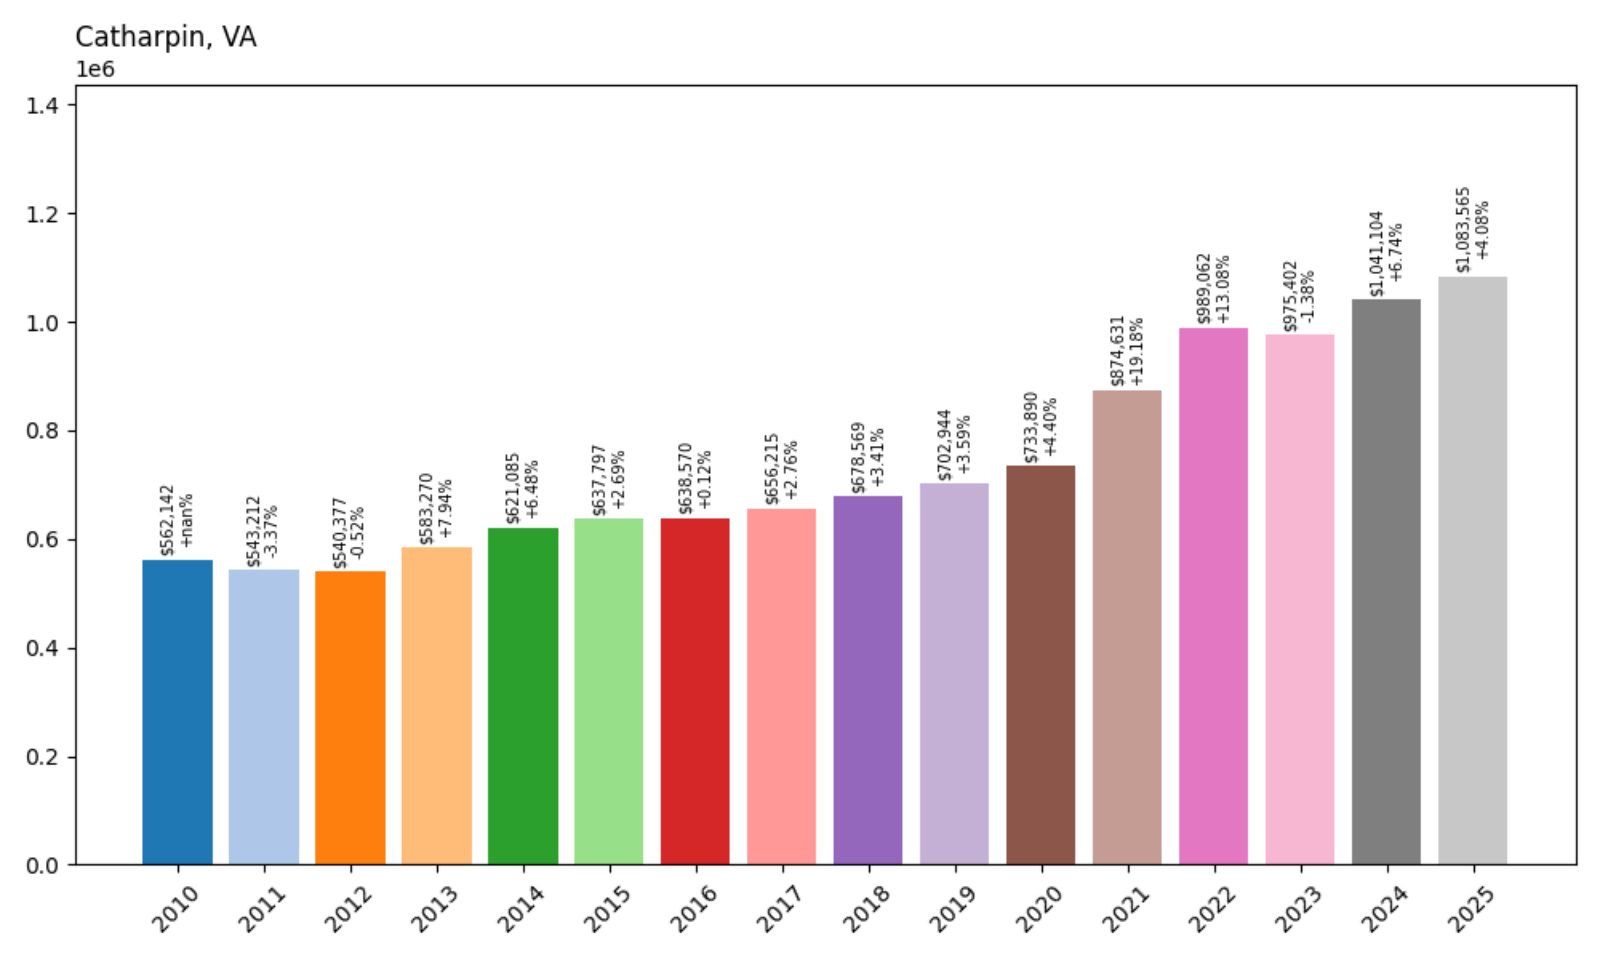
- 2010: $562,142
- 2011: $543,212 (−$18,930, −3.37%)
- 2012: $540,377 (−$2,835, −0.52%)
- 2013: $583,270 (+$42,893, +7.94%)
- 2014: $621,085 (+$37,816, +6.48%)
- 2015: $637,797 (+$16,712, +2.69%)
- 2016: $638,570 (+$773, +0.12%)
- 2017: $656,215 (+$17,644, +2.76%)
- 2018: $678,569 (+$22,354, +3.41%)
- 2019: $702,944 (+$24,375, +3.59%)
- 2020: $733,890 (+$30,946, +4.40%)
- 2021: $874,631 (+$140,741, +19.18%)
- 2022: $989,062 (+$114,431, +13.08%)
- 2023: $975,402 (−$13,660, −1.38%)
- 2024: $1,041,104 (+$65,702, +6.74%)
- 2025: $1,083,565 (+$42,461, +4.08%)
Home prices in Catharpin have nearly doubled since 2010, with the 2025 median reaching over $1.08 million. The town saw its most dramatic gains between 2020 and 2022, and has continued upward despite some volatility.
Catharpin – Equestrian Charm and Open Space

Situated in Prince William County, Catharpin is known for its large lots, equestrian properties, and a rural feel just minutes from the hustle of Northern Virginia. This low-density area appeals to buyers who want land without sacrificing access to shopping and employment corridors. The 2020s housing demand spike pushed home values sharply higher, and 2025’s prices reflect the continued desirability of space, privacy, and peaceful surroundings.
9. Oakton – 68.2% Home Price Increase Since 2010
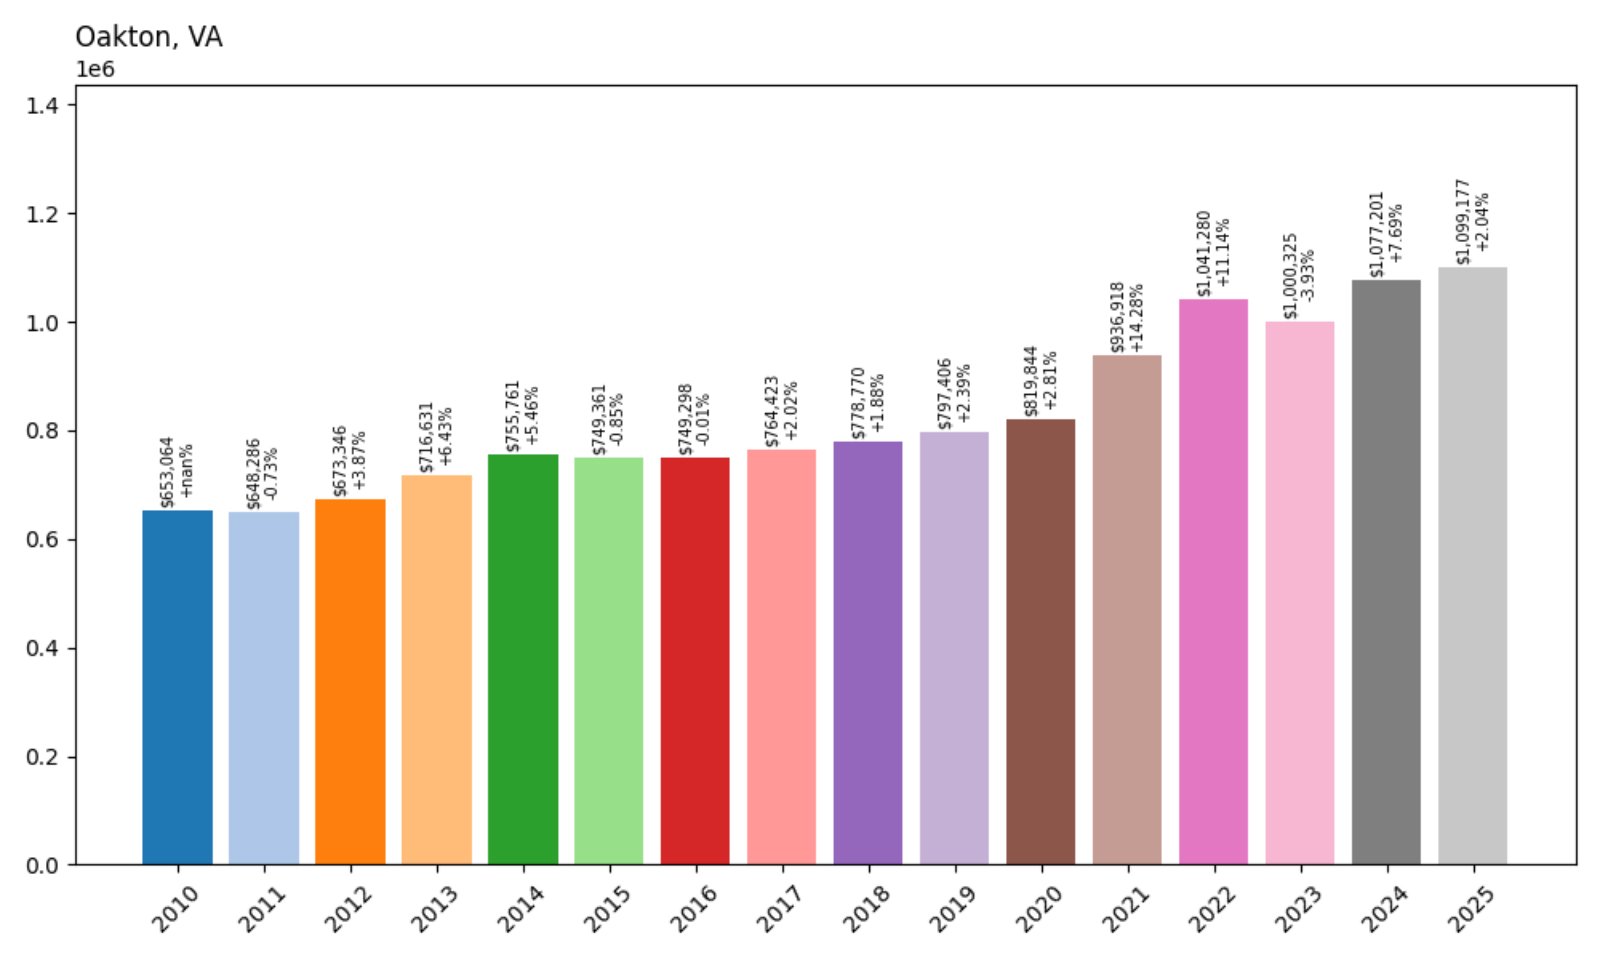
- 2010: $653,064
- 2011: $648,286 (−$4,777, −0.73%)
- 2012: $673,346 (+$25,060, +3.87%)
- 2013: $716,631 (+$43,285, +6.43%)
- 2014: $755,761 (+$39,131, +5.46%)
- 2015: $749,361 (−$6,400, −0.85%)
- 2016: $749,298 (−$63, −0.01%)
- 2017: $764,423 (+$15,125, +2.02%)
- 2018: $778,770 (+$14,347, +1.88%)
- 2019: $797,406 (+$18,637, +2.39%)
- 2020: $819,844 (+$22,438, +2.81%)
- 2021: $936,918 (+$117,074, +14.28%)
- 2022: $1,041,280 (+$104,361, +11.14%)
- 2023: $1,000,325 (−$40,954, −3.93%)
- 2024: $1,077,201 (+$76,876, +7.69%)
- 2025: $1,099,177 (+$21,976, +2.04%)
Oakton’s home prices have increased over 68% since 2010, cresting at nearly $1.1 million in 2025. While the market dipped slightly in 2023, it regained its footing with strong growth in the two years since.
Oakton – Elite and Understated in the Heart of Fairfax

Oakton is an established community known for wooded neighborhoods, proximity to the Vienna Metro, and top-performing schools. Its upscale homes and low turnover keep inventory tight and prices high. The area attracts families, executives, and longtime residents looking for a quiet, central location with all the benefits of Fairfax County. Price performance in recent years confirms Oakton’s place as a blue-chip real estate market in Northern Virginia.
8. Aldie – 118.6% Home Price Increase Since 2010

- 2010: $503,425
- 2011: $502,619 (−$806, −0.16%)
- 2012: $519,514 (+$16,895, +3.36%)
- 2013: $562,520 (+$43,006, +8.28%)
- 2014: $599,367 (+$36,846, +6.55%)
- 2015: $605,246 (+$5,880, +0.98%)
- 2016: $610,759 (+$5,513, +0.91%)
- 2017: $630,516 (+$19,757, +3.23%)
- 2018: $652,802 (+$22,286, +3.53%)
- 2019: $679,977 (+$27,175, +4.16%)
- 2020: $717,660 (+$37,683, +5.54%)
- 2021: $856,229 (+$138,569, +19.31%)
- 2022: $1,010,587 (+$154,358, +18.03%)
- 2023: $974,279 (−$36,308, −3.59%)
- 2024: $1,052,885 (+$78,606, +8.07%)
- 2025: $1,100,860 (+$47,976, +4.56%)
Aldie’s home prices have more than doubled since 2010, surpassing $1.1 million in 2025. After massive growth in 2021 and 2022, the market briefly cooled before continuing its upward trajectory.
Aldie – Newer Homes, Historic Setting
In Loudoun County, Aldie offers one of the most striking combinations of new construction and rural surroundings. Master-planned communities such as Willowsford have transformed the area, offering luxury homes with cutting-edge design alongside farmland and trails. Aldie appeals to high-income buyers seeking larger homes, scenic views, and a short drive to Dulles Airport. Its price climb reflects the community’s maturation into one of the region’s premier high-end housing markets.
7. Middleburg – 106.1% Home Price Increase Since 2010
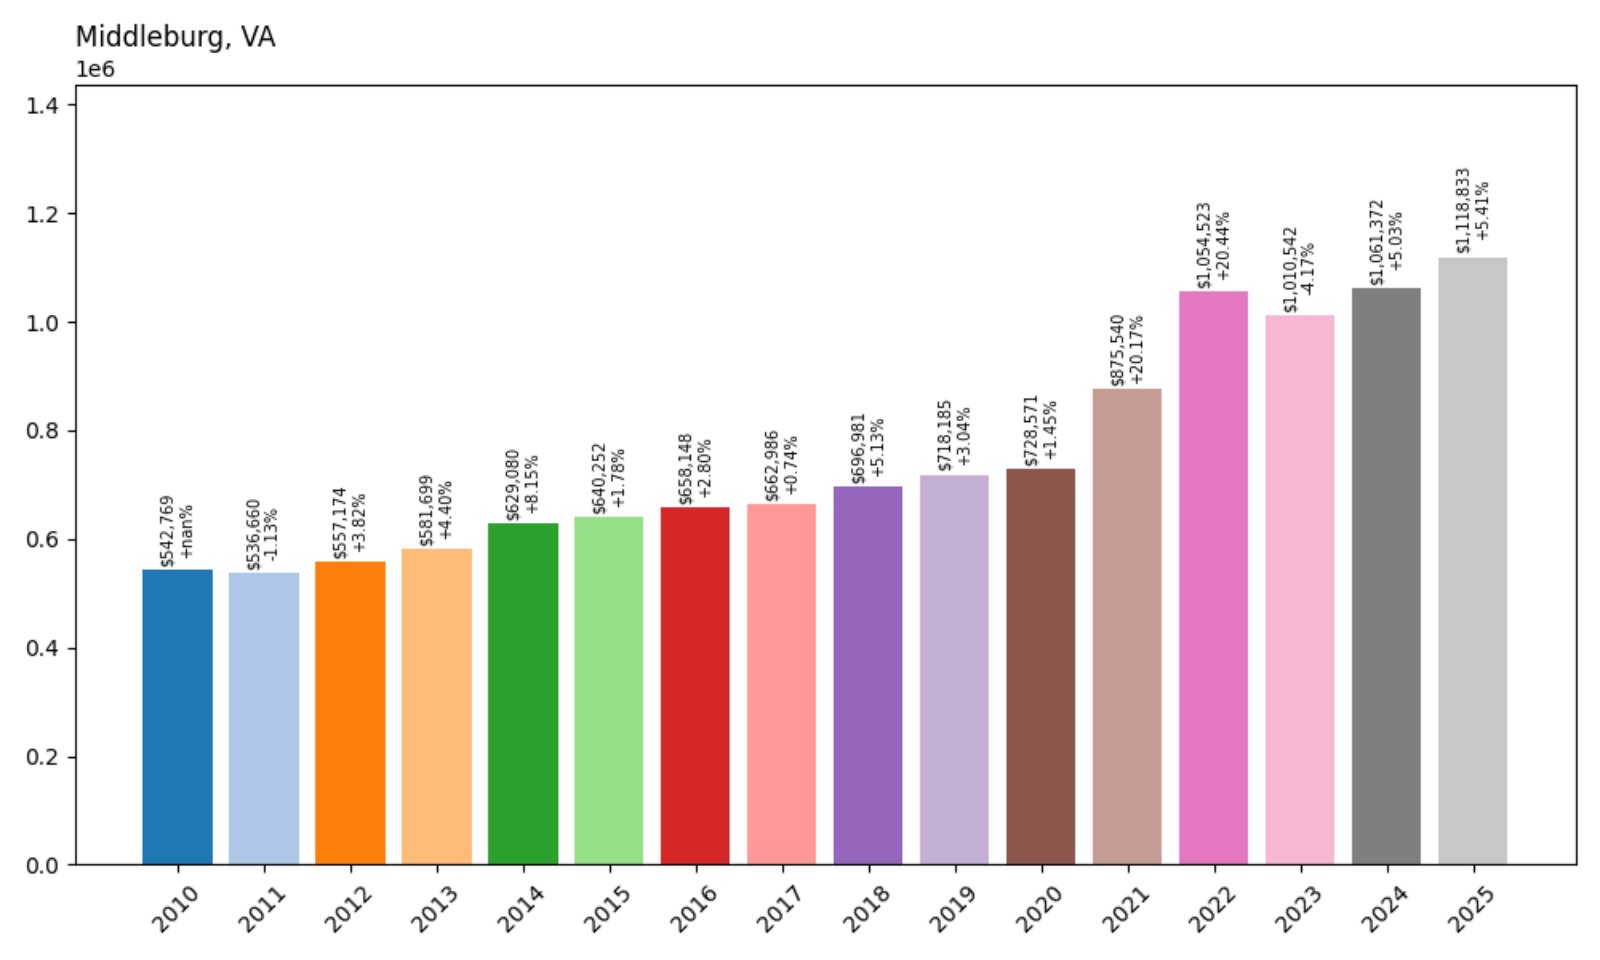
- 2010: $542,769
- 2011: $536,660 (−$6,109, −1.13%)
- 2012: $557,174 (+$20,514, +3.82%)
- 2013: $581,699 (+$24,525, +4.40%)
- 2014: $629,080 (+$47,382, +8.15%)
- 2015: $640,252 (+$11,172, +1.78%)
- 2016: $658,148 (+$17,896, +2.80%)
- 2017: $662,986 (+$4,838, +0.74%)
- 2018: $696,981 (+$33,995, +5.13%)
- 2019: $718,185 (+$21,204, +3.04%)
- 2020: $728,571 (+$10,386, +1.45%)
- 2021: $875,540 (+$146,969, +20.17%)
- 2022: $1,054,523 (+$178,983, +20.44%)
- 2023: $1,010,542 (−$43,981, −4.17%)
- 2024: $1,061,372 (+$50,830, +5.03%)
- 2025: $1,118,833 (+$57,461, +5.41%)
Middleburg has seen home prices more than double since 2010, topping $1.1 million in 2025. The town’s high-end appeal and limited inventory have kept it a perennial favorite for luxury buyers.
Middleburg – Virginia’s Equestrian Capital
Middleburg is the heart of Virginia’s horse country, renowned for its estates, fox hunting culture, and boutique downtown. It’s a long-time favorite of celebrities and the wealthy, and its real estate reflects that pedigree. Though the town saw a small dip in 2023, it rebounded swiftly. High barriers to entry — both in price and availability — ensure Middleburg remains one of the state’s most elite housing markets.
6. Upperville – 65.7% Home Price Increase Since 2010
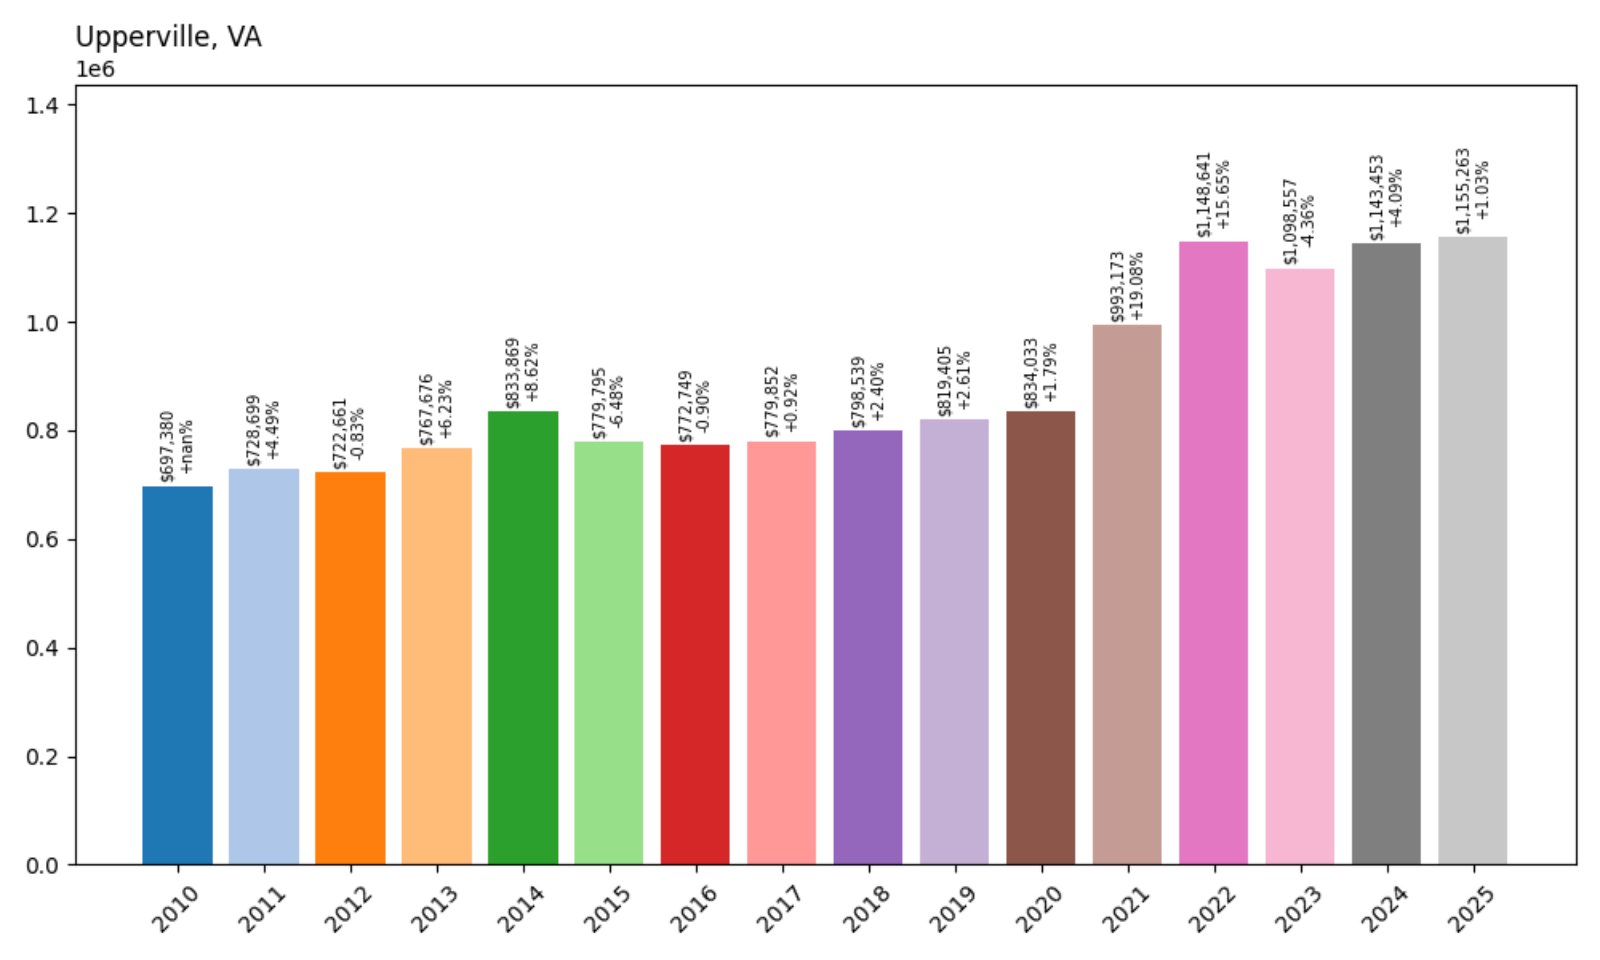
- 2010: $697,380
- 2011: $728,699 (+$31,319, +4.49%)
- 2012: $722,661 (−$6,037, −0.83%)
- 2013: $767,676 (+$45,014, +6.23%)
- 2014: $833,869 (+$66,194, +8.62%)
- 2015: $779,795 (−$54,075, −6.48%)
- 2016: $772,749 (−$7,046, −0.90%)
- 2017: $779,852 (+$7,103, +0.92%)
- 2018: $798,539 (+$18,687, +2.40%)
- 2019: $819,405 (+$20,866, +2.61%)
- 2020: $834,033 (+$14,628, +1.79%)
- 2021: $993,173 (+$159,140, +19.08%)
- 2022: $1,148,641 (+$155,469, +15.65%)
- 2023: $1,098,557 (−$50,085, −4.36%)
- 2024: $1,143,453 (+$44,896, +4.09%)
- 2025: $1,155,263 (+$11,810, +1.03%)
Upperville’s home prices have increased by nearly 66% since 2010, crossing $1.15 million in 2025. Prices surged between 2020 and 2022 and have continued to hold strong through 2025.
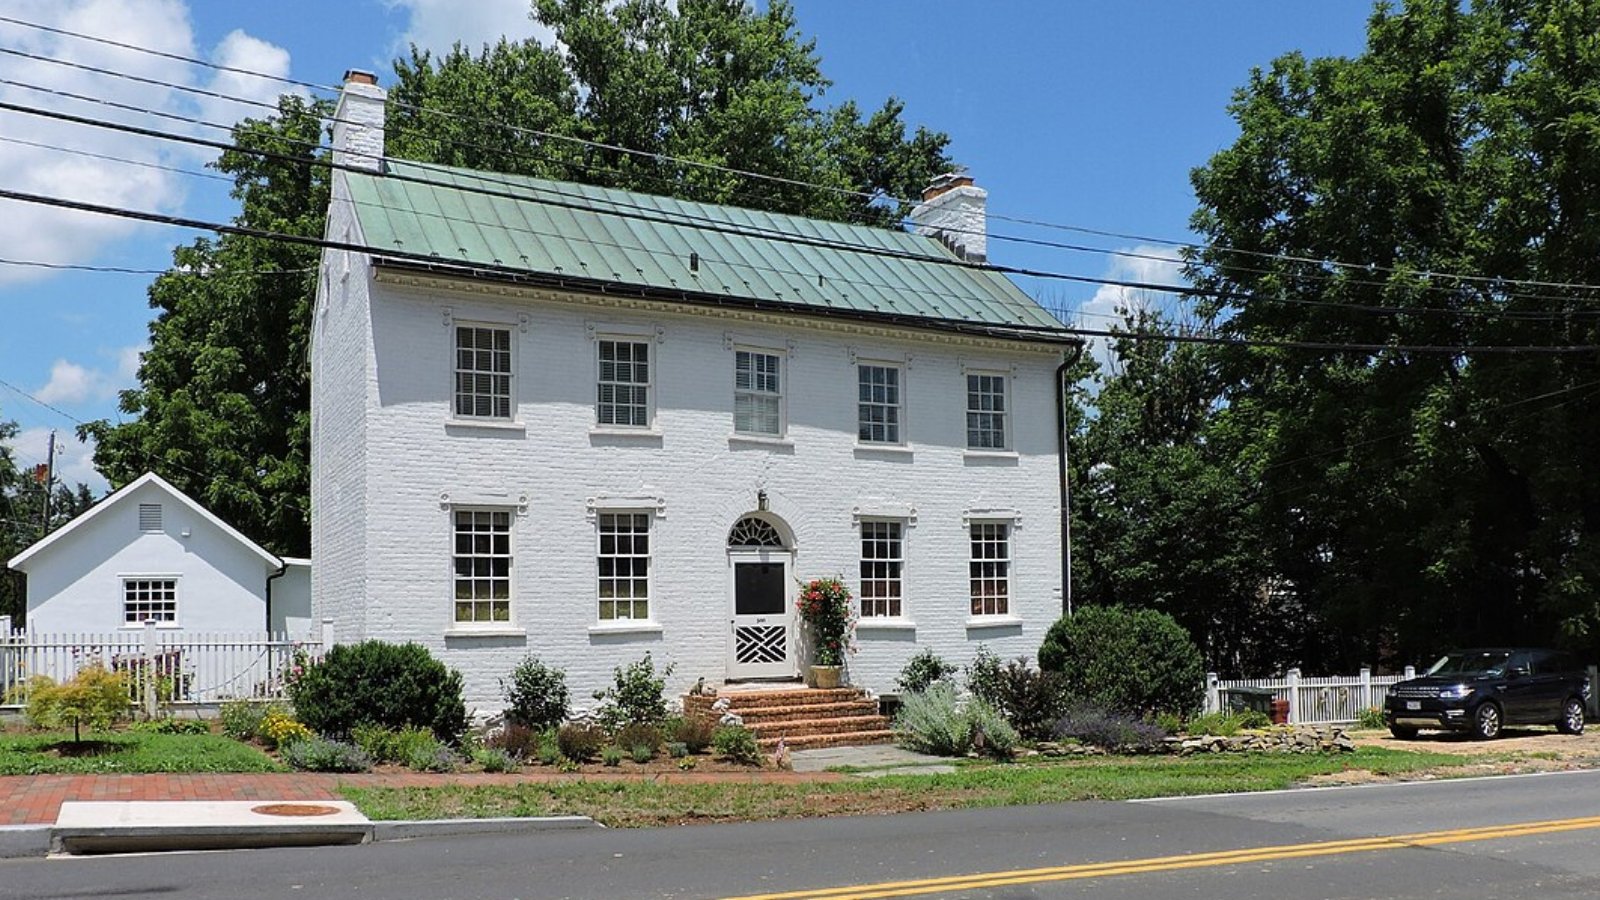
Upperville – Timeless Luxury and Open Land
Upperville is one of Virginia’s oldest and most prestigious estate communities, located in western Fauquier County. It offers expansive horse farms, winding country lanes, and historic architecture. Limited development and strong legacy ownership mean homes here rarely come up for sale — and when they do, they command premium prices. In 2025, Upperville remains a hallmark of timeless rural affluence.
5. Vienna – 81.9% Home Price Increase Since 2010
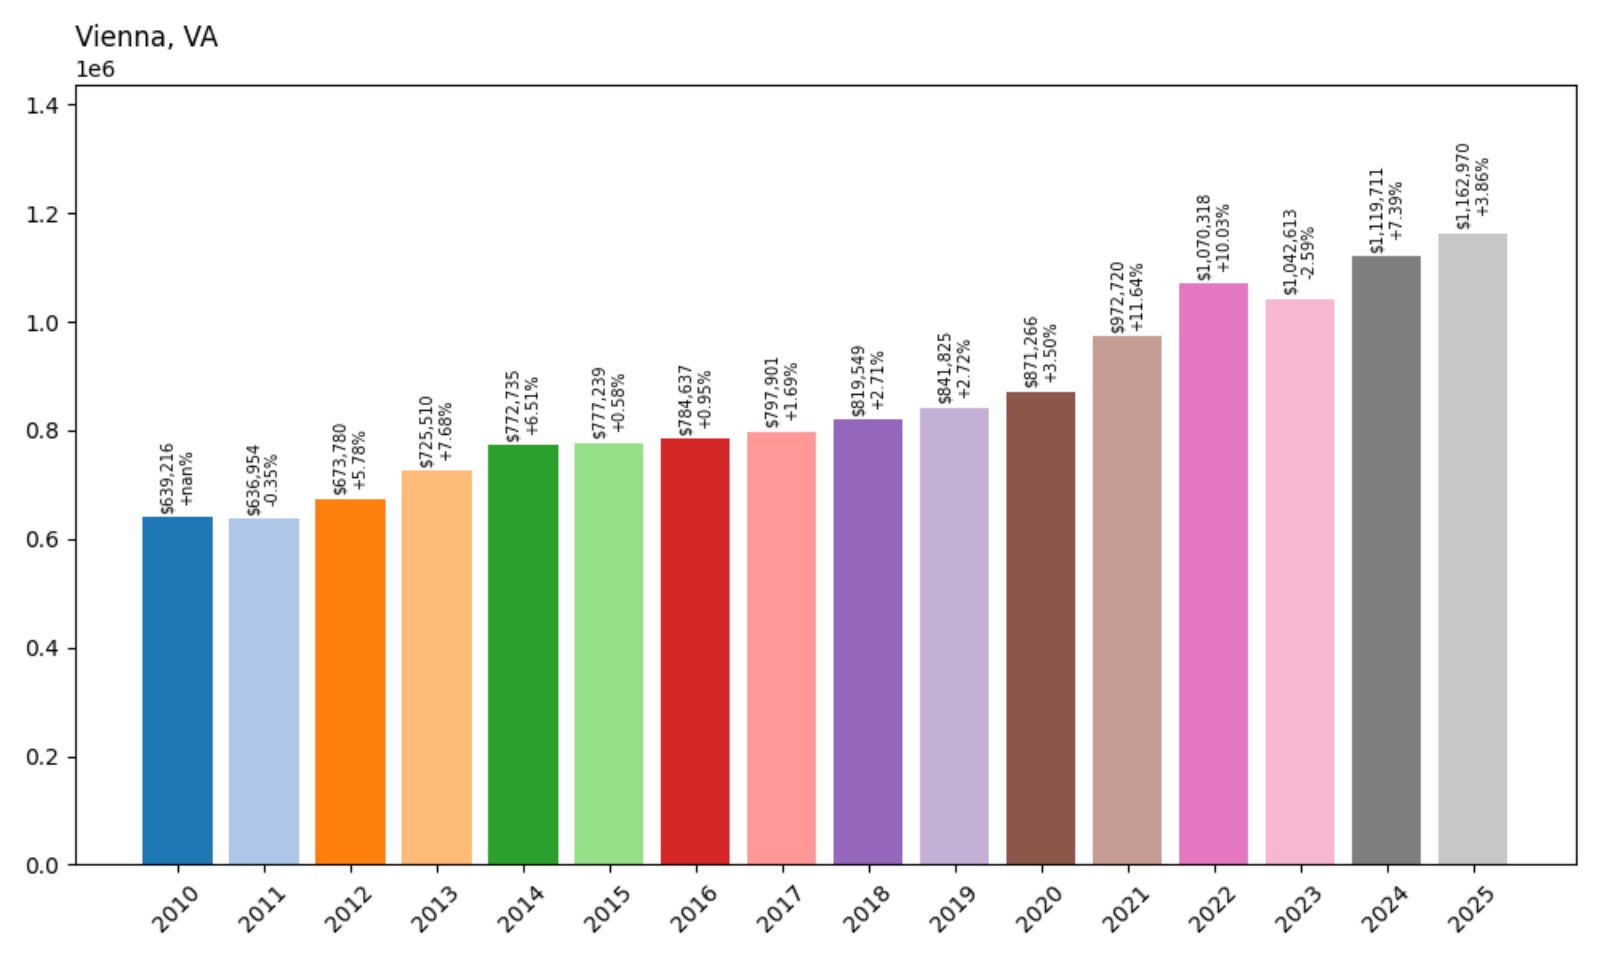
- 2010: $639,216
- 2011: $636,954 (−$2,262, −0.35%)
- 2012: $673,780 (+$36,826, +5.78%)
- 2013: $725,510 (+$51,730, +7.68%)
- 2014: $772,735 (+$47,225, +6.51%)
- 2015: $777,239 (+$4,504, +0.58%)
- 2016: $784,637 (+$7,398, +0.95%)
- 2017: $797,901 (+$13,264, +1.69%)
- 2018: $819,549 (+$21,648, +2.71%)
- 2019: $841,825 (+$22,276, +2.72%)
- 2020: $871,266 (+$29,441, +3.50%)
- 2021: $972,720 (+$101,455, +11.64%)
- 2022: $1,070,318 (+$97,598, +10.03%)
- 2023: $1,042,613 (−$27,705, −2.59%)
- 2024: $1,119,711 (+$77,099, +7.39%)
- 2025: $1,162,970 (+$43,258, +3.86%)
Vienna home prices have climbed nearly 82% since 2010, topping $1.16 million in 2025. The market experienced some softening in 2023 but rebounded quickly with steady growth through 2025.
Vienna – Consistently In-Demand in Fairfax County
Vienna has long been one of Fairfax County’s most stable and desirable communities. Its walkable downtown, access to Metro stations, and high-ranking schools make it a perennial favorite for buyers seeking convenience without sacrificing charm. Even as surrounding markets fluctuated, Vienna’s values climbed steadily, and today it remains one of the most expensive towns in Virginia.
4. Dunn Loring – 90.6% Home Price Increase Since 2010
- 2010: $652,638
- 2011: $651,137 (−$1,501, −0.23%)
- 2012: $695,098 (+$43,961, +6.75%)
- 2013: $750,408 (+$55,310, +7.96%)
- 2014: $797,351 (+$46,943, +6.26%)
- 2015: $796,787 (−$564, −0.07%)
- 2016: $817,493 (+$20,706, +2.60%)
- 2017: $836,594 (+$19,102, +2.34%)
- 2018: $861,720 (+$25,126, +3.00%)
- 2019: $891,307 (+$29,586, +3.43%)
- 2020: $916,974 (+$25,668, +2.88%)
- 2021: $1,018,242 (+$101,268, +11.04%)
- 2022: $1,137,968 (+$119,726, +11.76%)
- 2023: $1,108,396 (−$29,572, −2.60%)
- 2024: $1,208,205 (+$99,809, +9.00%)
- 2025: $1,243,803 (+$35,598, +2.95%)
Dunn Loring has seen a nearly 91% increase in home values since 2010. In 2025, the median price sits above $1.24 million, with solid gains seen even after brief market softening in 2023.
Dunn Loring – Transit Access and Limited Supply
Compact and highly accessible, Dunn Loring attracts buyers with its Metro station, proximity to Tysons, and high-end suburban appeal. The limited supply of detached homes in this tight-knit neighborhood creates sustained price pressure. The area’s surge in values after 2020 shows just how popular transit-friendly luxury has become in Northern Virginia.
3. Waterford – 109.9% Home Price Increase Since 2010
- 2010: $617,435
- 2011: $595,629 (−$21,806, −3.53%)
- 2012: $613,113 (+$17,484, +2.94%)
- 2013: $648,457 (+$35,343, +5.76%)
- 2014: $695,680 (+$47,223, +7.28%)
- 2015: $711,166 (+$15,486, +2.23%)
- 2016: $710,479 (−$687, −0.10%)
- 2017: $715,982 (+$5,502, +0.77%)
- 2018: $741,819 (+$25,837, +3.61%)
- 2019: $771,806 (+$29,987, +4.04%)
- 2020: $801,151 (+$29,345, +3.80%)
- 2021: $964,545 (+$163,394, +20.39%)
- 2022: $1,142,770 (+$178,226, +18.48%)
- 2023: $1,144,270 (+$1,499, +0.13%)
- 2024: $1,229,550 (+$85,280, +7.45%)
- 2025: $1,296,027 (+$66,477, +5.41%)
Waterford has seen home values more than double since 2010, with a median price of $1.29 million in 2025. The area has enjoyed consistent appreciation since 2020, with especially strong gains in 2021–2022.
Waterford – Historic Elegance and Secluded Appeal
A national historic landmark, Waterford blends historic architecture with estate-style homes on large lots. Located in Loudoun County, it’s known for privacy, charm, and limited development. Those features have made it one of the most expensive and exclusive rural towns in the state. Its high price point in 2025 reflects the enduring appeal of heritage and seclusion.
2. McLean – 78.7% Home Price Increase Since 2010
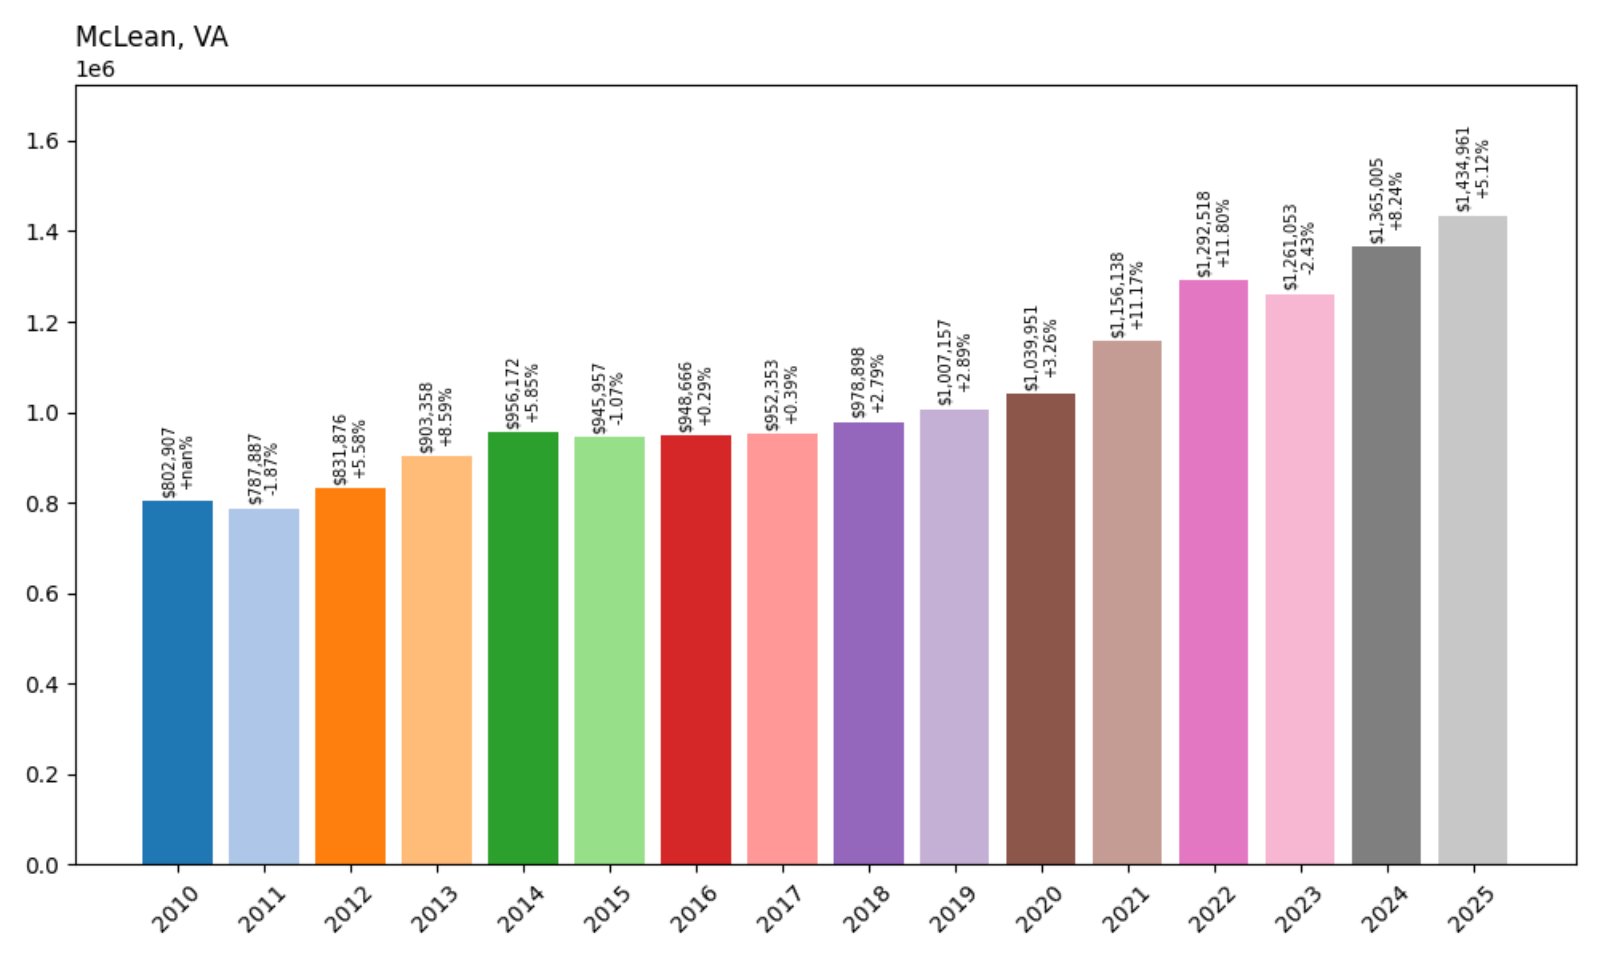
- 2010: $802,907
- 2011: $787,887 (−$15,020, −1.87%)
- 2012: $831,876 (+$43,989, +5.58%)
- 2013: $903,358 (+$71,481, +8.59%)
- 2014: $956,172 (+$52,814, +5.85%)
- 2015: $945,957 (−$10,215, −1.07%)
- 2016: $948,666 (+$2,709, +0.29%)
- 2017: $952,353 (+$3,687, +0.39%)
- 2018: $978,898 (+$26,545, +2.79%)
- 2019: $1,007,157 (+$28,259, +2.89%)
- 2020: $1,039,951 (+$32,794, +3.26%)
- 2021: $1,156,138 (+$116,187, +11.17%)
- 2022: $1,292,518 (+$136,380, +11.80%)
- 2023: $1,261,053 (−$31,465, −2.43%)
- 2024: $1,365,005 (+$103,952, +8.24%)
- 2025: $1,434,961 (+$69,956, +5.12%)
McLean’s housing market has grown nearly 79% since 2010, with homes now averaging $1.43 million in 2025. Steady demand and limited inventory have made it one of the top-tier housing markets in the state.
McLean – The Pinnacle of Suburban Luxury
McLean is Northern Virginia’s most iconic luxury market. Located minutes from D.C., it offers top schools, exclusive neighborhoods, and proximity to business centers. Langley, Salona Village, and Ballantrae Farms house many of the region’s wealthiest families. High barriers to entry ensure that prices here stay elevated — and growing.
1. Great Falls – 73.9% Home Price Increase Since 2010
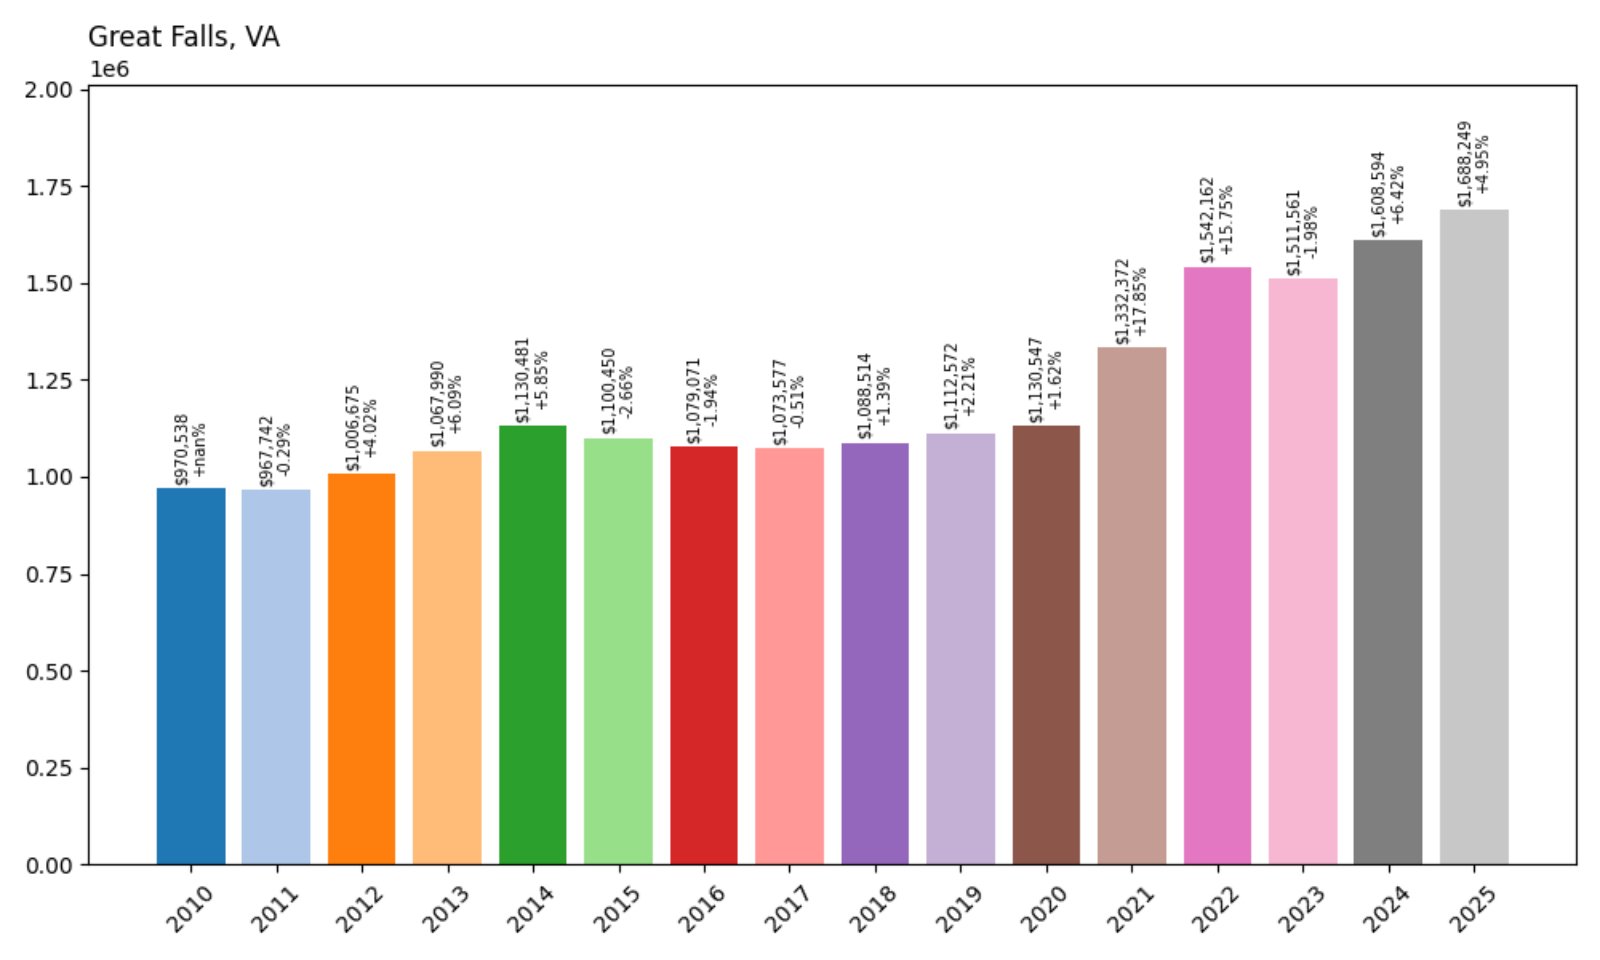
- 2010: $970,538
- 2011: $967,742 (−$2,796, −0.29%)
- 2012: $1,006,675 (+$38,933, +4.02%)
- 2013: $1,067,990 (+$61,315, +6.09%)
- 2014: $1,130,481 (+$62,491, +5.85%)
- 2015: $1,100,450 (−$30,031, −2.66%)
- 2016: $1,079,071 (−$21,379, −1.94%)
- 2017: $1,073,577 (−$5,494, −0.51%)
- 2018: $1,088,514 (+$14,937, +1.39%)
- 2019: $1,112,572 (+$24,058, +2.21%)
- 2020: $1,130,547 (+$17,976, +1.62%)
- 2021: $1,332,372 (+$201,825, +17.85%)
- 2022: $1,542,162 (+$209,790, +15.75%)
- 2023: $1,511,561 (−$30,602, −1.98%)
- 2024: $1,608,594 (+$97,033, +6.42%)
- 2025: $1,688,249 (+$79,655, +4.95%)
Great Falls tops Virginia’s home price charts with a 2025 median value of over $1.68 million — a 74% increase since 2010. Despite some market corrections, its values remain the highest in the state.
Great Falls – Secluded Estates and Enduring Luxury
Great Falls is known for expansive lots, privacy, and stately architecture. Located along the Potomac and buffered by parkland, the town is home to D.C.’s elite. Its luxurious homes and highly regulated development have kept supply low and prices high. With some of the most prestigious addresses in the state, Great Falls maintains its crown as Virginia’s most expensive town in 2025.


