🔥 Would you like to save this?
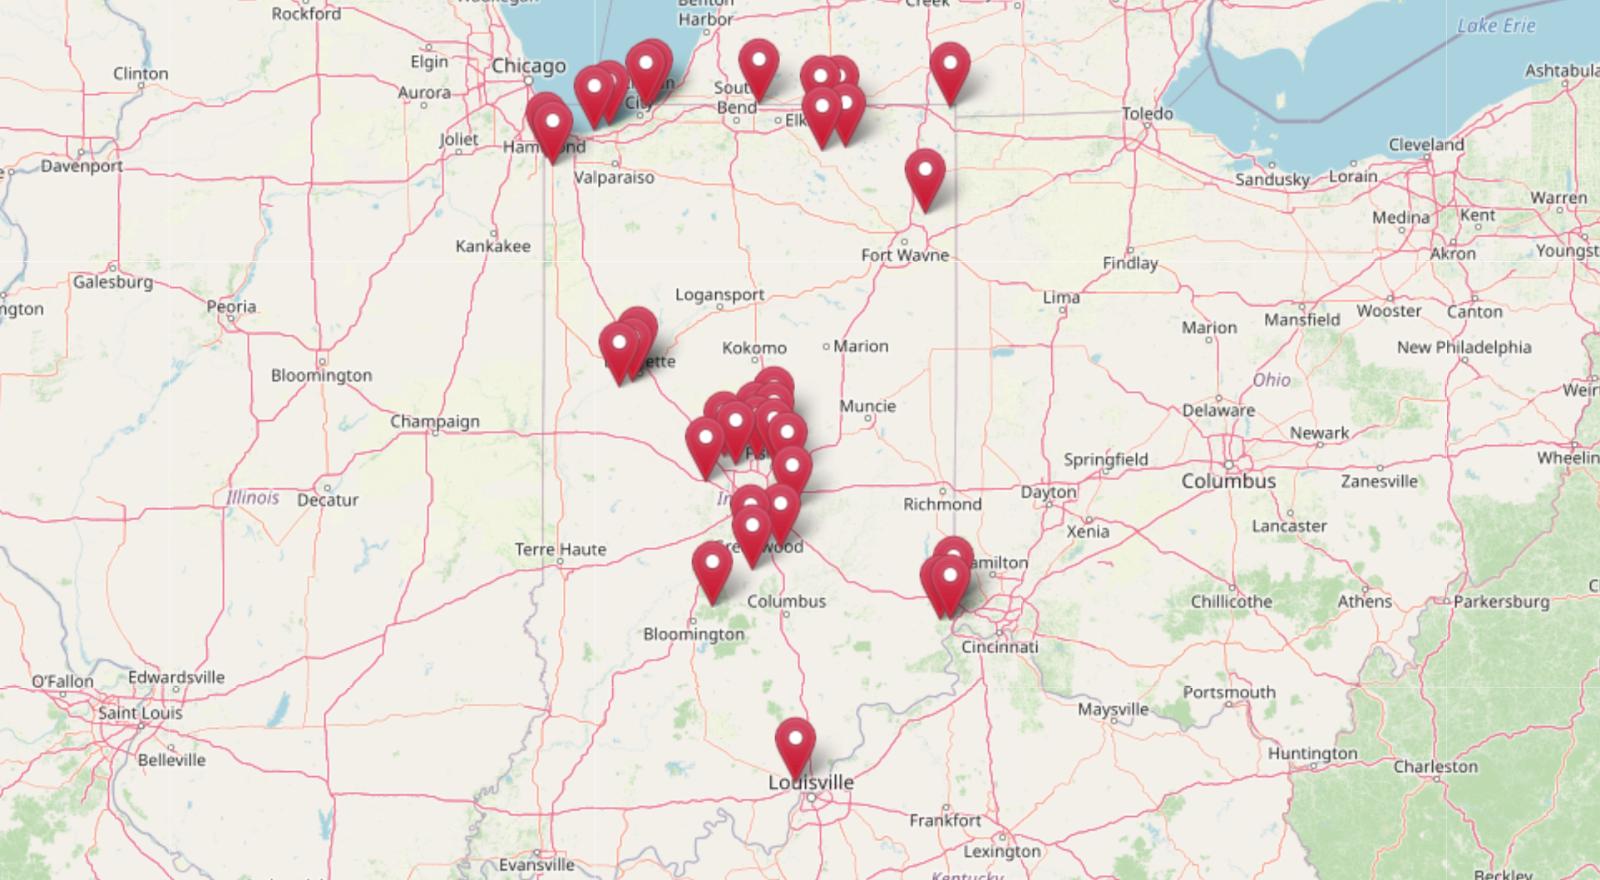
Home prices across Indiana are climbing faster than expected, and the Zillow Home Value Index reveals just how steep those increases have been. In some towns, property values have more than doubled since 2012, and many are still gaining momentum in 2025. These 34 hotspots aren’t just beating the state average — they’re transforming into fast-growing real estate zones fueled by remote work, regional migration, and rising demand for suburban and scenic living. From lakefront gems near Lake Michigan to small towns outside Indianapolis, the housing landscape in Indiana is changing quickly — and not always in ways you’d expect.
34. Trafalgar – 123% Home Price Increase Since 2010
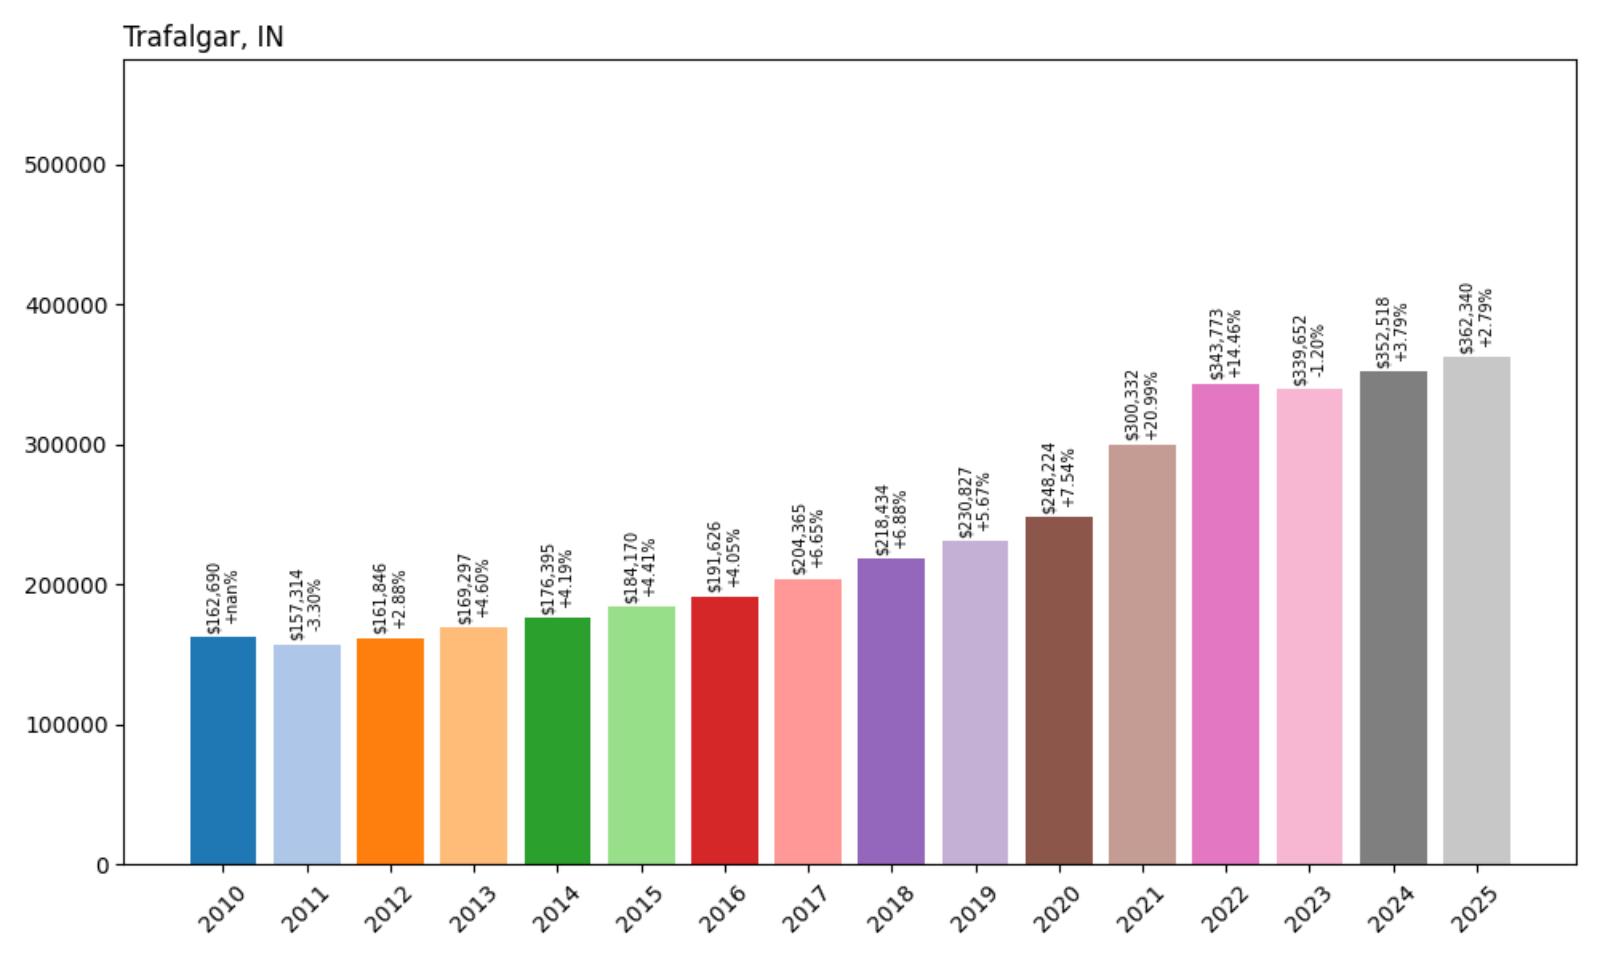
- 2010: $162,690
- 2011: $157,314 (−$5,376, −3.30% from previous year)
- 2012: $161,846 (+$4,532, +2.88% from previous year)
- 2013: $169,297 (+$7,451, +4.60% from previous year)
- 2014: $176,395 (+$7,097, +4.19% from previous year)
- 2015: $184,170 (+$7,775, +4.41% from previous year)
- 2016: $191,626 (+$7,457, +4.05% from previous year)
- 2017: $204,365 (+$12,739, +6.65% from previous year)
- 2018: $218,434 (+$14,069, +6.88% from previous year)
- 2019: $230,827 (+$12,393, +5.67% from previous year)
- 2020: $248,224 (+$17,397, +7.54% from previous year)
- 2021: $300,332 (+$52,108, +20.99% from previous year)
- 2022: $343,773 (+$43,441, +14.46% from previous year)
- 2023: $339,652 (−$4,121, −1.20% from previous year)
- 2024: $352,518 (+$12,867, +3.79% from previous year)
- 2025: $362,340 (+$9,822, +2.79% from previous year)
Trafalgar’s housing market demonstrates the steady climb that has characterized many Indiana communities over the past fifteen years. The town experienced its most dramatic surge during the pandemic years of 2021-2022, when prices jumped over 35% in just two years. This pattern mirrors broader national trends but shows Trafalgar’s resilience in maintaining value even during market corrections. The current median home price of $362,340 represents more than double what homes cost in 2010, making it one of the more affordable options among towns experiencing significant appreciation.
In order to come up with the very specific design ideas, we create most designs with the assistance of state-of-the-art AI interior design software. Also, assume links that take you off the site are affiliate links such as links to Amazon. this means we may earn a commission if you buy something.
Trafalgar – Small Town Growth With Big City Access
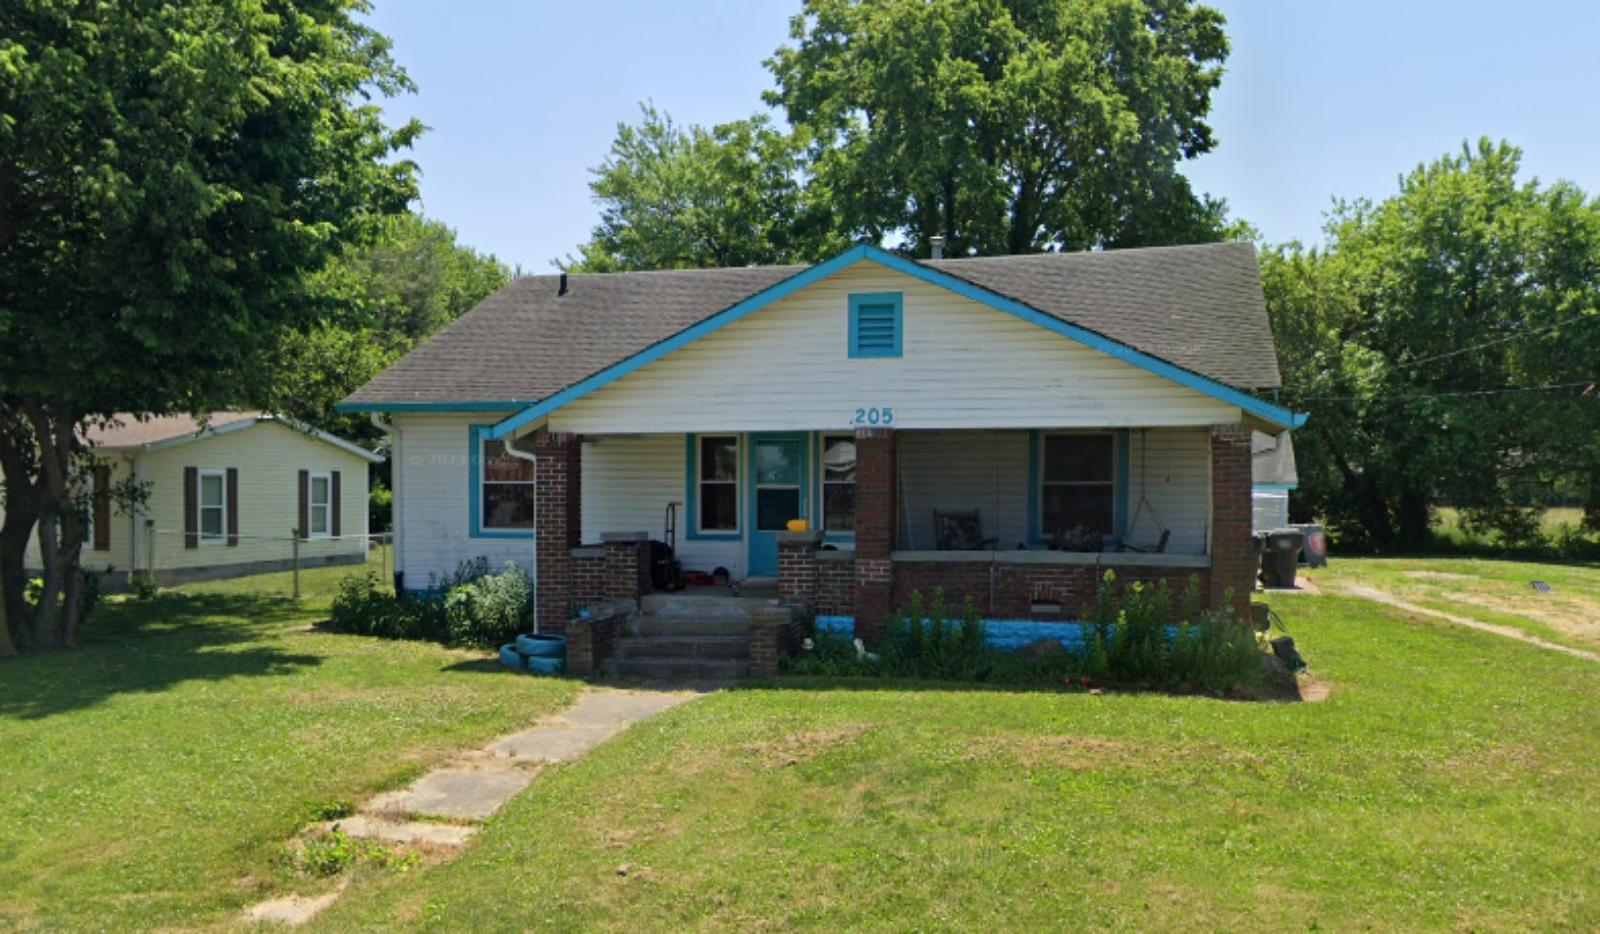
Located in Johnson County just south of Indianapolis, Trafalgar has emerged as an attractive option for families seeking small-town charm with reasonable access to metropolitan amenities. The community of roughly 1,100 residents sits strategically along State Road 135, providing a direct route to Indianapolis for commuters while maintaining its rural character. The town’s growth reflects the broader trend of suburban expansion as families seek more space and value compared to urban markets.
Trafalgar’s housing market benefits from its position in one of Indiana’s fastest-growing counties. Johnson County has seen consistent population growth over the past two decades, driven by families relocating from Indianapolis for better schools, larger lots, and lower cost of living. The town offers a classic small-town atmosphere with annual festivals, local parks, and a tight-knit community feel that appeals to young families and retirees alike. This combination of affordability and accessibility continues to drive demand, supporting the steady price appreciation reflected in the data.
33. Dyer – 75% Home Price Increase Since 2010
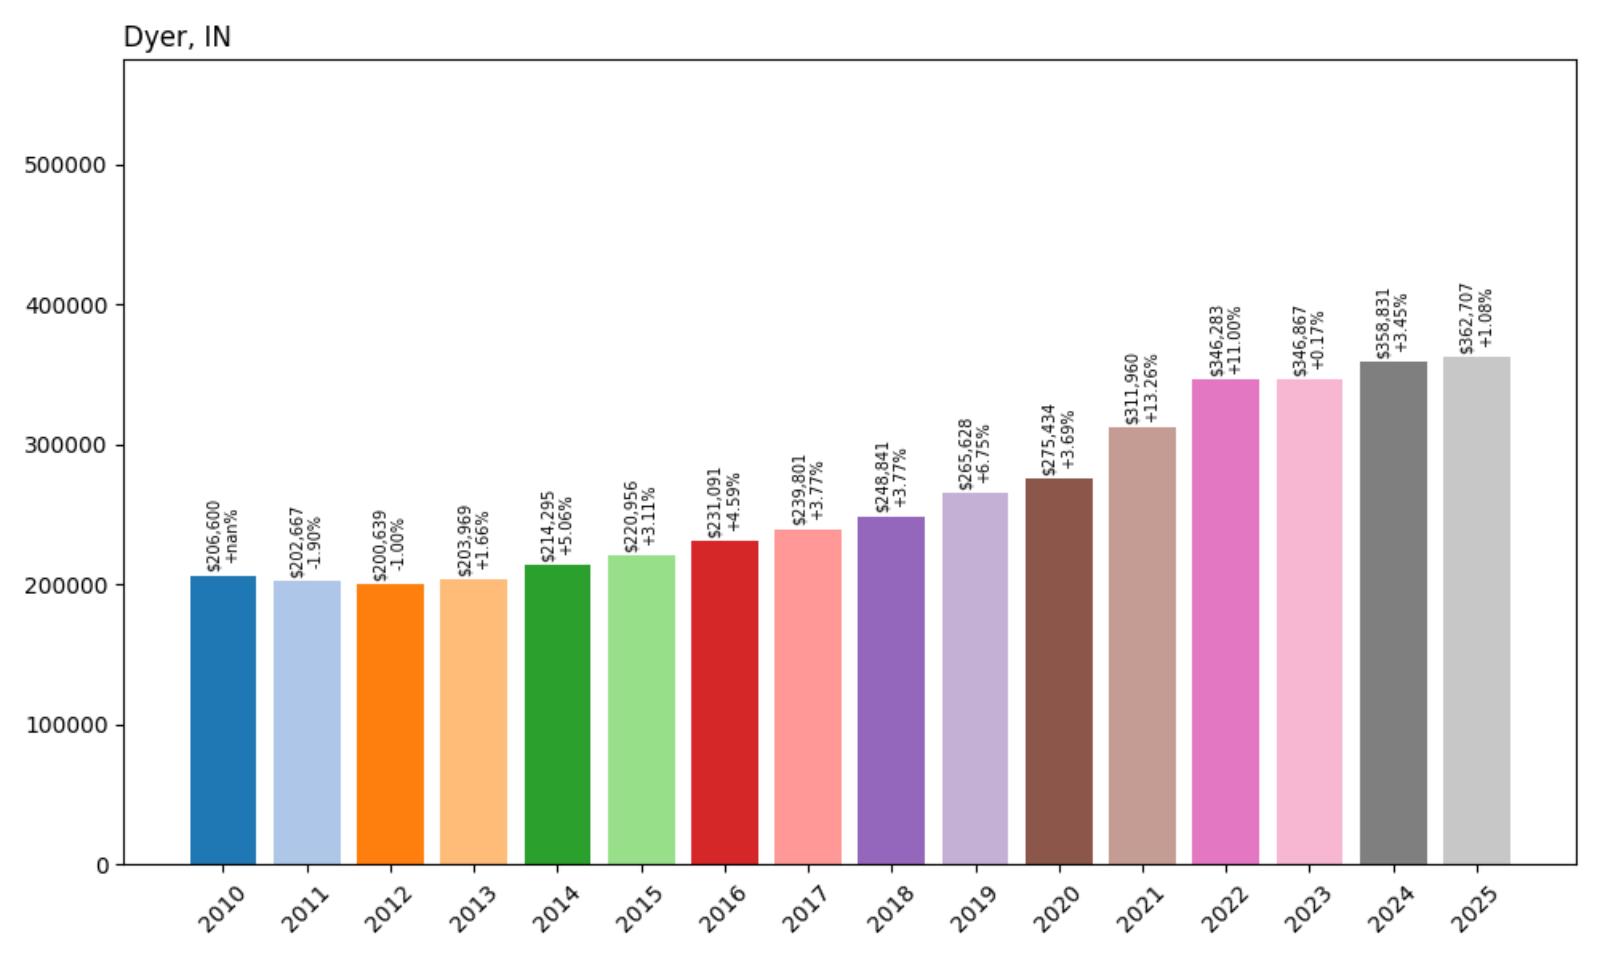
- 2010: $206,600
- 2011: $202,667 (−$3,934, −1.90% from previous year)
- 2012: $200,639 (−$2,027, −1.00% from previous year)
- 2013: $203,969 (+$3,329, +1.66% from previous year)
- 2014: $214,295 (+$10,327, +5.06% from previous year)
- 2015: $220,956 (+$6,660, +3.11% from previous year)
- 2016: $231,091 (+$10,135, +4.59% from previous year)
- 2017: $239,801 (+$8,710, +3.77% from previous year)
- 2018: $248,841 (+$9,040, +3.77% from previous year)
- 2019: $265,628 (+$16,788, +6.75% from previous year)
- 2020: $275,434 (+$9,806, +3.69% from previous year)
- 2021: $311,960 (+$36,526, +13.26% from previous year)
- 2022: $346,283 (+$34,323, +11.00% from previous year)
- 2023: $346,867 (+$584, +0.17% from previous year)
- 2024: $358,831 (+$11,964, +3.45% from previous year)
- 2025: $362,707 (+$3,876, +1.08% from previous year)
Dyer’s housing market shows a more measured appreciation pattern compared to other communities on this list, with steady but consistent growth over the 15-year period. The town experienced its strongest gains during 2021-2022, following national trends, but has since stabilized with modest annual increases. At $362,707, current home values represent a 75% increase from 2010 levels, reflecting Dyer’s status as an established community with mature infrastructure and stable demand patterns.
Dyer – Northwest Indiana’s Family-Friendly Hub
Positioned in Lake County within the Chicago metropolitan area, Dyer offers residents the unique advantage of small-town living with access to one of America’s largest job markets. The town of approximately 16,000 residents has built a reputation for excellent schools, well-maintained neighborhoods, and family-oriented amenities that attract professionals working in both Indiana and Illinois. Dyer’s location along major transportation corridors, including Interstate 65 and the Borman Expressway, makes it particularly appealing to commuters.
The community’s housing market reflects its mature development and strong local governance. Dyer has successfully balanced growth with quality of life, maintaining strict development standards that preserve property values while accommodating new residents. The town features numerous parks, recreational facilities, and community events that foster neighborhood connections. This combination of accessibility, amenities, and stable governance continues to support property values, even as the market has moderated from pandemic-era highs. Dyer’s strategic location and established infrastructure suggest continued steady appreciation in the years ahead.
32. Middlebury – 126% Home Price Increase Since 2010
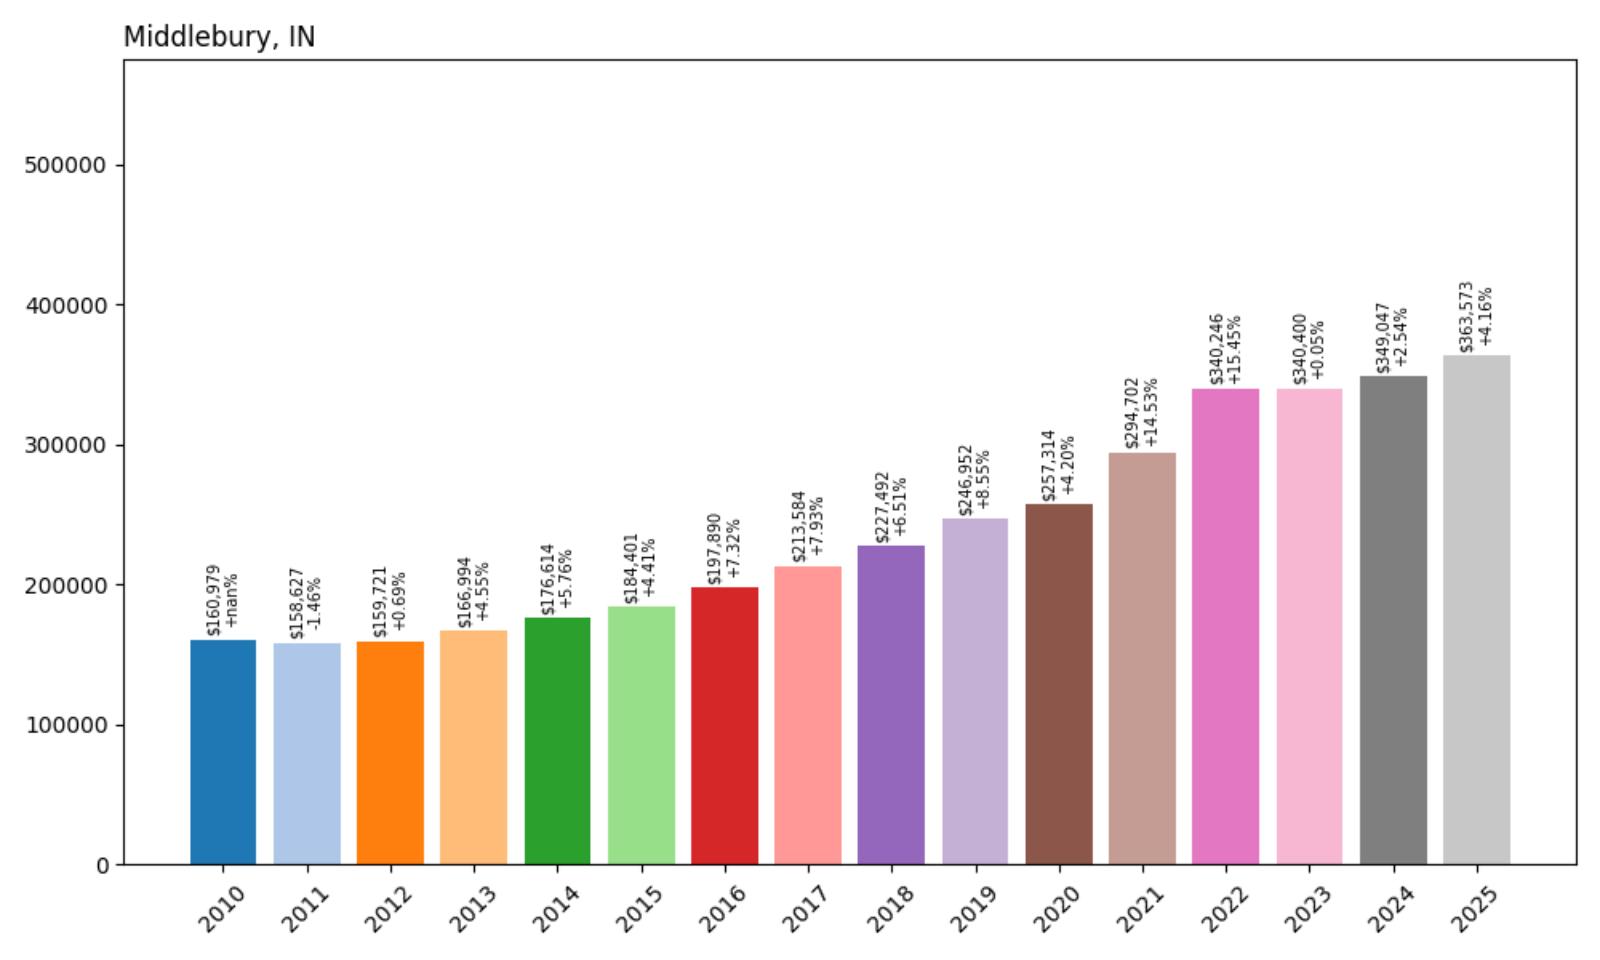
- 2010: $160,979
- 2011: $158,627 (−$2,353, −1.46% from previous year)
- 2012: $159,721 (+$1,094, +0.69% from previous year)
- 2013: $166,994 (+$7,273, +4.55% from previous year)
- 2014: $176,614 (+$9,621, +5.76% from previous year)
- 2015: $184,401 (+$7,787, +4.41% from previous year)
- 2016: $197,890 (+$13,489, +7.32% from previous year)
- 2017: $213,584 (+$15,694, +7.93% from previous year)
- 2018: $227,492 (+$13,909, +6.51% from previous year)
- 2019: $246,952 (+$19,460, +8.55% from previous year)
- 2020: $257,314 (+$10,362, +4.20% from previous year)
- 2021: $294,702 (+$37,388, +14.53% from previous year)
- 2022: $340,246 (+$45,544, +15.45% from previous year)
- 2023: $340,400 (+$154, +0.05% from previous year)
- 2024: $349,047 (+$8,647, +2.54% from previous year)
- 2025: $363,573 (+$14,526, +4.16% from previous year)
Middlebury stands out for its remarkable 126% price appreciation since 2010, with particularly strong growth in the 2016-2019 period when home values increased by over 8% annually. The town saw explosive growth during the pandemic years, with prices jumping nearly 30% in 2021-2022 alone. Current median home prices of $363,573 represent more than double the 2010 baseline, placing Middlebury among the most appreciating small communities in northern Indiana.
Middlebury – Heart of Amish Country’s Economic Boom
Located in Elkhart County, Middlebury sits at the center of one of Indiana’s most unique economic regions, where traditional Amish craftsmanship meets modern manufacturing innovation. The town of approximately 3,500 residents serves as a commercial hub for the surrounding rural area, benefiting from both tourism related to Amish culture and a thriving recreational vehicle manufacturing industry that has made Elkhart County the RV capital of the world. This economic diversity has created sustained demand for housing as workers from various industries settle in the area.
Middlebury’s housing surge reflects the broader economic transformation of Elkhart County, which has evolved from primarily agricultural to a manufacturing powerhouse while maintaining its cultural heritage. The town offers an attractive quality of life with low crime rates, good schools, and easy access to outdoor recreation including numerous lakes and state parks. The presence of major employers in the RV industry, combined with the area’s growing reputation as a tourist destination, has created a perfect storm for real estate appreciation. As remote work continues to enable location flexibility, Middlebury’s combination of affordability, safety, and economic opportunity positions it well for continued growth.
31. West Harrison – 112% Home Price Increase Since 2011
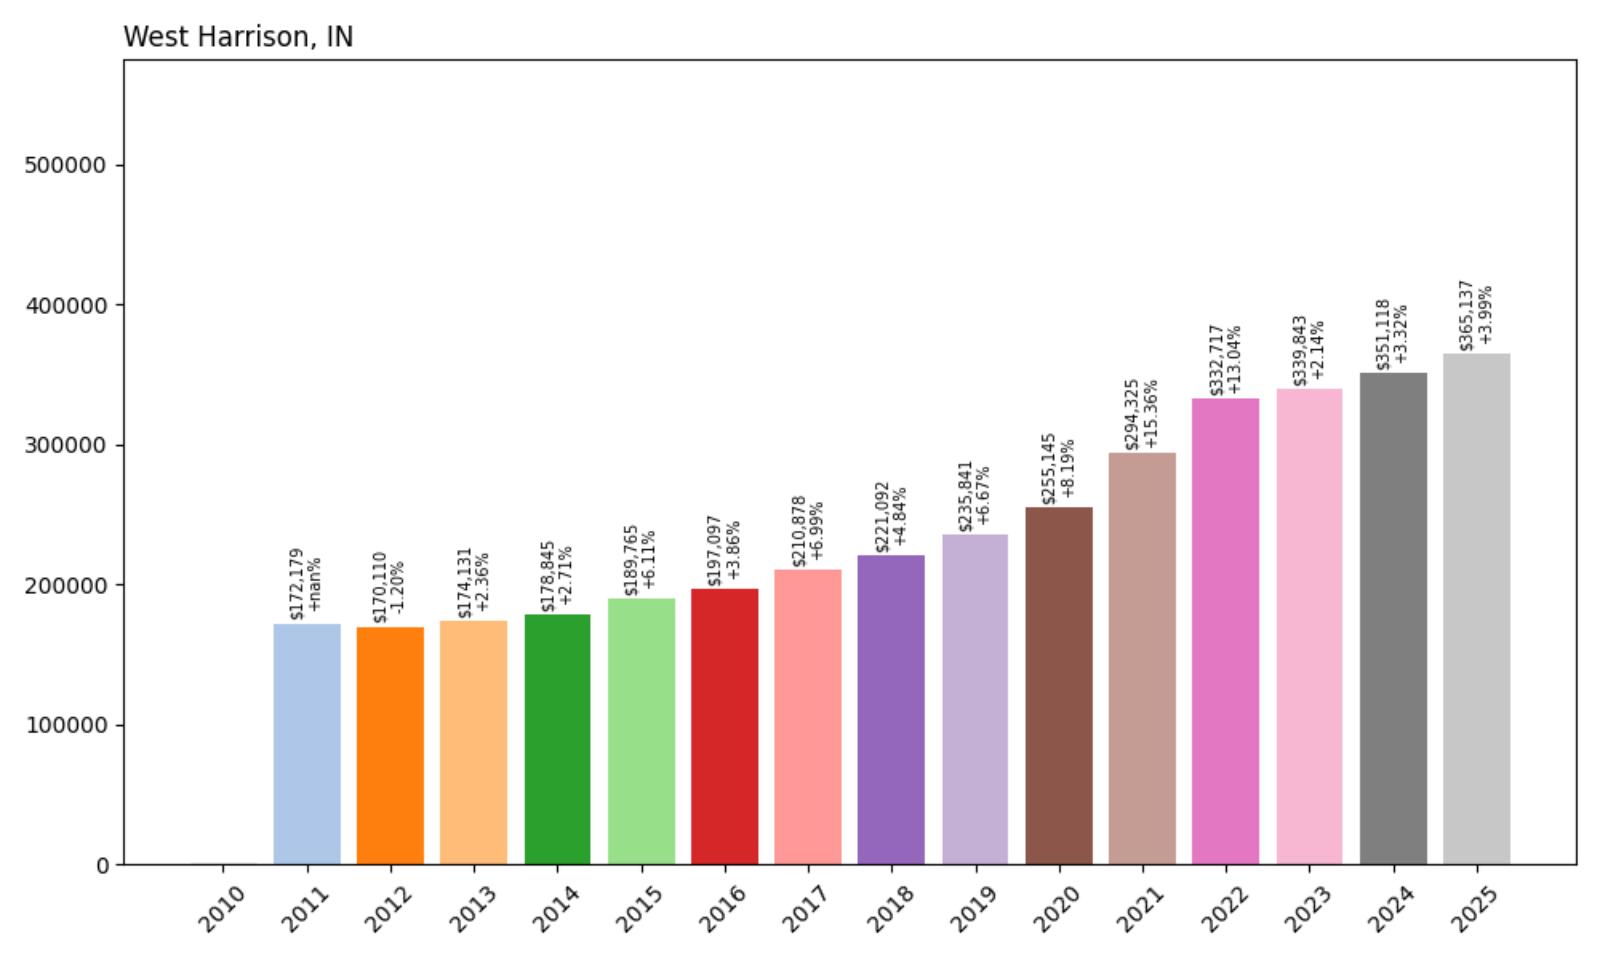
- 2011: $172,179
- 2012: $170,110 (−$2,069, −1.20% from previous year)
- 2013: $174,131 (+$4,021, +2.36% from previous year)
- 2014: $178,845 (+$4,714, +2.71% from previous year)
- 2015: $189,765 (+$10,921, +6.11% from previous year)
- 2016: $197,097 (+$7,332, +3.86% from previous year)
- 2017: $210,878 (+$13,781, +6.99% from previous year)
- 2018: $221,092 (+$10,214, +4.84% from previous year)
- 2019: $235,841 (+$14,749, +6.67% from previous year)
- 2020: $255,145 (+$19,304, +8.19% from previous year)
- 2021: $294,325 (+$39,180, +15.36% from previous year)
- 2022: $332,717 (+$38,393, +13.04% from previous year)
- 2023: $339,843 (+$7,126, +2.14% from previous year)
- 2024: $351,118 (+$11,275, +3.32% from previous year)
- 2025: $365,137 (+$14,019, +3.99% from previous year)
West Harrison has experienced remarkable growth since data collection began in 2011, with home values more than doubling to reach $365,137 in 2025. The town demonstrated consistent appreciation throughout the 2010s, accelerating dramatically during 2020-2022 when values increased by over 28% in just two years. This southeastern Indiana community has maintained steady growth even as other markets have moderated, with prices climbing nearly 4% in 2025 alone.
West Harrison – Gateway Community Benefits From Regional Growth
Situated in Dearborn County along the Ohio River, West Harrison occupies a strategic position in the Cincinnati metropolitan area while maintaining its Indiana identity. The town of approximately 400 residents serves as a quiet residential enclave for professionals working in the greater Cincinnati region, offering lower costs and taxes compared to Ohio communities while providing easy access via Interstate 275. This cross-border appeal has driven consistent demand from buyers seeking value and space without sacrificing career opportunities.
West Harrison’s housing market reflects the broader growth patterns of southeastern Indiana, which has benefited from Cincinnati’s economic expansion and population overflow. The area offers a rural lifestyle with modern conveniences, including access to quality healthcare, shopping, and entertainment in nearby Cincinnati. The town’s small size creates a limited housing supply that supports price appreciation, while its location provides the economic opportunities that sustain demand. As remote work continues to reduce the importance of physical proximity to employment centers, communities like West Harrison that offer quality of life advantages at lower costs are likely to see continued interest from buyers seeking alternatives to urban markets.
30. Hidden Valley – 104% Home Price Increase Since 2011
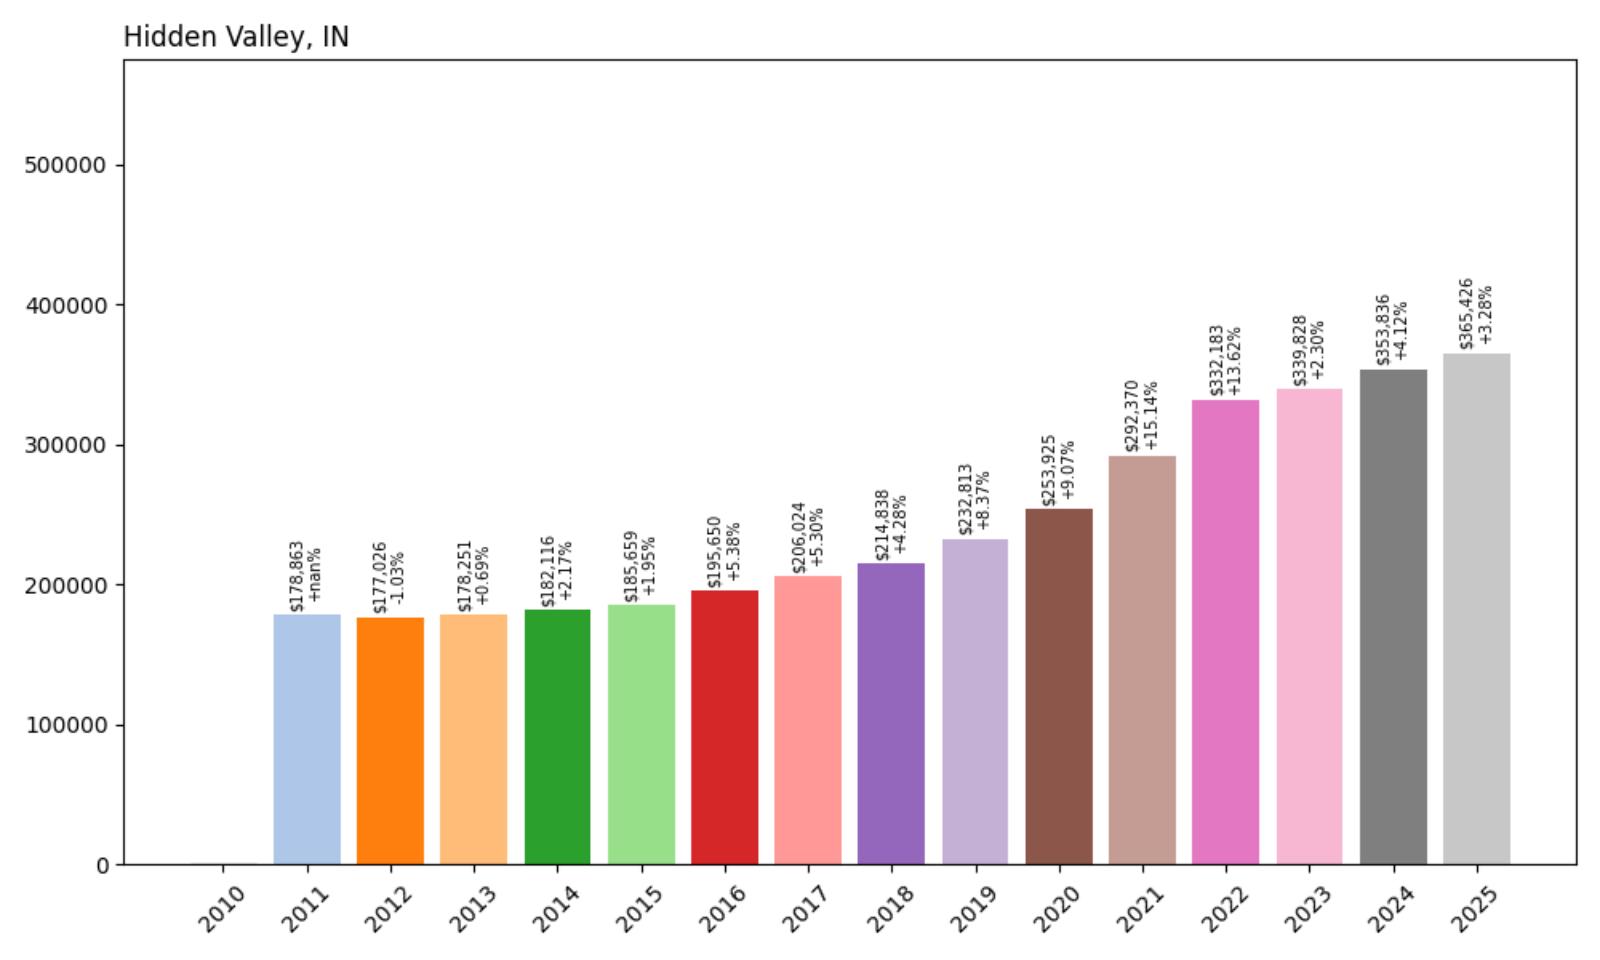
- 2011: $178,863
- 2012: $177,026 (−$1,837, −1.03% from previous year)
- 2013: $178,251 (+$1,225, +0.69% from previous year)
- 2014: $182,116 (+$3,865, +2.17% from previous year)
- 2015: $185,659 (+$3,543, +1.95% from previous year)
- 2016: $195,650 (+$9,992, +5.38% from previous year)
- 2017: $206,024 (+$10,374, +5.30% from previous year)
- 2018: $214,838 (+$8,814, +4.28% from previous year)
- 2019: $232,813 (+$17,975, +8.37% from previous year)
- 2020: $253,925 (+$21,112, +9.07% from previous year)
- 2021: $292,370 (+$38,445, +15.14% from previous year)
- 2022: $332,183 (+$39,813, +13.62% from previous year)
- 2023: $339,828 (+$7,646, +2.30% from previous year)
- 2024: $353,836 (+$14,008, +4.12% from previous year)
- 2025: $365,426 (+$11,590, +3.28% from previous year)
Hidden Valley has delivered impressive returns for homeowners since 2011, with values more than doubling from $178,863 to $365,426. The community experienced particularly strong gains from 2019-2022, when prices surged over 42% in just three years. Despite the dramatic appreciation, Hidden Valley has maintained momentum with continued growth of over 3% in 2025, indicating sustained demand for this northern Indiana location.
Hidden Valley – Lakefront Living Drives Premium Pricing
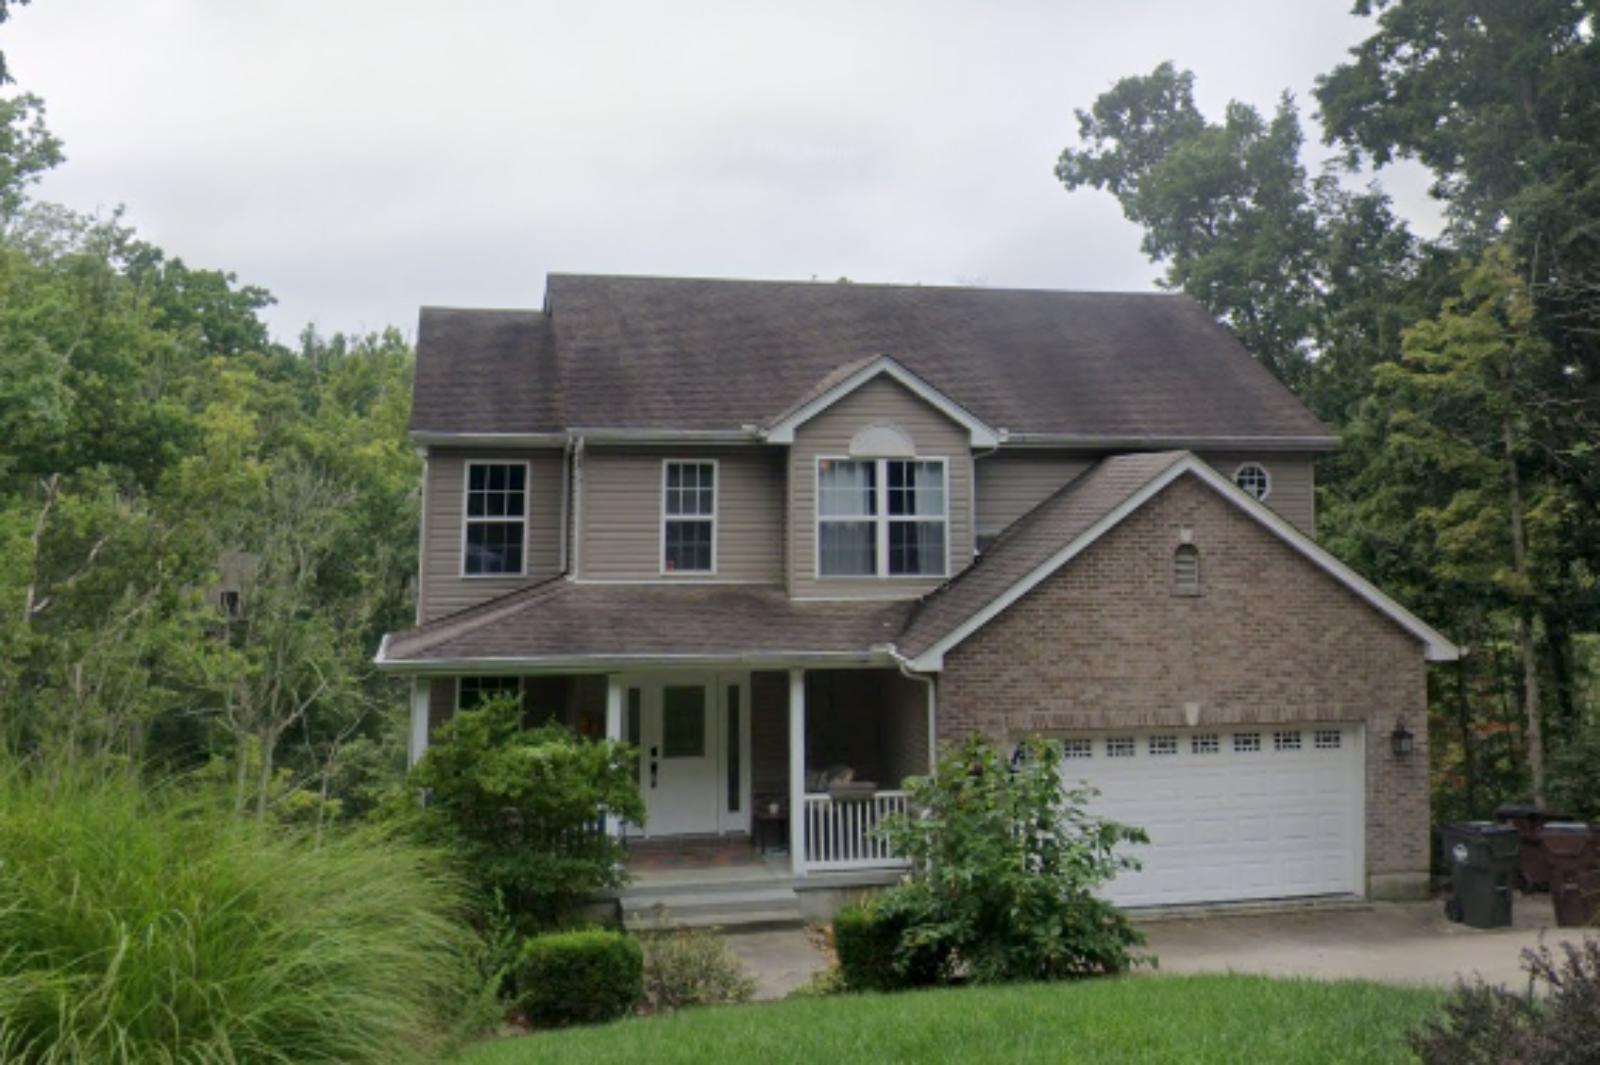
Hidden Valley represents one of Indiana’s premier residential communities, centered around Hidden Valley Lake in the southeastern corner of LaPorte County. This private lake community offers residents exclusive access to a 253-acre lake with swimming, boating, fishing, and year-round recreational activities. The development features deed restrictions and architectural controls that maintain property values and community standards, creating a resort-like atmosphere that appeals to both full-time residents and vacation home buyers seeking a retreat from urban life.
The community’s housing market reflects the premium that buyers place on lakefront and lake-access properties in Indiana. Hidden Valley offers a range of housing options from modest lake cottages to executive homes, all with access to community amenities including beaches, boat launches, and recreational facilities. The area’s proximity to Michigan City and the Indiana Dunes, combined with easy access to Interstate 94, makes it attractive to Chicago-area professionals seeking a weekend retreat or permanent relocation. As lakefront property becomes increasingly scarce and expensive throughout the Great Lakes region, communities like Hidden Valley that offer affordable access to water recreation continue to see strong appreciation in home values.
29. Westpoint – 109% Home Price Increase Since 2010

- 2010: $175,864
- 2011: $167,756 (−$8,108, −4.61% from previous year)
- 2012: $172,889 (+$5,133, +3.06% from previous year)
- 2013: $177,496 (+$4,607, +2.66% from previous year)
- 2014: $183,097 (+$5,601, +3.16% from previous year)
- 2015: $195,519 (+$12,421, +6.78% from previous year)
- 2016: $205,160 (+$9,642, +4.93% from previous year)
- 2017: $217,590 (+$12,429, +6.06% from previous year)
- 2018: $233,429 (+$15,839, +7.28% from previous year)
- 2019: $233,951 (+$522, +0.22% from previous year)
- 2020: $251,002 (+$17,051, +7.29% from previous year)
- 2021: $292,434 (+$41,433, +16.51% from previous year)
- 2022: $326,479 (+$34,045, +11.64% from previous year)
- 2023: $327,766 (+$1,287, +0.39% from previous year)
- 2024: $362,421 (+$34,655, +10.57% from previous year)
- 2025: $367,764 (+$5,343, +1.47% from previous year)
Westpoint has shown impressive long-term appreciation with a 109% increase since 2010, reaching $367,764 in 2025. The town experienced steady growth through the 2010s, with particularly strong performance in 2021-2022 when prices jumped nearly 28%. Notably, Westpoint saw a significant 10.57% increase in 2024, suggesting renewed buyer interest even as many markets cooled from pandemic highs.
Westpoint – Tippecanoe County’s Rising Star
Located in Tippecanoe County near Lafayette and West Lafayette, Westpoint benefits from its proximity to Purdue University and the broader economic ecosystem that surrounds one of Indiana’s major research universities. The small community of fewer than 1,000 residents offers a rural lifestyle while remaining accessible to employment, education, and cultural opportunities in the Lafayette area. This positioning has made Westpoint attractive to university employees, young professionals, and families seeking more space and value than urban markets provide.
Westpoint’s housing market reflects the spillover demand from Lafayette and West Lafayette, where Purdue University’s continued growth and economic impact have created pressure on housing supply. The town offers larger lots, newer construction options, and a quieter environment compared to the more densely developed university areas. Recent infrastructure improvements and the area’s reputation for good schools have enhanced Westpoint’s appeal to families. As Purdue continues to expand its research activities and attract technology companies to the region, communities like Westpoint that offer quality housing options within commuting distance are likely to see continued demand and price appreciation.
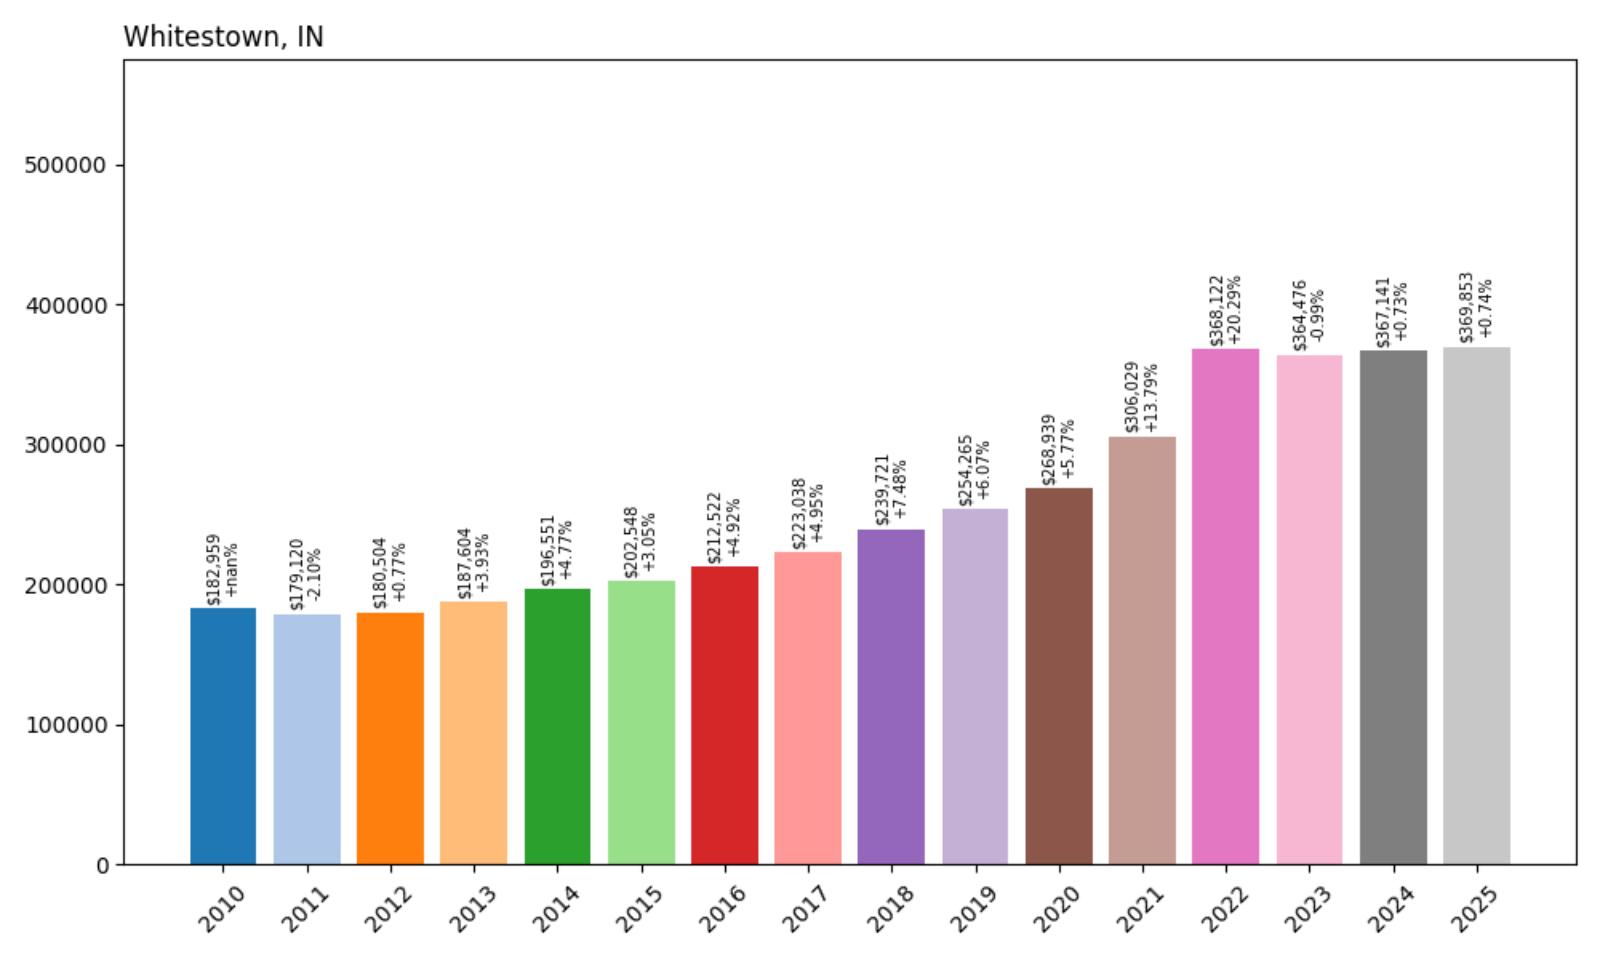
28. Whitestown – 102% Home Price Increase Since 2010
🔥 Would you like to save this?
- 2010: $182,959
- 2011: $179,120 (−$3,839, −2.10% from previous year)
- 2012: $180,504 (+$1,384, +0.77% from previous year)
- 2013: $187,604 (+$7,100, +3.93% from previous year)
- 2014: $196,551 (+$8,946, +4.77% from previous year)
- 2015: $202,548 (+$5,998, +3.05% from previous year)
- 2016: $212,522 (+$9,974, +4.92% from previous year)
- 2017: $223,038 (+$10,515, +4.95% from previous year)
- 2018: $239,721 (+$16,684, +7.48% from previous year)
- 2019: $254,265 (+$14,544, +6.07% from previous year)
- 2020: $268,939 (+$14,674, +5.77% from previous year)
- 2021: $306,029 (+$37,090, +13.79% from previous year)
- 2022: $368,122 (+$62,093, +20.29% from previous year)
- 2023: $364,476 (−$3,646, −0.99% from previous year)
- 2024: $367,141 (+$2,665, +0.73% from previous year)
- 2025: $369,853 (+$2,712, +0.74% from previous year)
Whitestown has achieved exactly a 102% increase in home values since 2010, with current prices of $369,853 representing a doubling from the baseline. The town experienced explosive growth in 2022 with a remarkable 20.29% single-year increase, though the market has since stabilized with modest annual gains. This pattern reflects Whitestown’s transformation from a small rural community to a thriving Indianapolis suburb during the period measured.
Whitestown – Boom County’s Fastest Growing Community
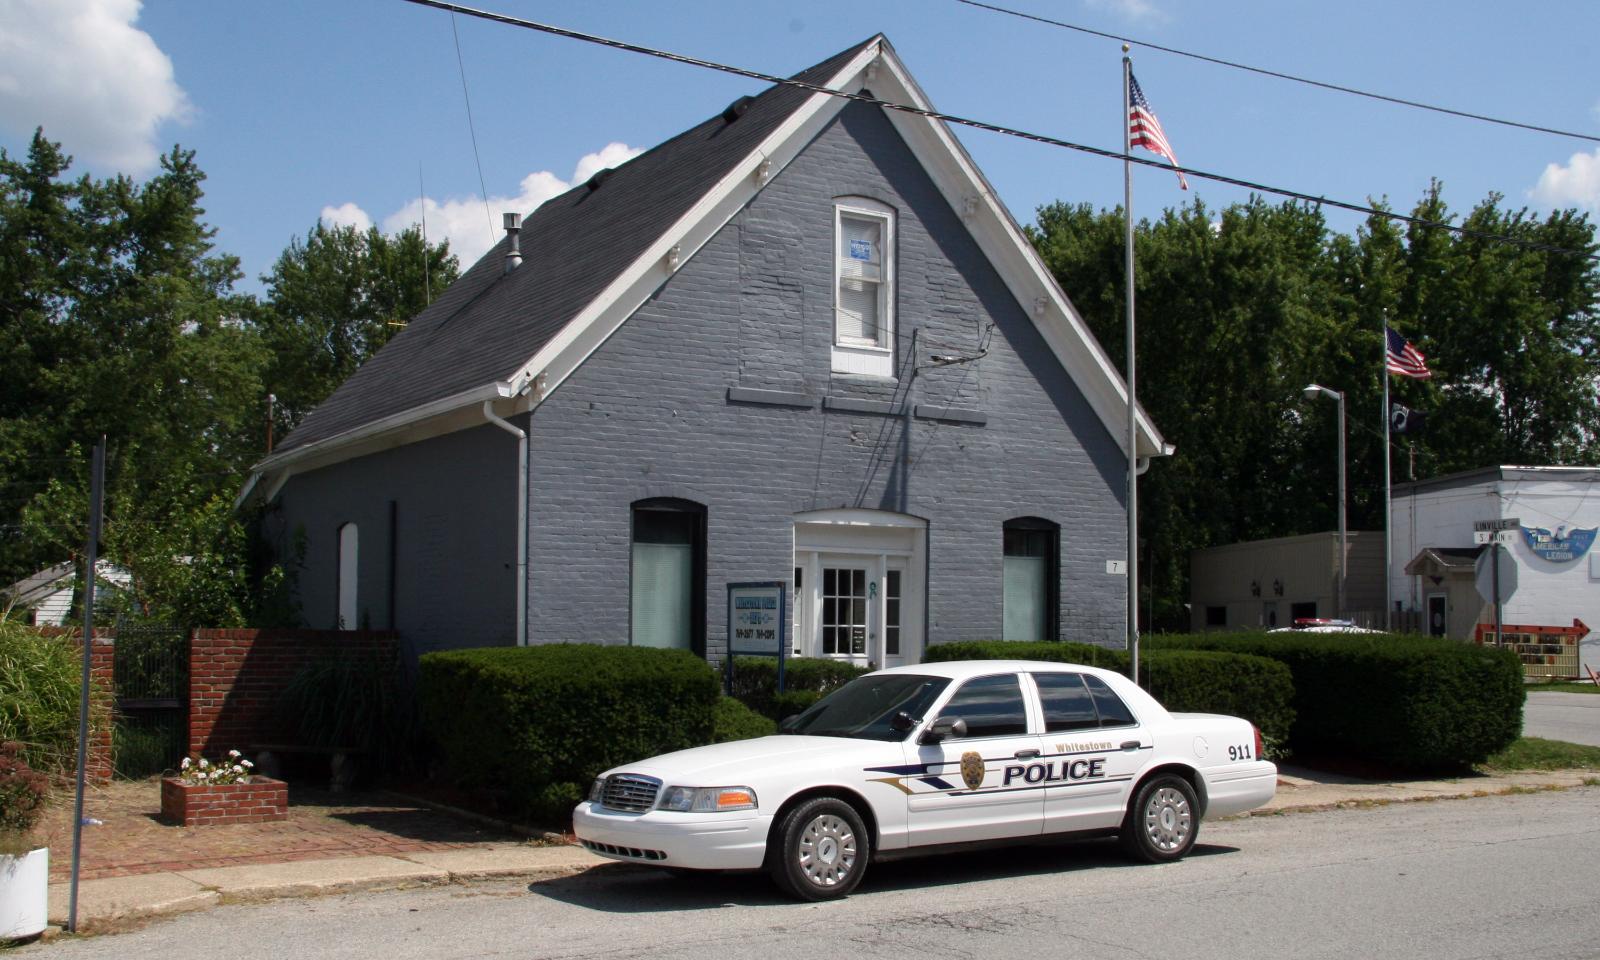
Whitestown represents one of Indiana’s most dramatic suburban success stories, transforming from a sleepy farming community of just 1,000 residents in 2000 to a bustling town of over 9,000 today. Located in Boone County northwest of Indianapolis, Whitestown has benefited enormously from the county’s designation as one of America’s fastest-growing areas. The town sits strategically along Interstate 65, providing easy access to Indianapolis while offering newer housing developments, excellent schools, and modern amenities that appeal to young families and professionals.
The community’s rapid growth has been carefully managed through comprehensive planning that emphasizes quality development and infrastructure investment. Whitestown has attracted major retail developments, corporate relocations, and residential projects that have created a self-sustaining economic ecosystem. The town’s location in Boone County provides access to some of Indiana’s highest-rated school districts, while its proximity to Indianapolis ensures abundant employment opportunities. This combination of accessibility, quality education, and planned growth has made Whitestown a prime destination for families relocating from Indianapolis or moving to the area from other states. As the community continues to build out its infrastructure and amenities, property values are likely to remain strong despite the recent market moderation.
27. Pittsboro – 112% Home Price Increase Since 2010

- 2010: $174,564
- 2011: $172,024 (−$2,541, −1.46% from previous year)
- 2012: $174,077 (+$2,053, +1.19% from previous year)
- 2013: $176,546 (+$2,469, +1.42% from previous year)
- 2014: $184,412 (+$7,866, +4.46% from previous year)
- 2015: $192,431 (+$8,019, +4.35% from previous year)
- 2016: $200,964 (+$8,533, +4.43% from previous year)
- 2017: $212,041 (+$11,077, +5.51% from previous year)
- 2018: $225,235 (+$13,194, +6.22% from previous year)
- 2019: $236,426 (+$11,191, +4.97% from previous year)
- 2020: $254,405 (+$17,979, +7.60% from previous year)
- 2021: $296,581 (+$42,177, +16.58% from previous year)
- 2022: $345,674 (+$49,092, +16.55% from previous year)
- 2023: $351,580 (+$5,906, +1.71% from previous year)
- 2024: $364,475 (+$12,896, +3.67% from previous year)
- 2025: $369,954 (+$5,479, +1.50% from previous year)
Pittsboro has delivered strong returns with a 112% increase since 2010, reaching $369,954 in 2025. The town showed remarkable consistency throughout the 2010s with steady 4-6% annual gains, before experiencing explosive growth of over 33% during 2021-2022. The market has since normalized with more modest appreciation, but continues to trend upward. This pattern reflects Pittsboro’s evolution from a rural outpost to a sought-after Indianapolis suburb.
Pittsboro – Small Town Charm Meets Big City Access
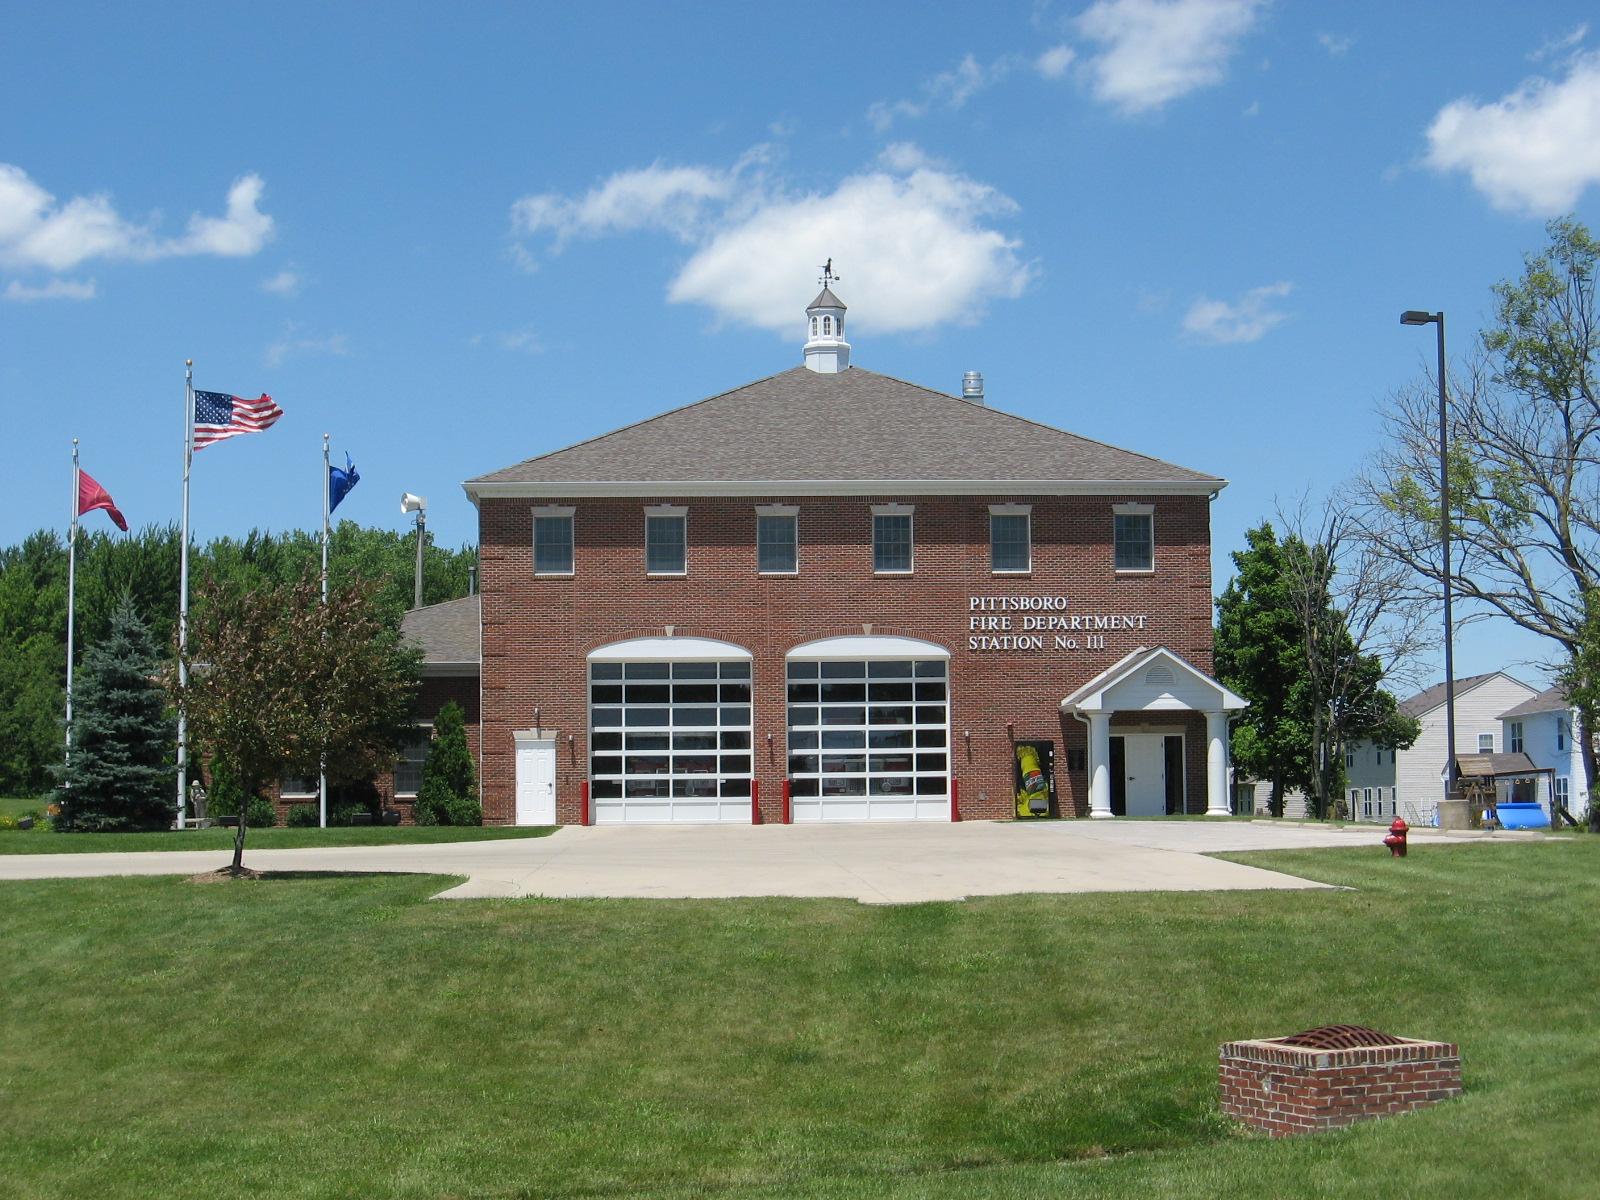
Pittsboro serves as the county seat of Hendricks County and embodies the appeal of small-town Indiana living within easy reach of Indianapolis. The community of approximately 3,500 residents has successfully maintained its historic downtown charm while accommodating steady growth and development. Located just 20 miles west of Indianapolis along US Highway 136, Pittsboro offers residents a reasonable commute to the capital city while providing the benefits of lower costs, less traffic, and a stronger sense of community that characterizes rural Indiana.
The town’s housing market has benefited significantly from Hendricks County’s reputation as one of the most desirable places to live in the Indianapolis metropolitan area. Pittsboro offers a range of housing options from historic homes in the town center to newer subdivisions on the periphery, all at prices well below those found in more developed suburbs. The community features good schools, recreational facilities, and annual events that foster neighborhood connections. As Indianapolis continues to expand westward and remote work enables greater location flexibility, Pittsboro’s combination of affordability, accessibility, and quality of life positions it well for continued appreciation in home values.
26. West Lafayette – 98% Home Price Increase Since 2010
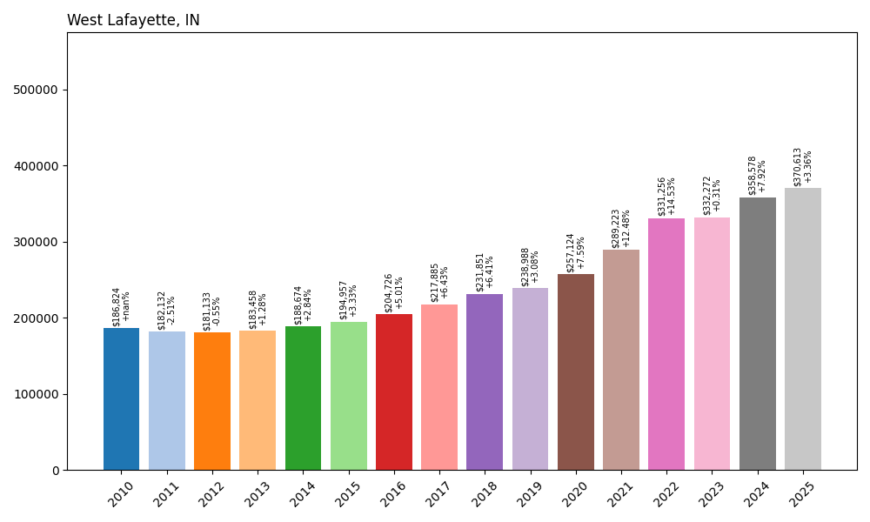
- 2010: $186,824
- 2011: $182,132 (−$4,692, −2.51% from previous year)
- 2012: $181,133 (−$999, −0.55% from previous year)
- 2013: $183,458 (+$2,325, +1.28% from previous year)
- 2014: $188,674 (+$5,216, +2.84% from previous year)
- 2015: $194,957 (+$6,283, +3.33% from previous year)
- 2016: $204,726 (+$9,769, +5.01% from previous year)
- 2017: $217,885 (+$13,159, +6.43% from previous year)
- 2018: $231,851 (+$13,966, +6.41% from previous year)
- 2019: $238,988 (+$7,137, +3.08% from previous year)
- 2020: $257,124 (+$18,137, +7.59% from previous year)
- 2021: $289,223 (+$32,099, +12.48% from previous year)
- 2022: $331,256 (+$42,033, +14.53% from previous year)
- 2023: $332,272 (+$1,016, +0.31% from previous year)
- 2024: $358,578 (+$26,306, +7.92% from previous year)
- 2025: $370,613 (+$12,035, +3.36% from previous year)
West Lafayette has nearly doubled in value since 2010, with a 98% increase bringing current home prices to $370,613. The university town experienced steady growth through the 2010s, accelerating significantly during 2021-2022 with a combined 27% increase over two years. Notably, the market saw strong growth of nearly 8% in 2024, indicating continued demand despite broader market cooling trends.
West Lafayette – University Town Benefits From Purdue’s Excellence
Home to Purdue University, West Lafayette represents one of Indiana’s premier college towns, where academic excellence meets economic stability. The city of approximately 45,000 residents benefits enormously from Purdue’s status as a world-renowned research university, particularly in engineering, technology, and agriculture. This creates a unique housing market driven by faculty, staff, graduate students, and professionals working in the university’s expanding research enterprises. The constant influx of highly educated residents and the university’s ongoing growth initiatives provide sustained demand for quality housing.
West Lafayette’s housing market reflects the premium that buyers place on proximity to top-tier educational and research facilities. The city offers diverse housing options from historic neighborhoods near campus to newer developments that cater to faculty and professionals. Purdue’s continued investment in facilities, research programs, and technology initiatives has strengthened the local economy and attracted businesses that support the university ecosystem. The recent completion of major campus projects and continued enrollment growth suggest that demand for housing in West Lafayette will remain robust. As the university expands its research footprint and attracts more high-tech companies to the area, property values are likely to continue their upward trajectory.
25. Shipshewana – 131% Home Price Increase Since 2010
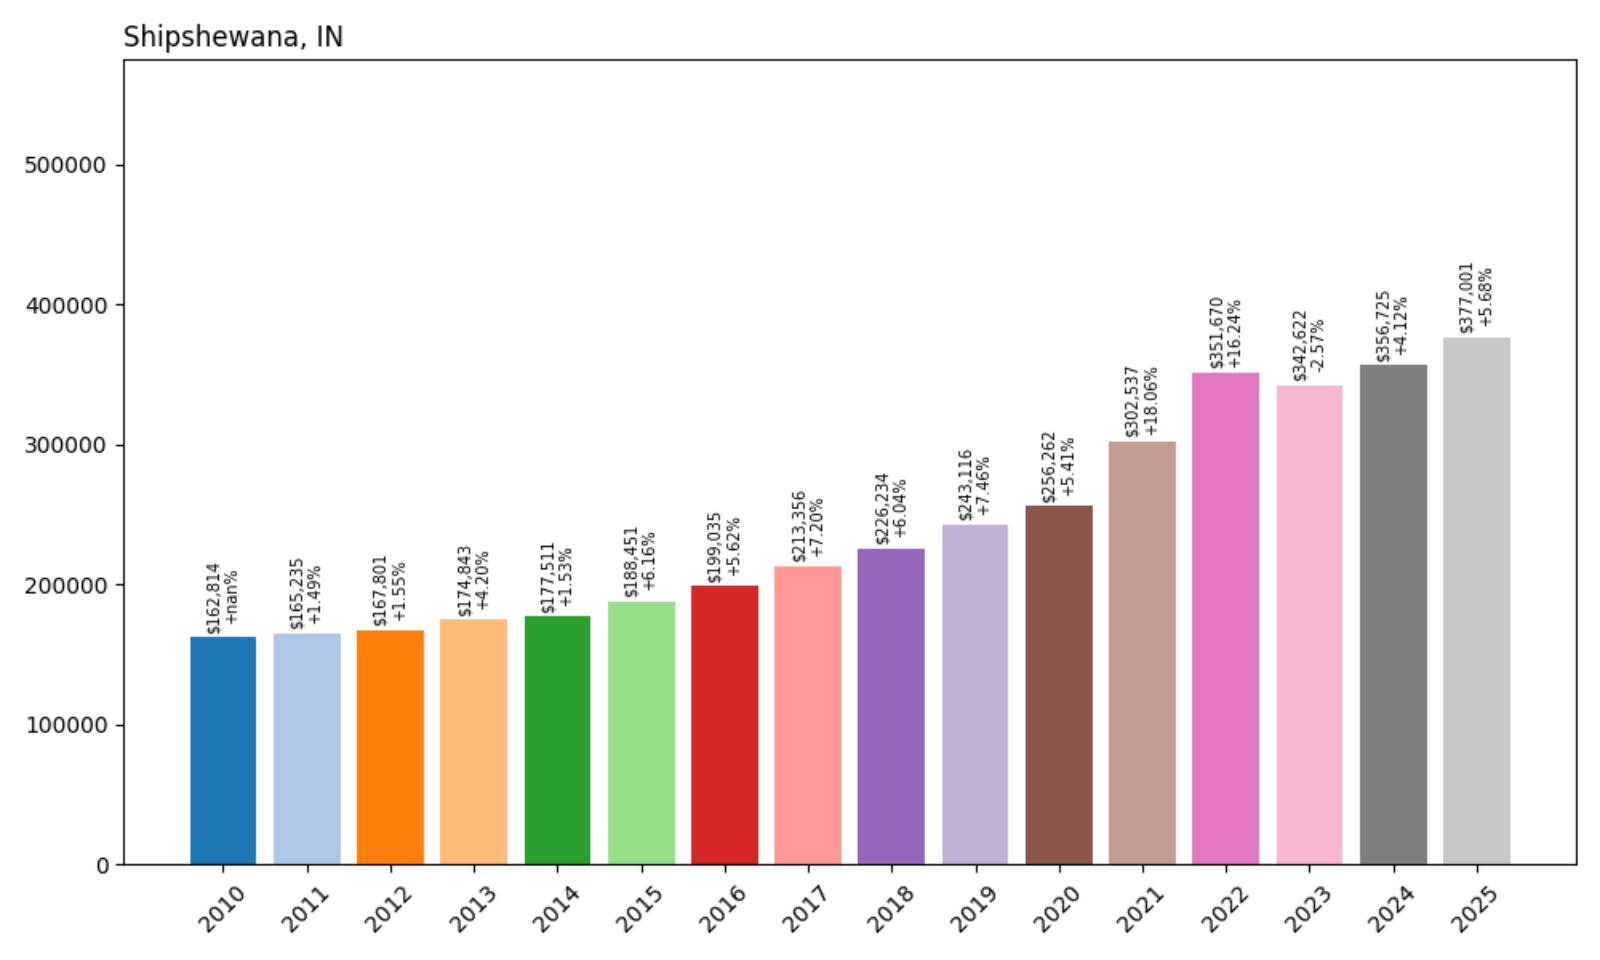
- 2010: $162,814
- 2011: $165,235 (+$2,420, +1.49% from previous year)
- 2012: $167,801 (+$2,566, +1.55% from previous year)
- 2013: $174,843 (+$7,043, +4.20% from previous year)
- 2014: $177,511 (+$2,668, +1.53% from previous year)
- 2015: $188,451 (+$10,940, +6.16% from previous year)
- 2016: $199,035 (+$10,583, +5.62% from previous year)
- 2017: $213,356 (+$14,321, +7.20% from previous year)
- 2018: $226,234 (+$12,878, +6.04% from previous year)
- 2019: $243,116 (+$16,882, +7.46% from previous year)
- 2020: $256,262 (+$13,146, +5.41% from previous year)
- 2021: $302,537 (+$46,276, +18.06% from previous year)
- 2022: $351,670 (+$49,132, +16.24% from previous year)
- 2023: $342,622 (−$9,048, −2.57% from previous year)
- 2024: $356,725 (+$14,103, +4.12% from previous year)
- 2025: $377,001 (+$20,276, +5.68% from previous year)
Shipshewana has delivered exceptional returns with a 131% increase since 2010, reaching $377,001 in 2025. The town experienced consistent growth throughout the 2010s, with particularly strong performance from 2017-2019 when prices increased over 20% in three years. The pandemic years brought explosive growth of over 34% in 2021-2022, and despite a brief correction in 2023, values have resumed their upward trend with nearly 6% growth in 2025.
Shipshewana – Tourism and Tradition Drive Unique Market
Shipshewana stands as one of Indiana’s most distinctive communities, serving as the unofficial capital of the state’s Amish region in LaGrange County. The town of approximately 650 residents has built a thriving economy around its unique cultural heritage, hosting one of the Midwest’s largest flea markets and attracting hundreds of thousands of visitors annually who come to experience Amish craftsmanship, cuisine, and traditional ways of life. This tourism economy has created robust demand for both residential and investment properties as entrepreneurs seek to capitalize on the area’s popularity.
The housing market in Shipshewana reflects the community’s dual character as both a working Amish settlement and a major tourist destination. Properties range from traditional farmhouses to modern homes designed for professionals who work in the tourism industry or commute to nearby cities. The area’s reputation for superior craftsmanship, particularly in furniture and construction, means that homes often feature high-quality materials and workmanship that support premium pricing. As interest in authentic cultural experiences continues to grow and the Amish community maintains its commitment to traditional crafts, Shipshewana’s unique market position should support continued appreciation in property values.
24. Leo-Cedarville – 110% Home Price Increase Since 2010
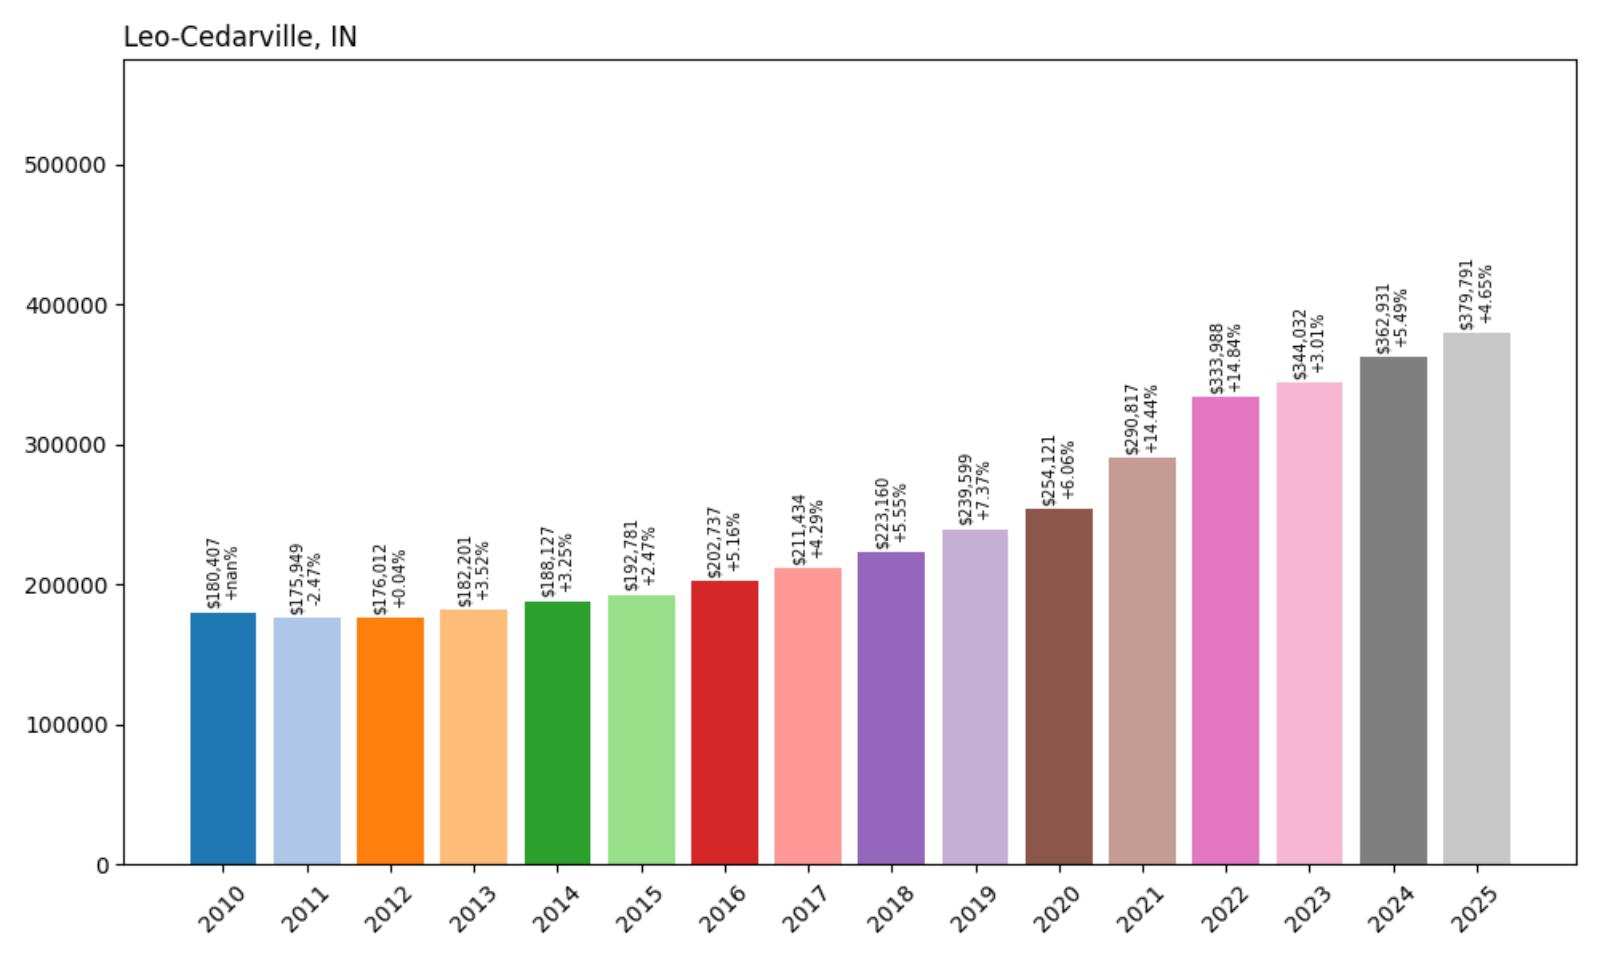
- 2010: $180,407
- 2011: $175,949 (−$4,458, −2.47% from previous year)
- 2012: $176,012 (+$63, +0.04% from previous year)
- 2013: $182,201 (+$6,188, +3.52% from previous year)
- 2014: $188,127 (+$5,926, +3.25% from previous year)
- 2015: $192,781 (+$4,654, +2.47% from previous year)
- 2016: $202,737 (+$9,956, +5.16% from previous year)
- 2017: $211,434 (+$8,697, +4.29% from previous year)
- 2018: $223,160 (+$11,726, +5.55% from previous year)
- 2019: $239,599 (+$16,439, +7.37% from previous year)
- 2020: $254,121 (+$14,523, +6.06% from previous year)
- 2021: $290,817 (+$36,696, +14.44% from previous year)
- 2022: $333,988 (+$43,171, +14.84% from previous year)
- 2023: $344,032 (+$10,045, +3.01% from previous year)
- 2024: $362,931 (+$18,899, +5.49% from previous year)
- 2025: $379,791 (+$16,860, +4.65% from previous year)
Leo-Cedarville has achieved a 110% increase in home values since 2010, with current prices of $379,791 representing more than double the baseline. The community showed steady acceleration through the 2010s, with particularly strong performance from 2018-2020 when prices increased nearly 20% over three years. The pandemic years brought additional gains of over 29%, and momentum has continued with nearly 5% growth in 2025.
Leo-Cedarville – Fort Wayne Suburb Benefits From Urban Growth
Leo-Cedarville represents the successful suburban expansion of northeast Indiana, serving as a desirable residential community for professionals working in Fort Wayne and the broader Allen County area. The town of approximately 3,800 residents combines small-town atmosphere with access to the employment, cultural, and educational opportunities of Indiana’s second-largest city. Located just 15 miles northeast of downtown Fort Wayne, Leo-Cedarville offers residents a reasonable commute while providing the benefits of newer housing, good schools, and a family-friendly environment.
The community’s housing market reflects Fort Wayne’s economic diversification and population growth over the past decade. Leo-Cedarville has attracted families seeking alternatives to urban living without sacrificing career opportunities or modern amenities. The town features well-planned residential developments, quality schools, and recreational facilities that appeal to young professionals and families. Fort Wayne’s continued economic development, including growth in healthcare, technology, and manufacturing sectors, has strengthened demand for suburban housing options like those found in Leo-Cedarville. As the Fort Wayne metropolitan area continues to grow and evolve, communities that offer quality housing at reasonable prices are likely to see sustained appreciation.
23. Unionville – 122% Home Price Increase Since 2010

- 2010: $171,762
- 2011: $179,085 (+$7,324, +4.26% from previous year)
- 2012: $177,851 (−$1,235, −0.69% from previous year)
- 2013: $179,389 (+$1,538, +0.86% from previous year)
- 2014: $189,648 (+$10,259, +5.72% from previous year)
- 2015: $200,346 (+$10,698, +5.64% from previous year)
- 2016: $209,924 (+$9,578, +4.78% from previous year)
- 2017: $214,861 (+$4,937, +2.35% from previous year)
- 2018: $227,602 (+$12,741, +5.93% from previous year)
- 2019: $240,732 (+$13,130, +5.77% from previous year)
- 2020: $252,642 (+$11,909, +4.95% from previous year)
- 2021: $305,022 (+$52,381, +20.73% from previous year)
- 2022: $358,078 (+$53,055, +17.39% from previous year)
- 2023: $357,065 (−$1,013, −0.28% from previous year)
- 2024: $367,621 (+$10,556, +2.96% from previous year)
- 2025: $381,443 (+$13,822, +3.76% from previous year)
Unionville has demonstrated remarkable appreciation with a 122% increase since 2010, reaching $381,443 in 2025. The community maintained steady growth throughout the 2010s, then experienced explosive gains of over 38% during 2021-2022. The market briefly plateaued in 2023 but has resumed growth with nearly 4% appreciation in 2025, indicating continued buyer interest in this southern Indiana location.
Unionville – University Proximity Drives Consistent Demand
Unionville benefits significantly from its proximity to Indiana University in nearby Bloomington, creating a housing market influenced by both university-related demand and the broader appeal of south-central Indiana. The small community of approximately 300 residents offers a rural setting within easy reach of one of the state’s major universities and the cultural amenities that accompany a college town. This positioning attracts faculty, staff, graduate students, and professionals who value space and tranquility while maintaining access to educational and employment opportunities.
The town’s housing market reflects the stability that comes from university-related demand combined with the natural beauty of the region. Unionville sits in an area known for its rolling hills, forests, and outdoor recreation opportunities, including proximity to Brown County State Park and Lake Monroe. This combination of natural amenities and university access creates unique appeal for buyers seeking both lifestyle and professional advantages. As Indiana University continues to grow and evolve, and as remote work enables greater location flexibility, communities like Unionville that offer quality of life benefits at reasonable prices are positioned for continued appreciation.
22. New Palestine – 112% Home Price Increase Since 2010

🔥 Would you like to save this?
- 2010: $180,278
- 2011: $178,157 (−$2,121, −1.18% from previous year)
- 2012: $182,795 (+$4,638, +2.60% from previous year)
- 2013: $190,326 (+$7,531, +4.12% from previous year)
- 2014: $199,584 (+$9,258, +4.86% from previous year)
- 2015: $203,987 (+$4,402, +2.21% from previous year)
- 2016: $210,469 (+$6,483, +3.18% from previous year)
- 2017: $228,330 (+$17,860, +8.49% from previous year)
- 2018: $242,976 (+$14,646, +6.41% from previous year)
- 2019: $255,978 (+$13,002, +5.35% from previous year)
- 2020: $271,766 (+$15,788, +6.17% from previous year)
- 2021: $312,919 (+$41,153, +15.14% from previous year)
- 2022: $364,512 (+$51,593, +16.49% from previous year)
- 2023: $365,409 (+$897, +0.25% from previous year)
- 2024: $376,162 (+$10,753, +2.94% from previous year)
- 2025: $381,931 (+$5,769, +1.53% from previous year)
New Palestine has achieved a 112% increase in home values since 2010, with current prices reaching $381,931. The town showed strong momentum through the 2010s, particularly accelerating from 2017-2020 when values increased over 19% in four years. The pandemic years brought additional gains of over 31%, and while growth has moderated, the market continues to appreciate steadily with consistent year-over-year increases.
New Palestine – Eastern Suburb’s Educational Excellence
New Palestine has established itself as one of the premier eastern suburbs of Indianapolis, building a reputation around excellent schools and family-friendly neighborhoods. The town of approximately 2,300 residents sits in Hancock County, offering residents access to Indianapolis employment while providing the benefits of small-town living. New Palestine Community School Corporation consistently ranks among Indiana’s top school districts, making the area particularly attractive to families with children who prioritize educational quality and want to avoid the higher costs of more established suburbs.
The community’s housing market reflects the premium that families place on educational excellence and the ongoing eastward expansion of Indianapolis. New Palestine offers a range of housing options from established neighborhoods to newer developments, all benefiting from the town’s commitment to maintaining high standards for both residential and commercial development. The area’s location provides reasonable access to Indianapolis while avoiding much of the traffic and congestion associated with more densely developed corridors. As Indianapolis continues to grow and families seek quality educational options outside the urban core, communities like New Palestine that combine excellent schools with reasonable housing costs are likely to see continued strong demand and price appreciation.
21. McCordsville – 107% Home Price Increase Since 2010
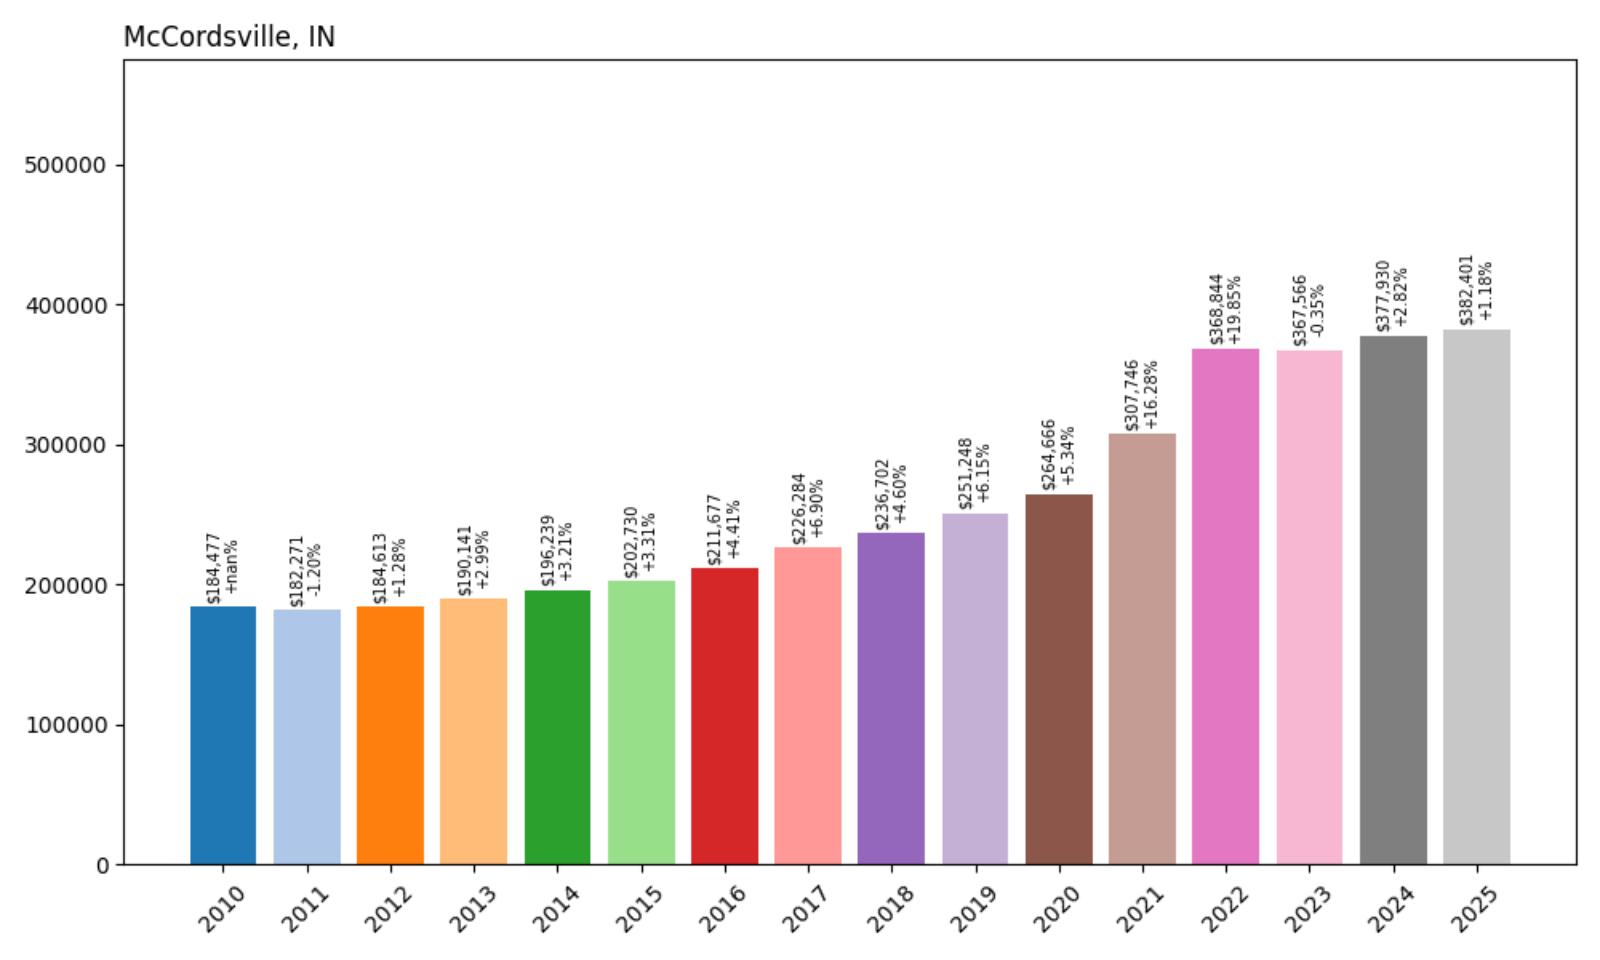
- 2010: $184,477
- 2011: $182,271 (−$2,206, −1.20% from previous year)
- 2012: $184,613 (+$2,342, +1.28% from previous year)
- 2013: $190,141 (+$5,529, +2.99% from previous year)
- 2014: $196,239 (+$6,098, +3.21% from previous year)
- 2015: $202,730 (+$6,491, +3.31% from previous year)
- 2016: $211,677 (+$8,947, +4.41% from previous year)
- 2017: $226,284 (+$14,608, +6.90% from previous year)
- 2018: $236,702 (+$10,418, +4.60% from previous year)
- 2019: $251,248 (+$14,546, +6.15% from previous year)
- 2020: $264,666 (+$13,418, +5.34% from previous year)
- 2021: $307,746 (+$43,079, +16.28% from previous year)
- 2022: $368,844 (+$61,098, +19.85% from previous year)
- 2023: $367,566 (−$1,278, −0.35% from previous year)
- 2024: $377,930 (+$10,364, +2.82% from previous year)
- 2025: $382,401 (+$4,471, +1.18% from previous year)
McCordsville has delivered solid returns with a 107% increase since 2010, bringing current home values to $382,401. The town experienced steady growth through the 2010s, accelerating significantly from 2017-2020 when prices rose over 17% in four years. The pandemic years brought explosive growth of over 36%, with particularly strong performance in 2022. While the market has moderated from those peaks, values continue to trend upward with modest annual gains.
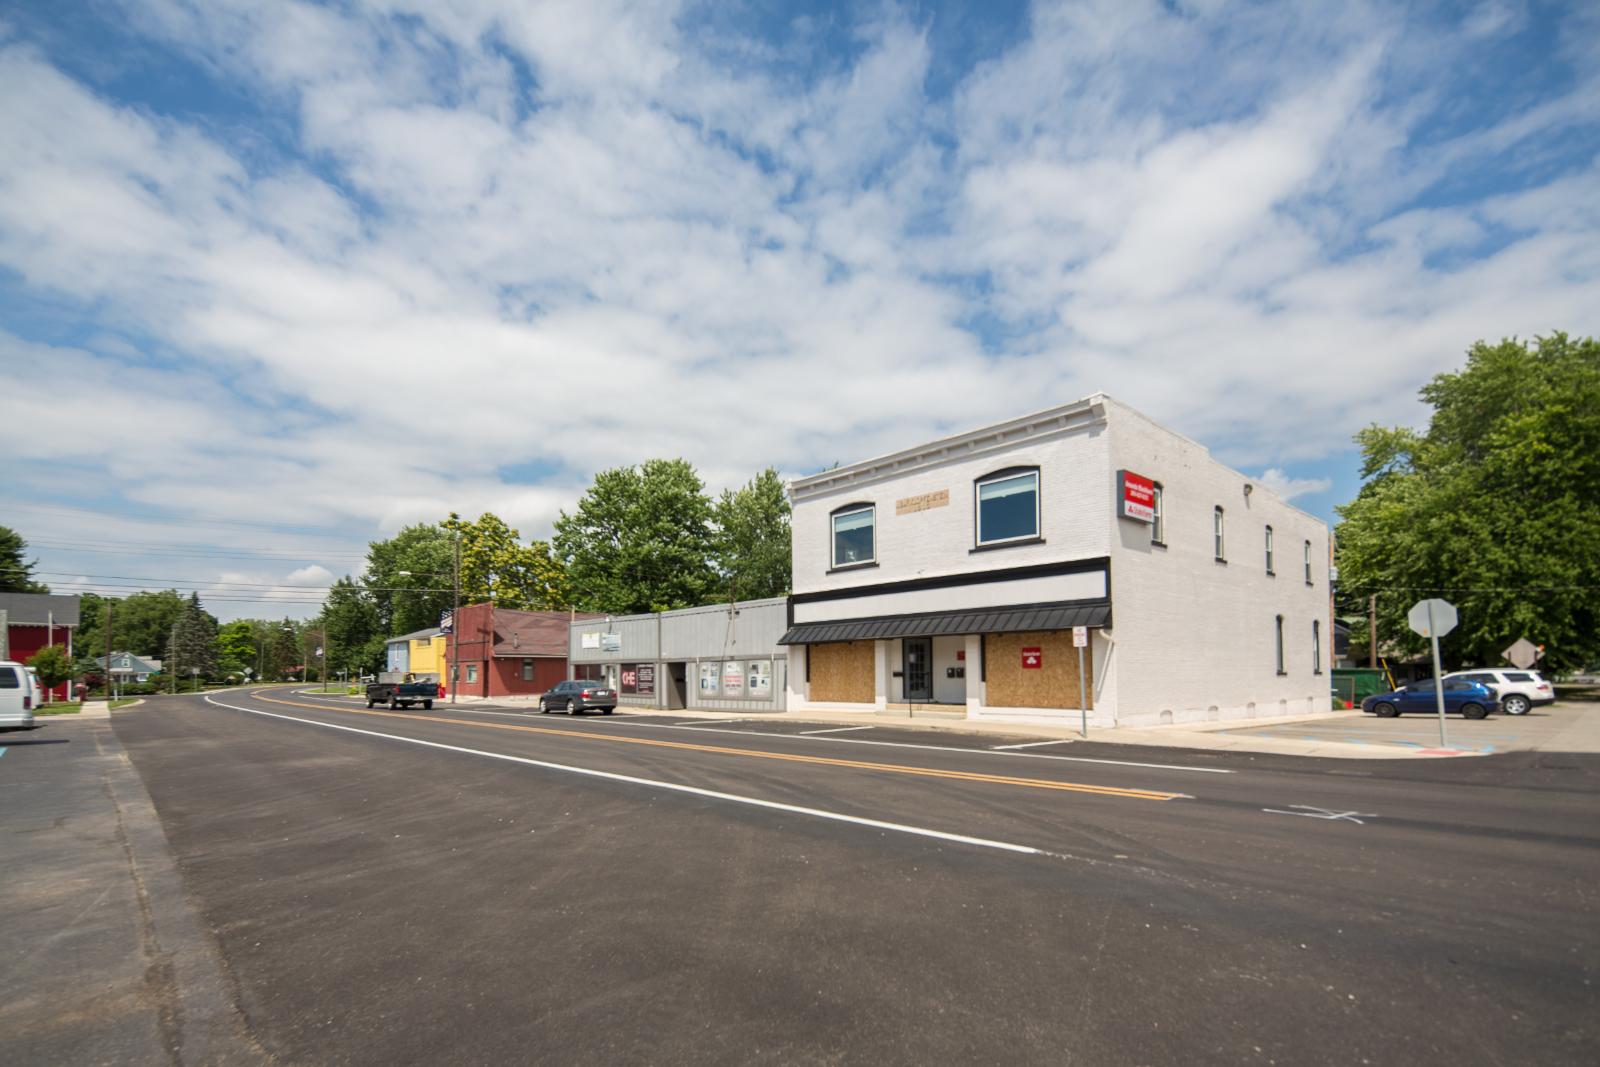
McCordsville – Hancock County’s Family Haven
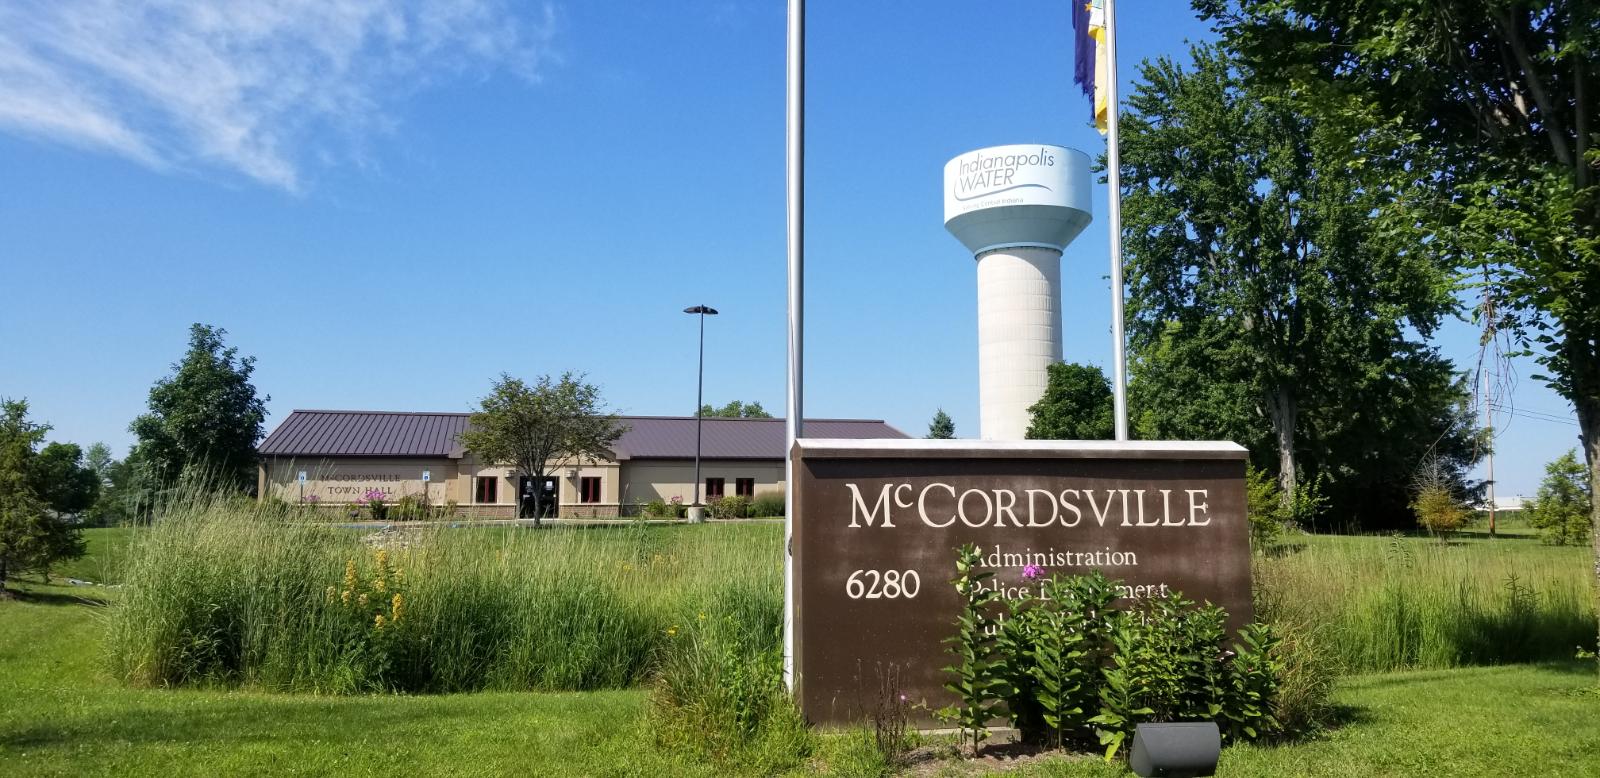
McCordsville represents one of the most successful suburban communities in the Indianapolis metropolitan area, combining rapid growth with careful planning to create an ideal environment for families. The town of approximately 7,500 residents has grown from a small farming community to a thriving suburb while maintaining its small-town character and commitment to quality development. Located in Hancock County just northeast of Indianapolis, McCordsville offers residents easy access to urban employment opportunities while providing newer housing, excellent schools, and abundant recreational amenities.
The community’s housing market benefits from McCordsville’s reputation as a well-managed, family-friendly destination with outstanding schools and recreational facilities. The town has invested heavily in parks, sports complexes, and community amenities that enhance quality of life and support property values. McCordsville’s location provides convenient access to Indianapolis via Interstate 70 while avoiding the higher costs and congestion of more established suburbs. The community has successfully attracted young families and professionals who appreciate the combination of modern amenities, good governance, and reasonable housing costs. As the Indianapolis metropolitan area continues to expand eastward, McCordsville’s proven track record of managing growth while maintaining quality of life positions it well for continued appreciation in home values.
20. Needham – 158% Home Price Increase Since 2010
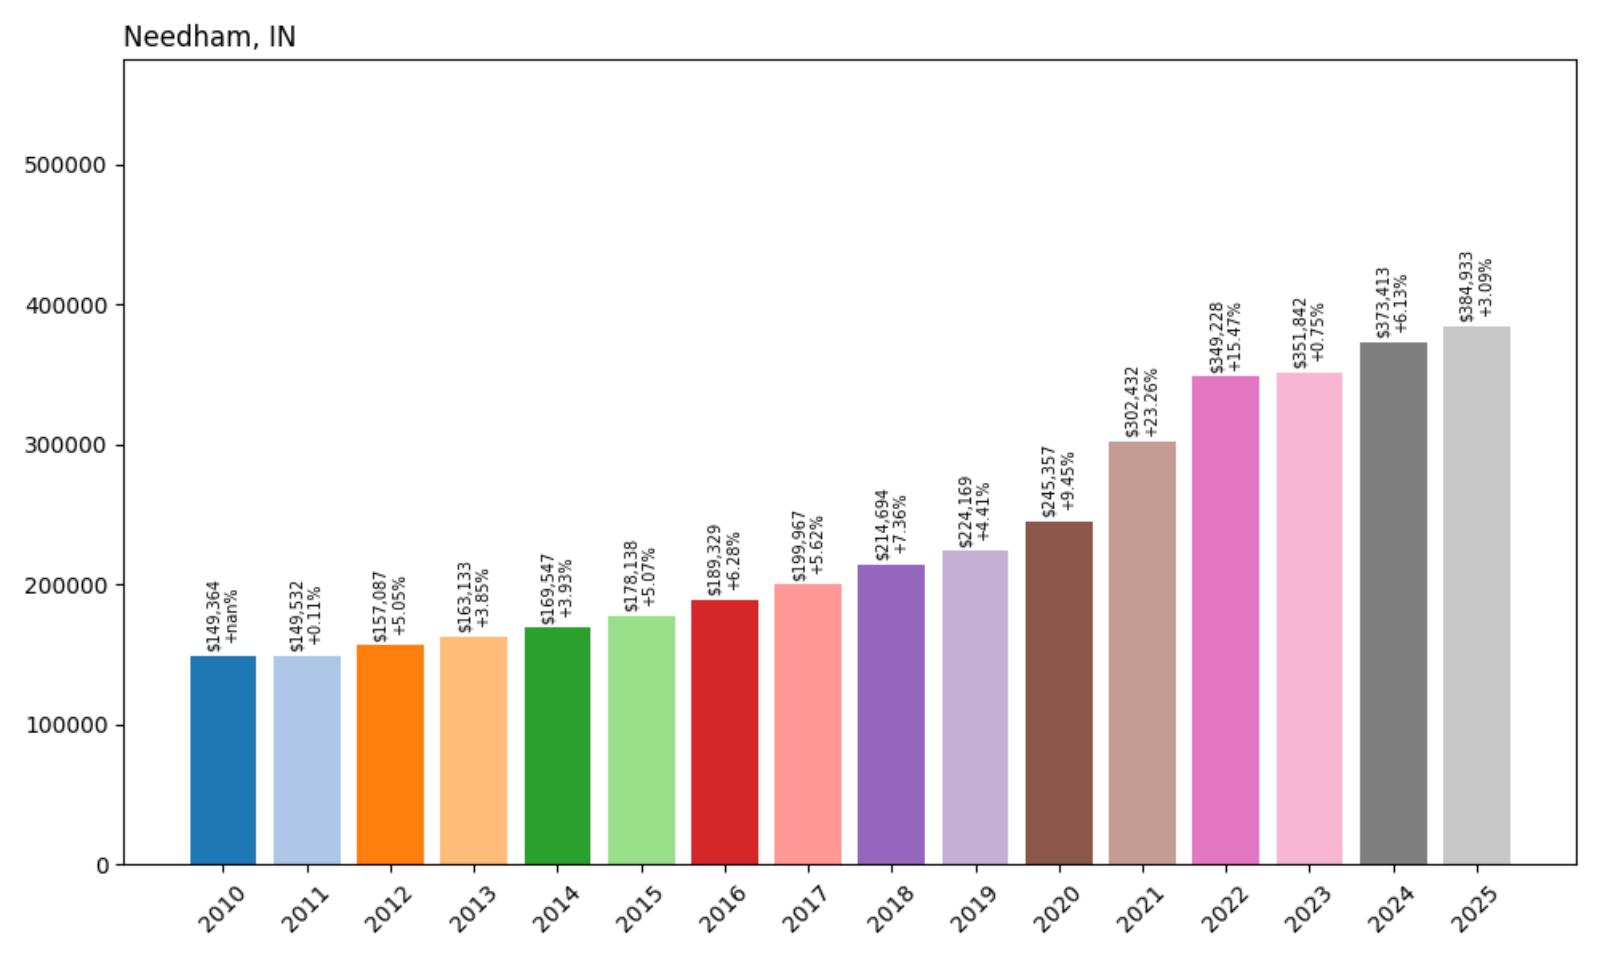
- 2010: $149,364
- 2011: $149,532 (+$168, +0.11% from previous year)
- 2012: $157,087 (+$7,555, +5.05% from previous year)
- 2013: $163,133 (+$6,046, +3.85% from previous year)
- 2014: $169,547 (+$6,414, +3.93% from previous year)
- 2015: $178,138 (+$8,591, +5.07% from previous year)
- 2016: $189,329 (+$11,190, +6.28% from previous year)
- 2017: $199,967 (+$10,639, +5.62% from previous year)
- 2018: $214,694 (+$14,726, +7.36% from previous year)
- 2019: $224,169 (+$9,475, +4.41% from previous year)
- 2020: $245,357 (+$21,188, +9.45% from previous year)
- 2021: $302,432 (+$57,075, +23.26% from previous year)
- 2022: $349,228 (+$46,796, +15.47% from previous year)
- 2023: $351,842 (+$2,613, +0.75% from previous year)
- 2024: $373,413 (+$21,571, +6.13% from previous year)
- 2025: $384,933 (+$11,520, +3.09% from previous year)
Needham stands out with an exceptional 158% increase in home values since 2010, reaching $384,933 in 2025. The small community showed consistent growth throughout the 2010s, with particularly strong performance from 2018-2020 when prices increased over 21% in three years. The pandemic year of 2021 brought explosive growth of over 23%, followed by continued strong gains. This rural Indiana location has delivered some of the highest returns on the entire list.
Needham – Rural Charm Meets Investment Opportunity
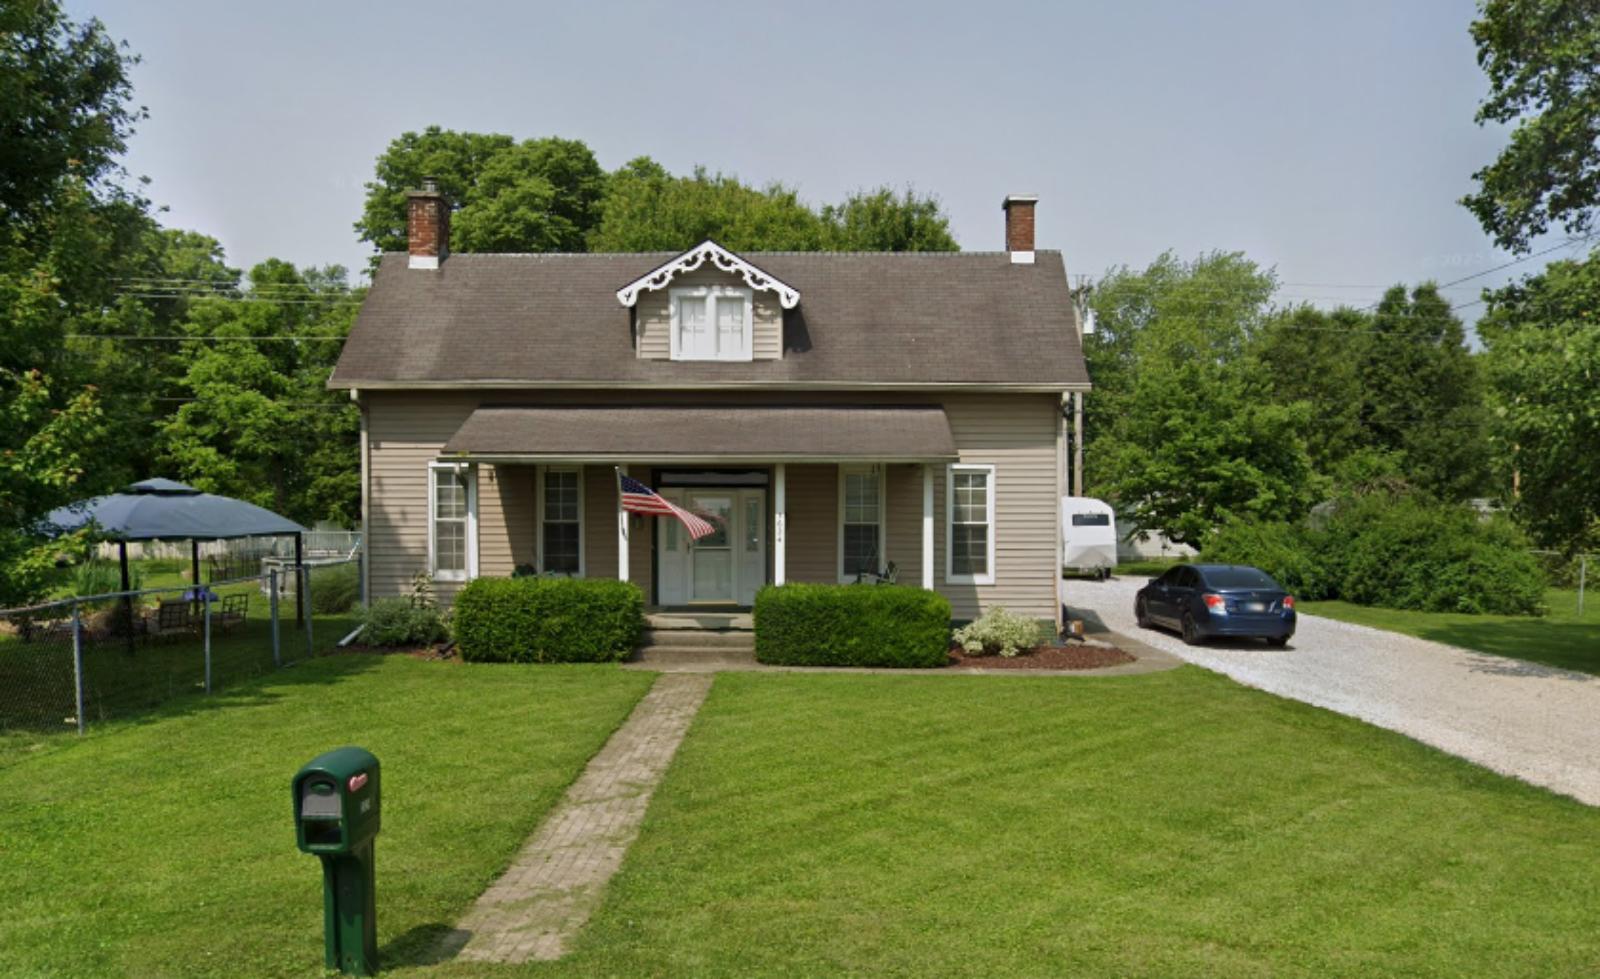
Needham represents one of Indiana’s most remarkable housing success stories, demonstrating how even the smallest communities can experience significant appreciation when they offer the right combination of location, value, and appeal. This tiny town in Johnson County, with fewer than 200 residents, has benefited from its proximity to Indianapolis and the broader trend toward rural living that accelerated during the pandemic. The community offers buyers the opportunity to own larger properties at relatively affordable prices while maintaining reasonable access to urban employment and amenities.
The housing market in Needham reflects the growing appeal of rural living among buyers seeking space, privacy, and value. The town’s location in Johnson County provides access to good schools and services while offering the peaceful, agricultural setting that many families crave. Properties in Needham typically feature larger lots and older homes with character, appealing to buyers interested in renovation projects or those simply seeking more space than urban markets provide. As remote work continues to enable location independence and families prioritize quality of life over proximity to employment centers, small communities like Needham that offer authentic rural experiences at reasonable prices are likely to continue seeing strong demand and appreciation.
19. Noblesville – 113% Home Price Increase Since 2010
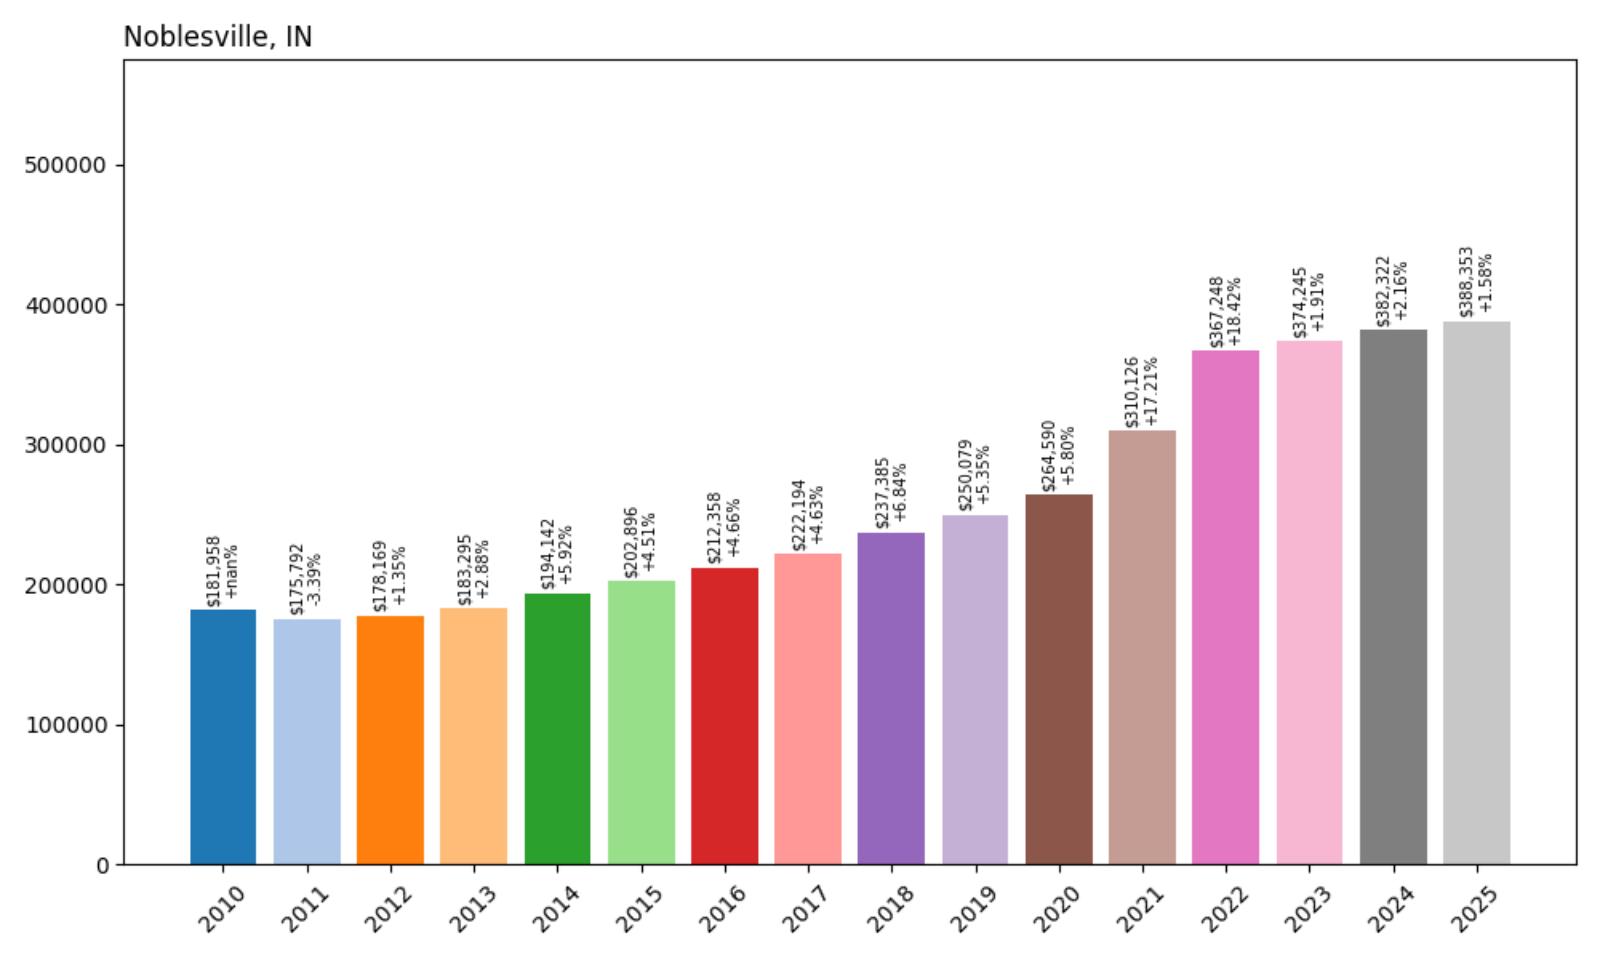
- 2010: $181,958
- 2011: $175,792 (−$6,166, −3.39% from previous year)
- 2012: $178,169 (+$2,377, +1.35% from previous year)
- 2013: $183,295 (+$5,126, +2.88% from previous year)
- 2014: $194,142 (+$10,848, +5.92% from previous year)
- 2015: $202,896 (+$8,754, +4.51% from previous year)
- 2016: $212,358 (+$9,463, +4.66% from previous year)
- 2017: $222,194 (+$9,836, +4.63% from previous year)
- 2018: $237,385 (+$15,190, +6.84% from previous year)
- 2019: $250,079 (+$12,695, +5.35% from previous year)
- 2020: $264,590 (+$14,511, +5.80% from previous year)
- 2021: $310,126 (+$45,536, +17.21% from previous year)
- 2022: $367,248 (+$57,122, +18.42% from previous year)
- 2023: $374,245 (+$6,997, +1.91% from previous year)
- 2024: $382,322 (+$8,077, +2.16% from previous year)
- 2025: $388,353 (+$6,030, +1.58% from previous year)
Noblesville has achieved a 113% increase in home values since 2010, with current prices reaching $388,353. The city demonstrated remarkable consistency through the 2010s with steady 4-6% annual gains, before experiencing explosive growth of over 35% during 2021-2022. The market has since stabilized with modest continued appreciation, reflecting Noblesville’s maturity as one of the Indianapolis area’s most established and desirable suburban communities.
Noblesville – Hamilton County’s Crown Jewel
Noblesville serves as the county seat of Hamilton County and represents one of the most successful suburban success stories in the Indianapolis metropolitan area. The city of approximately 70,000 residents has managed remarkable growth while preserving its historic downtown charm and maintaining excellent quality of life standards. Located just 20 miles north of Indianapolis, Noblesville offers residents easy access to urban employment while providing superior schools, extensive recreational amenities, and a strong sense of community that appeals to families and professionals alike.
The city’s housing market reflects Noblesville’s status as one of Indiana’s most desirable places to live, consistently ranking high in quality of life surveys and attracting families from throughout the region. Noblesville offers diverse housing options from historic homes near the downtown square to luxury developments around Morse Reservoir and Geist Reservoir. The city has invested heavily in infrastructure, schools, and amenities, including the Ruoff Music Center outdoor amphitheater and numerous parks and recreational facilities. Hamilton County’s reputation for excellent schools and low crime rates continues to drive demand, while Noblesville’s established character and amenities support premium pricing. As one of the most mature suburban markets in the Indianapolis area, Noblesville’s continued steady appreciation reflects its enduring appeal and strong fundamentals.
18. Topeka – 118% Home Price Increase Since 2010
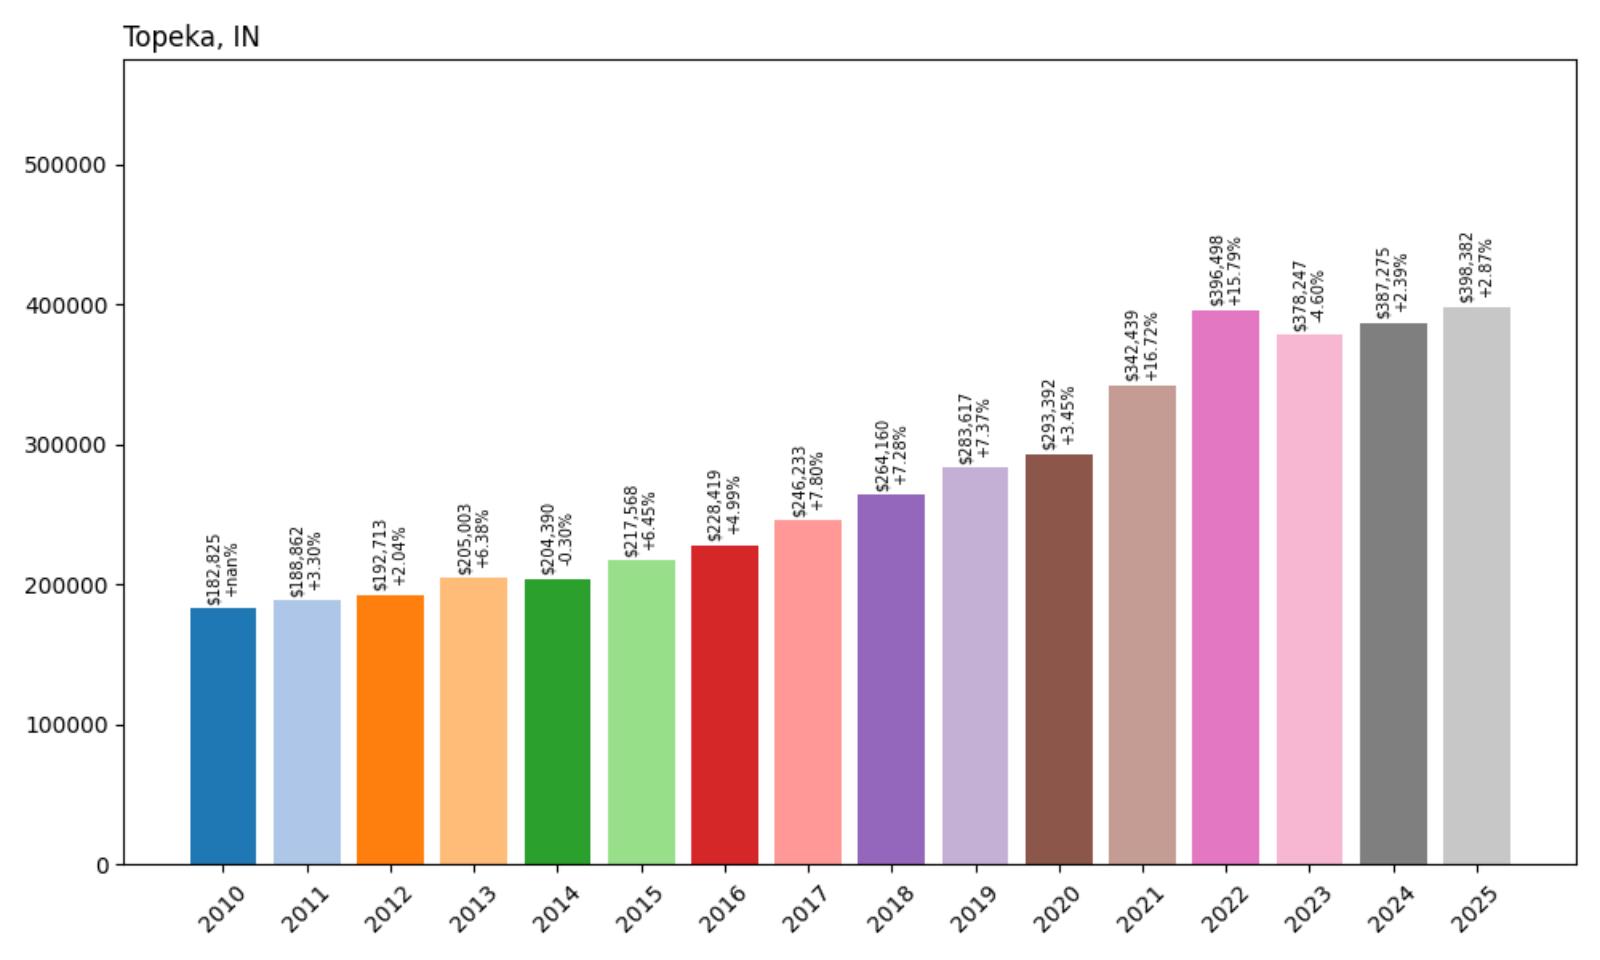
- 2010: $182,825
- 2011: $188,862 (+$6,037, +3.30% from previous year)
- 2012: $192,713 (+$3,851, +2.04% from previous year)
- 2013: $205,003 (+$12,290, +6.38% from previous year)
- 2014: $204,390 (−$613, −0.30% from previous year)
- 2015: $217,568 (+$13,178, +6.45% from previous year)
- 2016: $228,419 (+$10,851, +4.99% from previous year)
- 2017: $246,233 (+$17,813, +7.80% from previous year)
- 2018: $264,160 (+$17,927, +7.28% from previous year)
- 2019: $283,617 (+$19,457, +7.37% from previous year)
- 2020: $293,392 (+$9,775, +3.45% from previous year)
- 2021: $342,439 (+$49,047, +16.72% from previous year)
- 2022: $396,498 (+$54,059, +15.79% from previous year)
- 2023: $378,247 (−$18,252, −4.60% from previous year)
- 2024: $387,275 (+$9,028, +2.39% from previous year)
- 2025: $398,382 (+$11,107, +2.87% from previous year)
Topeka’s home prices have more than doubled over the past 15 years, climbing from $182,825 in 2010 to $398,382 in 2025. The most dramatic growth occurred during the pandemic years, with prices jumping 16.72% in 2021 and 15.79% in 2022. Despite a minor correction in 2023, when prices dropped 4.60%, the market has stabilized with modest gains in recent years, reflecting the broader cooling of overheated pandemic-era price increases.
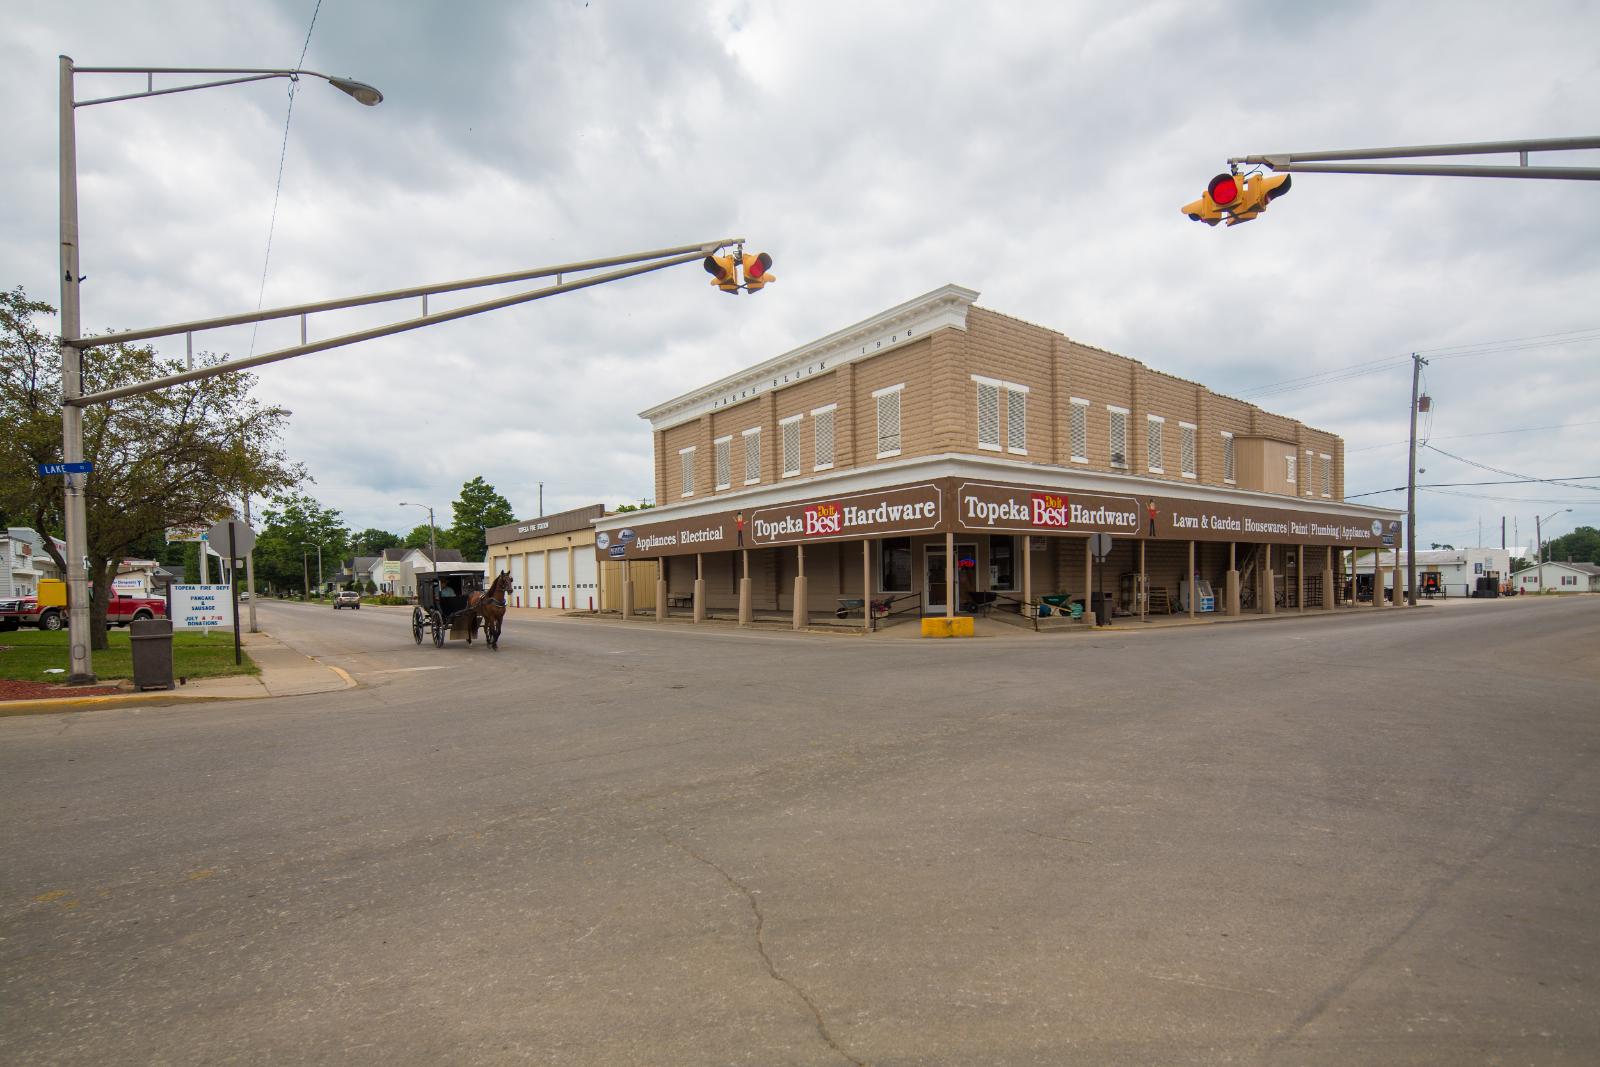
Topeka – Kansas Capital City Driving Economic Stability
🔥 Would you like to save this?
As Kansas’s capital city, Topeka’s largest employer is the State of Kansas—employing about 8,400 people, or 69% of the city’s government workers. This government-centered economy provides unusual stability for the housing market, as state employment tends to be recession-resistant. The city sits along the Kansas River in Shawnee County and houses the state capitol building, completed after 37 years of construction using Kansas limestone. With a population of approximately 126,000 people, Topeka represents a mid-sized market that has experienced significant housing appreciation driven by its role as the state’s political center.
The local economy extends beyond government work into healthcare, education, and manufacturing, with three of the largest employers being Stormont-Vail HealthCare (3,100 employees), St. Francis Health Center (1,800), and Colmery-O’Neil Veterans Administration Hospital (900). Major manufacturers include Hill’s Pet Nutrition, Frito-Lay, and Goodyear Tire and Rubber Company, while Topeka gained national attention when The Wall Street Journal found it to be America’s number one emerging real estate market in 2023. Current market conditions show homes selling quickly, usually within 20 days, indicating continued strong demand in this affordable capital city market that remains 42% below the national median price.
17. Millersburg – 147% Home Price Increase Since 2010

- 2010: $161,366
- 2011: $166,565 (+$5,199, +3.22% from previous year)
- 2012: $169,622 (+$3,057, +1.84% from previous year)
- 2013: $180,781 (+$11,159, +6.58% from previous year)
- 2014: $191,283 (+$10,502, +5.81% from previous year)
- 2015: $201,425 (+$10,142, +5.30% from previous year)
- 2016: $214,157 (+$12,732, +6.32% from previous year)
- 2017: $229,738 (+$15,581, +7.28% from previous year)
- 2018: $246,296 (+$16,558, +7.21% from previous year)
- 2019: $266,570 (+$20,275, +8.23% from previous year)
- 2020: $275,700 (+$9,129, +3.42% from previous year)
- 2021: $325,180 (+$49,480, +17.95% from previous year)
- 2022: $374,252 (+$49,072, +15.09% from previous year)
- 2023: $367,385 (−$6,867, −1.83% from previous year)
- 2024: $381,990 (+$14,605, +3.98% from previous year)
- 2025: $399,389 (+$17,399, +4.55% from previous year)
Millersburg has delivered exceptional returns with a 147% increase since 2010, reaching $399,389 in 2025. The town demonstrated remarkable consistency through the 2010s with strong 5-8% annual gains, particularly from 2016-2019 when prices surged over 24% in four years. The pandemic years brought additional gains of over 33%, and despite a brief correction in 2023, values have resumed strong growth with over 4% appreciation in 2025.
Millersburg – Elkhart County’s Manufacturing Hub

Millersburg sits at the heart of Elkhart County’s manufacturing corridor, benefiting from the region’s status as the recreational vehicle capital of the world. The town of approximately 850 residents has experienced significant economic growth as RV manufacturers and related industries have expanded their operations throughout the county. This industrial base provides well-paying jobs that support a strong housing market, while Millersburg’s small-town character appeals to workers seeking affordable living within commuting distance of major employers like Thor Industries and Forest River.
The community’s housing market reflects the prosperity generated by Elkhart County’s manufacturing economy and the area’s growing reputation as an affordable alternative to more expensive markets. Millersburg offers a range of housing options from modest starter homes to larger properties on expansive lots, all at prices well below those found in urban markets. The town’s location provides easy access to major highways while maintaining a rural atmosphere that appeals to families seeking space and tranquility. As Elkhart County’s manufacturers continue to expand and the region attracts new residents drawn by employment opportunities and quality of life, communities like Millersburg that offer affordable housing near major job centers are positioned for continued strong appreciation.
16. Cicero – 123% Home Price Increase Since 2010

- 2010: $179,158
- 2011: $171,739 (−$7,419, −4.14% from previous year)
- 2012: $176,310 (+$4,572, +2.66% from previous year)
- 2013: $178,059 (+$1,749, +0.99% from previous year)
- 2014: $188,950 (+$10,891, +6.12% from previous year)
- 2015: $199,968 (+$11,018, +5.83% from previous year)
- 2016: $213,323 (+$13,355, +6.68% from previous year)
- 2017: $227,645 (+$14,322, +6.71% from previous year)
- 2018: $241,849 (+$14,203, +6.24% from previous year)
- 2019: $255,450 (+$13,601, +5.62% from previous year)
- 2020: $271,075 (+$15,625, +6.12% from previous year)
- 2021: $320,801 (+$49,725, +18.34% from previous year)
- 2022: $375,111 (+$54,310, +16.93% from previous year)
- 2023: $382,371 (+$7,260, +1.94% from previous year)
- 2024: $390,691 (+$8,319, +2.18% from previous year)
- 2025: $400,269 (+$9,579, +2.45% from previous year)
Cicero has achieved a 123% increase in home values since 2010, reaching $400,269 in 2025. The town showed impressive consistency through the 2010s with strong 5-7% annual gains for six consecutive years from 2014-2020. The pandemic years brought explosive growth of over 35%, and while appreciation has moderated, the market continues to trend upward with steady gains. Cicero’s performance reflects its status as one of Hamilton County’s most attractive lakefront communities.
Cicero – Morse Reservoir’s Premier Destination

Cicero has established itself as one of Indiana’s premier lakefront communities, centered around the pristine waters of Morse Reservoir in northern Hamilton County. The town of approximately 5,000 residents offers an unique combination of water recreation, small-town charm, and proximity to Indianapolis that appeals to a diverse range of buyers. Morse Reservoir provides year-round recreational opportunities including boating, fishing, swimming, and water sports, while the surrounding community features both lakefront estates and more modest homes that provide reservoir access and views.
The housing market in Cicero reflects the premium that buyers place on lakefront living in the Indianapolis metropolitan area. Properties range from modest lake cottages to luxury waterfront estates, with even non-lakefront homes benefiting from the community’s desirable location and amenities. Cicero’s position in Hamilton County provides access to excellent schools and services while maintaining a resort-like atmosphere that distinguishes it from more conventional suburbs. The town has carefully managed growth to preserve its character while accommodating new residents drawn by the lifestyle advantages. As lakefront property becomes increasingly scarce and expensive throughout the Midwest, communities like Cicero that offer accessible water recreation near major metropolitan areas are likely to continue seeing strong demand and appreciation.
15. Floyds Knobs – 93% Home Price Increase Since 2010

- 2010: $207,474
- 2011: $200,494 (−$6,980, −3.36% from previous year)
- 2012: $209,349 (+$8,856, +4.42% from previous year)
- 2013: $212,307 (+$2,957, +1.41% from previous year)
- 2014: $222,827 (+$10,520, +4.96% from previous year)
- 2015: $231,508 (+$8,681, +3.90% from previous year)
- 2016: $236,916 (+$5,407, +2.34% from previous year)
- 2017: $258,517 (+$21,601, +9.12% from previous year)
- 2018: $268,873 (+$10,356, +4.01% from previous year)
- 2019: $283,328 (+$14,455, +5.38% from previous year)
- 2020: $297,358 (+$14,030, +4.95% from previous year)
- 2021: $334,460 (+$37,102, +12.48% from previous year)
- 2022: $372,878 (+$38,417, +11.49% from previous year)
- 2023: $378,589 (+$5,712, +1.53% from previous year)
- 2024: $392,086 (+$13,497, +3.57% from previous year)
- 2025: $400,644 (+$8,558, +2.18% from previous year)
Floyds Knobs has achieved a solid 93% increase since 2010, with current home values reaching $400,644. The community experienced steady growth through the mid-2010s, accelerating significantly from 2017-2020 when prices increased over 15% in four years. The pandemic years brought additional gains of nearly 24%, and momentum has continued with consistent annual appreciation. This southern Indiana location has maintained steady demand despite starting from a higher baseline than many communities on the list.
Floyds Knobs – Louisville’s Indiana Alternative

Floyds Knobs serves as an attractive residential alternative for professionals working in the Louisville metropolitan area who prefer Indiana’s tax structure and lifestyle advantages. The town of approximately 2,800 residents sits strategically in Floyd County, just across the Ohio River from Louisville, providing easy access to Kentucky’s largest city while offering the benefits of Indiana residency. This cross-border appeal has created consistent demand from buyers seeking larger homes, lower taxes, and better value compared to comparable Kentucky communities.
The community’s housing market benefits from Louisville’s economic strength and Floyds Knobs’ reputation as a well-managed, family-friendly destination. The town features rolling hills, mature trees, and larger lots that provide a suburban feel with rural touches, appealing to families seeking space and tranquility without sacrificing urban conveniences. Floyds Knobs has invested in recreational amenities including parks and sports facilities that enhance quality of life and support property values. The area’s proximity to Louisville provides access to employment, cultural attractions, and healthcare while maintaining distinctly Indiana character. As the Louisville metropolitan area continues to grow and cross-border commuting becomes more common, communities like Floyds Knobs that offer lifestyle advantages at competitive prices are positioned for sustained appreciation.
14. Granger – 96% Home Price Increase Since 2010

- 2010: $208,295
- 2011: $206,077 (−$2,218, −1.06% from previous year)
- 2012: $203,272 (−$2,805, −1.36% from previous year)
- 2013: $209,471 (+$6,199, +3.05% from previous year)
- 2014: $216,821 (+$7,350, +3.51% from previous year)
- 2015: $221,359 (+$4,538, +2.09% from previous year)
- 2016: $233,594 (+$12,235, +5.53% from previous year)
- 2017: $247,610 (+$14,015, +6.00% from previous year)
- 2018: $260,153 (+$12,543, +5.07% from previous year)
- 2019: $272,211 (+$12,059, +4.64% from previous year)
- 2020: $282,592 (+$10,381, +3.81% from previous year)
- 2021: $324,296 (+$41,703, +14.76% from previous year)
- 2022: $371,910 (+$47,614, +14.68% from previous year)
- 2023: $378,832 (+$6,922, +1.86% from previous year)
- 2024: $392,010 (+$13,178, +3.48% from previous year)
- 2025: $407,688 (+$15,678, +4.00% from previous year)
Granger has delivered a 96% increase in home values since 2010, reaching $407,688 in 2025. The community showed steady appreciation through the 2010s with consistent 3-6% annual gains, before experiencing significant growth of nearly 30% during 2021-2022. The market has maintained momentum with 4% growth in 2025, indicating continued strong demand for this northern Indiana location near South Bend and the University of Notre Dame.
Granger – Notre Dame’s Prestigious Neighborhood

Granger represents one of northern Indiana’s most prestigious residential communities, benefiting enormously from its proximity to the University of Notre Dame and the economic opportunities that surround one of America’s most renowned universities. The town of approximately 30,000 residents has attracted faculty, administrators, business executives, and professionals who value the combination of excellent schools, upscale neighborhoods, and the cultural amenities associated with a major university. Granger’s location provides easy access to Notre Dame while offering superior residential options compared to the more densely developed areas closer to campus.
The community’s housing market reflects the premium that buyers place on proximity to Notre Dame and the lifestyle advantages that come with university town living. Granger features a range of upscale housing options from established neighborhoods with mature landscaping to newer developments that cater to executives and professionals. The area benefits from Notre Dame’s continued growth and national prominence, which attracts businesses and residents from throughout the country. The university’s economic impact, combined with Granger’s reputation for excellent schools and family-friendly amenities, creates sustained demand for housing. As Notre Dame continues to expand its research activities and enhance its national profile, communities like Granger that offer quality housing within the university’s sphere of influence are likely to see continued strong appreciation.
13. Guilford – 123% Home Price Increase Since 2011

- 2011: $185,656
- 2012: $185,947 (+$291, +0.16% from previous year)
- 2013: $188,835 (+$2,888, +1.55% from previous year)
- 2014: $193,544 (+$4,710, +2.49% from previous year)
- 2015: $203,880 (+$10,336, +5.34% from previous year)
- 2016: $218,415 (+$14,535, +7.13% from previous year)
- 2017: $230,921 (+$12,506, +5.73% from previous year)
- 2018: $238,739 (+$7,819, +3.39% from previous year)
- 2019: $250,273 (+$11,534, +4.83% from previous year)
- 2020: $274,706 (+$24,433, +9.76% from previous year)
- 2021: $320,048 (+$45,343, +16.51% from previous year)
- 2022: $363,813 (+$43,765, +13.67% from previous year)
- 2023: $380,252 (+$16,439, +4.52% from previous year)
- 2024: $398,150 (+$17,898, +4.71% from previous year)
- 2025: $413,383 (+$15,233, +3.83% from previous year)
Guilford has achieved an impressive 123% increase since data collection began in 2011, reaching $413,383 in 2025. The community showed steady acceleration through the 2010s, with particularly strong performance from 2015-2016 and an exceptional 2020 when prices jumped nearly 10%. The pandemic years brought additional gains of over 30%, and remarkably, Guilford has maintained strong momentum with continued annual increases of 3-5% even as many markets have cooled.
Guilford – Dearborn County’s Hidden Gem

Guilford represents one of southeastern Indiana’s most successful residential communities, benefiting from its strategic location in the Cincinnati metropolitan area while maintaining distinct Indiana advantages. The town of approximately 1,500 residents sits in Dearborn County along the Ohio River, providing residents with access to Cincinnati’s robust job market while offering lower costs, better value, and Indiana’s favorable tax environment. This cross-border appeal has created sustained demand from professionals and families seeking alternatives to more expensive Ohio communities.
The community’s housing market reflects the broader economic growth of the Cincinnati region and the increasing appeal of Indiana communities for Ohio workers. Guilford offers a range of housing options from historic river town properties to newer developments that cater to commuters and families. The area’s location provides excellent transportation access via major highways while maintaining a small-town atmosphere that appeals to buyers seeking community connections and quality of life. The town benefits from Dearborn County’s reputation for good schools and services while offering proximity to urban amenities. As the Cincinnati metropolitan area continues to expand and cross-border living becomes more common, communities like Guilford that combine location advantages with authentic small-town character are positioned for continued appreciation.
12. Shadeland – 113% Home Price Increase Since 2010

- 2010: $195,041
- 2011: $187,191 (−$7,850, −4.02% from previous year)
- 2012: $189,776 (+$2,585, +1.38% from previous year)
- 2013: $200,409 (+$10,633, +5.60% from previous year)
- 2014: $209,194 (+$8,785, +4.38% from previous year)
- 2015: $218,075 (+$8,881, +4.25% from previous year)
- 2016: $230,377 (+$12,301, +5.64% from previous year)
- 2017: $241,886 (+$11,509, +5.00% from previous year)
- 2018: $253,913 (+$12,028, +4.97% from previous year)
- 2019: $261,283 (+$7,369, +2.90% from previous year)
- 2020: $282,059 (+$20,777, +7.95% from previous year)
- 2021: $327,842 (+$45,783, +16.23% from previous year)
- 2022: $368,267 (+$40,425, +12.33% from previous year)
- 2023: $367,947 (−$320, −0.09% from previous year)
- 2024: $401,947 (+$34,000, +9.24% from previous year)
- 2025: $415,563 (+$13,616, +3.39% from previous year)
Shadeland has delivered solid returns with a 113% increase since 2010, reaching $415,563 in 2025. The community maintained steady growth through the 2010s with consistent 4-6% annual gains, before experiencing strong pandemic-era appreciation of over 28% in 2021-2022. Notably, Shadeland saw exceptional growth of over 9% in 2024, indicating renewed buyer interest and strong fundamentals in this Indianapolis-area market.
Shadeland – Strategic Location Drives Steady Demand

Shadeland occupies a strategic position in the Indianapolis metropolitan area, serving as an established residential community that benefits from excellent accessibility and mature infrastructure. The town of approximately 1,700 residents sits in Hamilton County with convenient access to major transportation corridors, making it attractive to professionals working throughout the Indianapolis region. Shadeland’s location provides the benefits of suburban living while maintaining reasonable proximity to urban employment centers, cultural attractions, and educational institutions.
The community’s housing market reflects the enduring appeal of well-located suburban communities that offer stability, convenience, and value. Shadeland features a mix of housing options from established neighborhoods with mature landscaping to newer developments that cater to modern preferences. The area benefits from Hamilton County’s reputation for excellent schools and services while maintaining a distinct community identity. The town’s infrastructure and amenities support quality of life while its strategic location ensures continued demand from buyers seeking accessibility without urban density. As the Indianapolis metropolitan area continues to grow and evolve, communities like Shadeland that combine location advantages with established character are positioned to maintain steady appreciation and demand.
11. Fishers – 103% Home Price Increase Since 2010

- 2010: $219,147
- 2011: $212,499 (−$6,648, −3.03% from previous year)
- 2012: $218,271 (+$5,772, +2.72% from previous year)
- 2013: $226,743 (+$8,472, +3.88% from previous year)
- 2014: $239,126 (+$12,383, +5.46% from previous year)
- 2015: $247,960 (+$8,834, +3.69% from previous year)
- 2016: $256,957 (+$8,997, +3.63% from previous year)
- 2017: $268,421 (+$11,464, +4.46% from previous year)
- 2018: $280,532 (+$12,111, +4.51% from previous year)
- 2019: $292,191 (+$11,659, +4.16% from previous year)
- 2020: $306,644 (+$14,452, +4.95% from previous year)
- 2021: $356,300 (+$49,656, +16.19% from previous year)
- 2022: $423,830 (+$67,531, +18.95% from previous year)
- 2023: $427,202 (+$3,372, +0.80% from previous year)
- 2024: $437,927 (+$10,725, +2.51% from previous year)
- 2025: $444,207 (+$6,280, +1.43% from previous year)
Fishers has achieved a 103% increase in home values since 2010, reaching $444,207 in 2025. The city demonstrated remarkable consistency through the 2010s with steady 3-5% annual gains for a full decade, before experiencing explosive growth of over 35% during 2021-2022. While appreciation has moderated from those peaks, Fishers continues to trend upward, reflecting its status as one of the most desirable and established communities in the Indianapolis metropolitan area.
Fishers – Hamilton County’s Technology Hub

Fishers has evolved into one of the Indianapolis area’s premier suburban communities and a recognized technology hub, successfully transforming from a quiet farming town to a dynamic city of approximately 100,000 residents. Located in Hamilton County northeast of Indianapolis, Fishers has attracted major corporate relocations and technology companies while maintaining excellent schools, extensive recreational amenities, and a strong quality of life that appeals to professionals and families. The city’s strategic planning and investment in infrastructure, including the innovative Nickel Plate District development, have created a unique suburban environment that combines business opportunities with residential appeal.
The housing market in Fishers reflects the city’s success in attracting high-quality development and educated residents with substantial purchasing power. The community offers diverse housing options from established neighborhoods around Geist Reservoir to innovative mixed-use developments that integrate residential, commercial, and recreational elements. Fishers has invested heavily in amenities including top-rated schools, extensive park systems, and cultural facilities that enhance property values and attract new residents. The city’s reputation for innovation and business-friendly policies continues to draw companies and professionals, creating sustained demand for housing. As one of the most mature and successful suburban markets in Indiana, Fishers’ continued appreciation reflects its established appeal and strong economic fundamentals.
10. Bargersville – 118% Home Price Increase Since 2010

- 2010: $205,284
- 2011: $195,437 (−$9,847, −4.80% from previous year)
- 2012: $204,639 (+$9,202, +4.71% from previous year)
- 2013: $212,524 (+$7,885, +3.85% from previous year)
- 2014: $220,273 (+$7,749, +3.65% from previous year)
- 2015: $229,928 (+$9,655, +4.38% from previous year)
- 2016: $241,643 (+$11,715, +5.10% from previous year)
- 2017: $256,615 (+$14,972, +6.20% from previous year)
- 2018: $271,461 (+$14,846, +5.79% from previous year)
- 2019: $288,913 (+$17,452, +6.43% from previous year)
- 2020: $310,424 (+$21,511, +7.45% from previous year)
- 2021: $369,954 (+$59,530, +19.18% from previous year)
- 2022: $436,174 (+$66,220, +17.90% from previous year)
- 2023: $431,995 (−$4,179, −0.96% from previous year)
- 2024: $443,009 (+$11,014, +2.55% from previous year)
- 2025: $448,218 (+$5,208, +1.18% from previous year)
Bargersville has achieved impressive gains with a 118% increase since 2010, reaching $448,218 in 2025. The town showed excellent momentum through the 2010s, with particularly strong performance from 2017-2020 when prices increased over 21% in four years. The pandemic years brought explosive growth of over 37%, with 2021 alone seeing nearly 20% appreciation. While the market has stabilized, values continue to trend upward, reflecting Bargersville’s appeal as a growing southern suburb of Indianapolis.
Bargersville – Johnson County’s Rising Star

Bargersville represents one of the most successful growth stories in the Indianapolis metropolitan area, transforming from a small rural community to a thriving suburban destination while maintaining its small-town character. The town of approximately 8,000 residents sits in Johnson County south of Indianapolis, offering residents easy access to urban employment while providing newer housing, excellent schools, and a strong sense of community. Bargersville has managed rapid growth through careful planning and investment in infrastructure, creating an attractive environment for families and professionals seeking alternatives to more densely developed areas.
The community’s housing market benefits from Johnson County’s reputation as one of the most desirable places to live in the Indianapolis area, consistently ranking high in quality of life surveys. Bargersville offers diverse housing options from established neighborhoods to new developments that cater to modern preferences, all at prices that provide excellent value compared to more northern suburbs. The town has invested in recreational amenities including parks, sports facilities, and community events that foster neighborhood connections and support property values. As Indianapolis continues to expand southward and families seek quality educational options and community engagement, Bargersville’s combination of accessibility, affordability, and quality of life positions it well for continued growth and appreciation.
9. Saint John – 76% Home Price Increase Since 2010

- 2010: $258,612
- 2011: $256,508 (−$2,104, −0.81% from previous year)
- 2012: $258,884 (+$2,376, +0.93% from previous year)
- 2013: $268,093 (+$9,208, +3.56% from previous year)
- 2014: $280,593 (+$12,500, +4.66% from previous year)
- 2015: $289,241 (+$8,649, +3.08% from previous year)
- 2016: $301,464 (+$12,223, +4.23% from previous year)
- 2017: $309,942 (+$8,478, +2.81% from previous year)
- 2018: $325,486 (+$15,544, +5.02% from previous year)
- 2019: $341,254 (+$15,769, +4.84% from previous year)
- 2020: $349,905 (+$8,651, +2.53% from previous year)
- 2021: $393,685 (+$43,780, +12.51% from previous year)
- 2022: $440,843 (+$47,157, +11.98% from previous year)
- 2023: $436,793 (−$4,050, −0.92% from previous year)
- 2024: $449,015 (+$12,223, +2.80% from previous year)
- 2025: $455,875 (+$6,860, +1.53% from previous year)
Saint John has delivered solid returns with a 76% increase since 2010, reaching $455,875 in 2025. Starting from a higher baseline than many communities on the list, the town maintained steady 3-5% annual gains through the 2010s before experiencing significant growth of nearly 25% during 2021-2022. The market has since stabilized with modest continued appreciation, reflecting Saint John’s maturity as an established suburban community in northwest Indiana.
Saint John – Northwest Indiana’s Family Destination

Saint John has established itself as one of northwest Indiana’s premier family-oriented communities, combining excellent schools, recreational amenities, and strategic location within the Chicago metropolitan area. The town of approximately 18,000 residents sits in Lake County with convenient access to both Chicago employment opportunities and Indiana’s lower cost of living. Saint John has successfully managed growth while maintaining its reputation for quality schools, safe neighborhoods, and family-friendly amenities that attract professionals and families from throughout the region.
The community’s housing market reflects the premium that families place on educational excellence and quality of life within the Chicago metropolitan area. Saint John offers diverse housing options from established neighborhoods with mature landscaping to newer developments that cater to modern preferences, all benefiting from the town’s excellent schools and recreational facilities. The area’s location provides reasonable commuting access to Chicago while offering significantly lower housing costs and property taxes compared to Illinois communities. As Chicago-area families continue to seek better value and quality of life options, Saint John’s combination of excellent amenities, strategic location, and Indiana’s favorable business climate positions it well for continued steady appreciation.
8. Westfield – 105% Home Price Increase Since 2010

- 2010: $229,423
- 2011: $221,432 (−$7,990, −3.48% from previous year)
- 2012: $225,748 (+$4,315, +1.95% from previous year)
- 2013: $234,681 (+$8,933, +3.96% from previous year)
- 2014: $251,256 (+$16,576, +7.06% from previous year)
- 2015: $262,002 (+$10,746, +4.28% from previous year)
- 2016: $274,381 (+$12,379, +4.72% from previous year)
- 2017: $287,695 (+$13,314, +4.85% from previous year)
- 2018: $301,064 (+$13,369, +4.65% from previous year)
- 2019: $313,459 (+$12,394, +4.12% from previous year)
- 2020: $328,463 (+$15,004, +4.79% from previous year)
- 2021: $378,473 (+$50,010, +15.23% from previous year)
- 2022: $453,639 (+$75,166, +19.86% from previous year)
- 2023: $456,761 (+$3,122, +0.69% from previous year)
- 2024: $461,571 (+$4,810, +1.05% from previous year)
- 2025: $470,560 (+$8,989, +1.95% from previous year)
Westfield has achieved an impressive 105% increase since 2010, reaching $470,560 in 2025. The city demonstrated exceptional consistency through the 2010s with steady 4-5% annual gains for nearly a decade, before experiencing explosive growth of over 35% during 2021-2022. While appreciation has moderated from those peaks, Westfield continues to trend upward, reflecting its status as one of Hamilton County’s most desirable communities.
Westfield – Hamilton County’s Sports Capital

Westfield has emerged as one of the Indianapolis area’s most dynamic suburban communities, building a national reputation around youth sports while maintaining excellent schools and quality of life amenities. The city of approximately 50,000 residents has invested heavily in sports facilities, including the Grand Park Sports Campus, which has become one of the largest youth sports complexes in the United States. This strategic focus on sports tourism and youth athletics has created a unique economic engine that supports local businesses while attracting families who prioritize youth sports participation and competitive opportunities.
The community’s housing market reflects Westfield’s success in creating a distinctive identity that appeals to active families and sports-oriented households. The city offers diverse housing options from established neighborhoods to newer developments that cater to families attracted by the sports facilities and educational opportunities. Westfield’s investment in amenities extends beyond sports to include excellent schools, extensive park systems, and cultural facilities that enhance property values and attract new residents. The city’s location in Hamilton County provides access to Indianapolis employment while maintaining a suburban environment focused on family activities and community engagement. As youth sports continue to grow in importance to American families, communities like Westfield that have built infrastructure and reputation around athletics are positioned for continued strong demand and appreciation.
7. Ogden Dunes – 59% Home Price Increase Since 2010

- 2010: $306,726
- 2011: $291,800 (−$14,925, −4.87% from previous year)
- 2012: $282,277 (−$9,524, −3.26% from previous year)
- 2013: $279,836 (−$2,441, −0.86% from previous year)
- 2014: $269,918 (−$9,917, −3.54% from previous year)
- 2015: $278,004 (+$8,086, +3.00% from previous year)
- 2016: $282,029 (+$4,025, +1.45% from previous year)
- 2017: $300,675 (+$18,646, +6.61% from previous year)
- 2018: $308,240 (+$7,565, +2.52% from previous year)
- 2019: $345,375 (+$37,135, +12.05% from previous year)
- 2020: $356,556 (+$11,181, +3.24% from previous year)
- 2021: $409,090 (+$52,535, +14.73% from previous year)
- 2022: $475,214 (+$66,124, +16.16% from previous year)
- 2023: $490,507 (+$15,293, +3.22% from previous year)
- 2024: $483,106 (−$7,401, −1.51% from previous year)
- 2025: $489,110 (+$6,004, +1.24% from previous year)
Ogden Dunes shows a more modest 59% increase since 2010, reaching $489,110 in 2025, but this reflects its already premium starting point as a lakefront community. The town experienced significant challenges in the early-to-mid 2010s with declining values, before recovering strongly from 2017 onward. The pandemic years brought substantial gains of over 30%, though the market has shown some volatility recently with a decline in 2024 followed by recovery in 2025.
Ogden Dunes – Lake Michigan’s Exclusive Enclave

Ogden Dunes represents one of Indiana’s most exclusive residential communities, offering direct access to Lake Michigan’s pristine beaches while maintaining a secluded, village-like atmosphere. The town of approximately 1,200 residents sits strategically between the Indiana Dunes National Park and the industrial areas of northwest Indiana, creating a unique oasis of natural beauty and tranquility. Properties in Ogden Dunes often feature stunning lake views, private beach access, and architectural significance, with many homes designed by renowned architects who were drawn to the area’s natural setting and proximity to Chicago.
The housing market in Ogden Dunes reflects the extreme premium that buyers place on Lake Michigan frontage and the community’s carefully preserved character. The town maintains strict zoning and architectural controls that protect property values while preserving the natural environment that makes the area special. Ogden Dunes attracts buyers from throughout the Chicago metropolitan area who seek a peaceful retreat with water access, as well as year-round residents who value the community’s unique combination of natural beauty and proximity to urban amenities. As lakefront property becomes increasingly scarce and expensive throughout the Great Lakes region, communities like Ogden Dunes that offer authentic lakefront living with preserved natural character are positioned to maintain their premium market position despite periodic fluctuations.
6. Carmel – 100% Home Price Increase Since 2010

- 2010: $280,924
- 2011: $273,327 (−$7,598, −2.70% from previous year)
- 2012: $279,472 (+$6,145, +2.25% from previous year)
- 2013: $293,419 (+$13,947, +4.99% from previous year)
- 2014: $310,095 (+$16,676, +5.68% from previous year)
- 2015: $319,468 (+$9,373, +3.02% from previous year)
- 2016: $326,752 (+$7,285, +2.28% from previous year)
- 2017: $339,832 (+$13,080, +4.00% from previous year)
- 2018: $350,918 (+$11,087, +3.26% from previous year)
- 2019: $362,412 (+$11,494, +3.28% from previous year)
- 2020: $380,277 (+$17,865, +4.93% from previous year)
- 2021: $437,876 (+$57,599, +15.15% from previous year)
- 2022: $514,711 (+$76,835, +17.55% from previous year)
- 2023: $525,509 (+$10,798, +2.10% from previous year)
- 2024: $550,934 (+$25,425, +4.84% from previous year)
- 2025: $562,290 (+$11,356, +2.06% from previous year)
Carmel has achieved exactly a 100% increase in home values since 2010, reaching $562,290 in 2025. The city demonstrated remarkable consistency through the 2010s with steady 3-5% annual gains, before experiencing explosive growth of over 32% during 2021-2022. Despite the dramatic appreciation, Carmel has maintained momentum with continued annual increases, reflecting its status as one of Indiana’s most prestigious and sought-after communities.
Carmel – The Crown Jewel of Indianapolis Suburbs

Carmel stands as the undisputed flagship of Indianapolis suburban communities, consistently ranking among the best places to live in America while building a national reputation for innovation, arts, and quality of life. The city of approximately 100,000 residents has transformed itself from a quiet farming community to a vibrant urban center that rivals major cities in amenities while maintaining suburban appeal. Carmel’s success stems from visionary planning, significant public investment in infrastructure and arts facilities, and a commitment to creating a walkable, culturally rich environment that attracts residents and businesses from around the world.
The housing market in Carmel reflects the city’s unique position as both a suburban community and a cultural destination. Properties range from established neighborhoods with tree-lined streets to luxury developments around the Arts and Design District, all benefiting from Carmel’s exceptional schools, extensive recreational facilities, and cultural amenities. The city’s investment in public art, performing arts venues, and mixed-use developments has created a distinctive character that commands premium pricing. Carmel’s location provides excellent access to Indianapolis while offering superior municipal services, innovative public amenities, and a cosmopolitan atmosphere unusual in suburban markets. As one of the most successful planned communities in the Midwest, Carmel’s continued investment in amenities and infrastructure should support long-term appreciation and demand from affluent buyers seeking both luxury and cultural sophistication.
5. Michiana Shores – 97% Home Price Increase Since 2010

- 2010: $300,694
- 2011: $294,214 (−$6,480, −2.15% from previous year)
- 2012: $301,729 (+$7,514, +2.55% from previous year)
- 2013: $304,385 (+$2,657, +0.88% from previous year)
- 2014: $310,949 (+$6,563, +2.16% from previous year)
- 2015: $319,038 (+$8,090, +2.60% from previous year)
- 2016: $313,363 (−$5,675, −1.78% from previous year)
- 2017: $320,529 (+$7,165, +2.29% from previous year)
- 2018: $339,202 (+$18,674, +5.83% from previous year)
- 2019: $368,562 (+$29,359, +8.66% from previous year)
- 2020: $379,397 (+$10,836, +2.94% from previous year)
- 2021: $463,429 (+$84,031, +22.15% from previous year)
- 2022: $550,672 (+$87,243, +18.83% from previous year)
- 2023: $569,603 (+$18,931, +3.44% from previous year)
- 2024: $562,439 (−$7,165, −1.26% from previous year)
- 2025: $593,146 (+$30,708, +5.46% from previous year)
Michiana Shores has delivered strong returns with a 97% increase since 2010, reaching $593,146 in 2025. The lakefront community showed modest appreciation through most of the 2010s before accelerating significantly from 2018-2019 when prices increased nearly 15% over two years. The pandemic years brought exceptional growth of over 40%, making it one of the strongest performers during that period. Despite some volatility, the community has resumed strong growth with over 5% appreciation in 2025.
Michiana Shores – Lake Michigan’s Premier Resort Community

Michiana Shores represents one of the most exclusive lakefront communities in the Midwest, offering direct access to Lake Michigan’s pristine beaches while maintaining an intimate, resort-like atmosphere. The town of approximately 300 residents sits in LaPorte County with nearly a mile of private Lake Michigan frontage, creating a secluded enclave that attracts affluent buyers from Chicago and throughout the region. Properties in Michiana Shores often feature stunning lake views, private beach access, and architectural distinction, with many serving as second homes for wealthy professionals seeking a peaceful retreat from urban life.
The housing market in Michiana Shores reflects the extreme premium that buyers place on Lake Michigan access and the community’s carefully preserved character. The town maintains strict development controls and environmental protections that ensure property values while preserving the natural beauty that makes the area special. Michiana Shores attracts buyers who value privacy, natural beauty, and water recreation, often serving as a weekend retreat or summer residence for Chicago-area executives and professionals. The community’s limited size and exclusive character create scarcity that supports premium pricing, while its proximity to Chicago provides convenient access for regular use. As lakefront property becomes increasingly rare and expensive throughout the Great Lakes region, communities like Michiana Shores that offer authentic lakefront living with preserved natural character are positioned to maintain their luxury market position.
4. Zionsville – 103% Home Price Increase Since 2010

- 2010: $321,750
- 2011: $316,174 (−$5,576, −1.73% from previous year)
- 2012: $322,033 (+$5,859, +1.85% from previous year)
- 2013: $335,861 (+$13,828, +4.29% from previous year)
- 2014: $352,013 (+$16,152, +4.81% from previous year)
- 2015: $365,988 (+$13,975, +3.97% from previous year)
- 2016: $377,588 (+$11,600, +3.17% from previous year)
- 2017: $394,206 (+$16,618, +4.40% from previous year)
- 2018: $408,884 (+$14,678, +3.72% from previous year)
- 2019: $431,130 (+$22,245, +5.44% from previous year)
- 2020: $444,713 (+$13,583, +3.15% from previous year)
- 2021: $502,353 (+$57,640, +12.96% from previous year)
- 2022: $598,895 (+$96,541, +19.22% from previous year)
- 2023: $603,840 (+$4,946, +0.83% from previous year)
- 2024: $630,833 (+$26,993, +4.47% from previous year)
- 2025: $654,959 (+$24,126, +3.82% from previous year)
Zionsville has achieved a 103% increase since 2010, reaching $654,959 in 2025. Starting from an already premium baseline, the town maintained steady 3-5% annual gains through the 2010s before experiencing remarkable growth of over 32% during 2021-2022. The community has continued strong appreciation with consistent annual increases, reflecting its status as one of Indiana’s most affluent and desirable communities.
Zionsville – Indiana’s Wealthiest Enclave

Zionsville stands as Indiana’s premier affluent community, consistently ranking as the state’s wealthiest town while maintaining a charming village atmosphere that attracts successful professionals and executives from throughout the region. The town of approximately 30,000 residents has preserved its historic brick-street downtown while accommodating luxury residential developments that cater to the most discriminating buyers. Zionsville’s success stems from its commitment to maintaining high standards for development, preservation of historical character, and investment in amenities that support a premium lifestyle.
The housing market in Zionsville reflects the community’s unique position as both a historic village and a modern luxury destination. Properties range from restored Victorian homes near the village center to expansive estates on large lots that provide privacy and prestige. The town’s median household income significantly exceeds state and national averages, creating a buyer pool with substantial purchasing power that supports continued appreciation. Zionsville’s excellent schools, cultural amenities, and proximity to Indianapolis make it particularly attractive to corporate executives, successful professionals, and affluent retirees who value both luxury and community character. As one of the most established luxury markets in the Midwest, Zionsville’s combination of historical charm, modern amenities, and economic prosperity positions it well for continued premium pricing and appreciation.
3. Clear Lake – 103% Home Price Increase Since 2010

- 2010: $362,495
- 2011: $372,804 (+$10,309, +2.84% from previous year)
- 2012: $372,504 (−$299, −0.08% from previous year)
- 2013: $364,535 (−$7,969, −2.14% from previous year)
- 2014: $389,295 (+$24,760, +6.79% from previous year)
- 2015: $407,409 (+$18,113, +4.65% from previous year)
- 2016: $422,754 (+$15,346, +3.77% from previous year)
- 2017: $421,663 (−$1,091, −0.26% from previous year)
- 2018: $435,993 (+$14,329, +3.40% from previous year)
- 2019: $474,976 (+$38,983, +8.94% from previous year)
- 2020: $504,927 (+$29,950, +6.31% from previous year)
- 2021: $563,884 (+$58,958, +11.68% from previous year)
- 2022: $684,761 (+$120,876, +21.44% from previous year)
- 2023: $704,727 (+$19,967, +2.92% from previous year)
- 2024: $717,553 (+$12,826, +1.82% from previous year)
- 2025: $736,390 (+$18,837, +2.63% from previous year)
Clear Lake has achieved a 103% increase since 2010, reaching $736,390 in 2025. Starting from a high baseline, the community experienced some volatility in the early 2010s before establishing strong momentum from 2014 onward. The pandemic years brought exceptional growth, with 2022 alone seeing over 21% appreciation. Despite the dramatic gains, Clear Lake has maintained steady upward momentum, reflecting its status as one of the state’s most exclusive lakefront communities.
Clear Lake – Steuben County’s Crown Jewel

Clear Lake represents the pinnacle of lakefront living in northern Indiana, offering pristine water quality and an exclusive residential environment that attracts affluent buyers from throughout the Midwest. Located in Steuben County among the region’s chain of glacial lakes, Clear Lake provides crystal-clear waters ideal for swimming, boating, and fishing, while the surrounding community maintains strict development standards that preserve both property values and natural beauty. The area serves as both a year-round residential community and a premier destination for luxury vacation homes.
The housing market in Clear Lake reflects the extreme premium that buyers place on high-quality lakefront property and exclusive community character. Properties often feature extensive lake frontage, private docks, and luxury amenities that cater to affluent buyers seeking the ultimate in lake living. Clear Lake’s reputation for water quality and environmental protection attracts buyers who value natural beauty and recreational opportunities, while the area’s proximity to Fort Wayne and other employment centers makes it viable for year-round residence. The community’s limited development potential and established exclusivity create scarcity that supports premium pricing, while its reputation continues to attract buyers from increasingly distant markets. As luxury lakefront property becomes scarce throughout the Great Lakes region, communities like Clear Lake that offer superior water quality and preserved natural character are positioned to maintain their position at the top of the luxury market.
2. Long Beach – 96% Home Price Increase Since 2010

- 2010: $386,876
- 2011: $381,997 (−$4,879, −1.26% from previous year)
- 2012: $379,605 (−$2,392, −0.63% from previous year)
- 2013: $369,782 (−$9,823, −2.59% from previous year)
- 2014: $367,613 (−$2,170, −0.59% from previous year)
- 2015: $388,180 (+$20,567, +5.59% from previous year)
- 2016: $404,982 (+$16,803, +4.33% from previous year)
- 2017: $405,979 (+$997, +0.25% from previous year)
- 2018: $419,668 (+$13,688, +3.37% from previous year)
- 2019: $455,005 (+$35,337, +8.42% from previous year)
- 2020: $476,736 (+$21,731, +4.78% from previous year)
- 2021: $603,346 (+$126,610, +26.56% from previous year)
- 2022: $707,705 (+$104,359, +17.30% from previous year)
- 2023: $716,202 (+$8,496, +1.20% from previous year)
- 2024: $719,701 (+$3,499, +0.49% from previous year)
- 2025: $760,364 (+$40,663, +5.65% from previous year)
Long Beach has achieved a 96% increase since 2010, reaching $760,364 in 2025. The lakefront community experienced significant challenges in the early 2010s with declining values, before establishing strong momentum from 2015 onward. The pandemic years brought explosive growth of over 43%, with 2021 alone seeing an exceptional 26.56% increase. After a brief moderation, the community has resumed strong growth with over 5% appreciation in 2025.
Long Beach – Lake Michigan’s Historic Resort

Long Beach represents one of Indiana’s most storied lakefront communities, combining over a century of resort tradition with modern luxury living along Lake Michigan’s pristine shores. The town of approximately 1,200 residents sits in LaPorte County with extensive Lake Michigan frontage, offering residents direct access to sandy beaches, dune landscapes, and stunning sunset views. Long Beach has maintained its character as an exclusive retreat while evolving to accommodate year-round residents who value the unique combination of natural beauty, privacy, and proximity to both Chicago and the Indiana Dunes National Park.
The housing market in Long Beach reflects the community’s evolution from a historic resort destination to a premier luxury residential enclave. Properties range from charming cottage-style homes that reflect the area’s resort heritage to modern luxury estates that take full advantage of the spectacular lake setting. Long Beach’s strict zoning and architectural controls preserve the community’s character while protecting property values and natural resources. The town attracts buyers who seek an authentic Lake Michigan experience with access to pristine beaches and dune environments that are increasingly rare along the Great Lakes shoreline. As Chicago continues to grow and lakefront property becomes more valuable, communities like Long Beach that offer authentic lakefront living with preserved natural beauty are positioned to maintain their position among the region’s most desirable and expensive residential markets.
1. Dune Acres – 55% Home Price Increase Since 2016

- 2016: $559,261
- 2017: $552,409 (−$6,852, −1.23% from previous year)
- 2018: $539,156 (−$13,252, −2.40% from previous year)
- 2019: $581,155 (+$41,999, +7.79% from previous year)
- 2020: $583,717 (+$2,562, +0.44% from previous year)
- 2021: $699,653 (+$115,935, +19.86% from previous year)
- 2022: $803,288 (+$103,636, +14.81% from previous year)
- 2023: $790,424 (−$12,865, −1.60% from previous year)
- 2024: $835,446 (+$45,022, +5.70% from previous year)
- 2025: $864,483 (+$29,038, +3.48% from previous year)
Dune Acres leads the list with current home values of $864,483, representing a 55% increase since data collection began in 2016. The exclusive lakefront community experienced some initial volatility before surging dramatically during the pandemic years with over 34% growth in 2021-2022. Despite a brief correction in 2023, values have resumed strong appreciation with nearly 9% growth over the past two years, reflecting the premium market position of this unique Lake Michigan enclave.
Dune Acres – Indiana’s Most Exclusive Community

Dune Acres stands as Indiana’s most exclusive and expensive residential community, representing the ultimate in Great Lakes luxury living. This tiny town of just 234 residents sits perched atop the tallest dune on Lake Michigan’s southern shore, offering unparalleled views and direct access to pristine beaches within the Indiana Dunes ecosystem. Originally platted in 1923 as a lakeside resort village, Dune Acres has evolved into an ultra-exclusive enclave where privacy, natural beauty, and architectural distinction create one of the Midwest’s most coveted addresses.
The housing market in Dune Acres reflects the extreme scarcity and desirability of prime Lake Michigan frontage combined with the community’s carefully preserved character. With only 165 homes as of recent counts, properties rarely come to market, creating intense competition when they do. The town maintains strict architectural and environmental controls that preserve both the natural dune ecosystem and the community’s exclusive atmosphere. Residents enjoy private beach access, stunning lake views, and proximity to Chicago while maintaining complete privacy and tranquility. The community attracts ultra-high-net-worth individuals from throughout the Midwest who value authentic lakefront living in an unspoiled natural setting. As one of the few remaining undeveloped stretches of Lake Michigan shoreline, Dune Acres represents irreplaceable real estate that commands premium pricing reflecting its unique combination of natural beauty, exclusivity, and proximity to major metropolitan areas.


