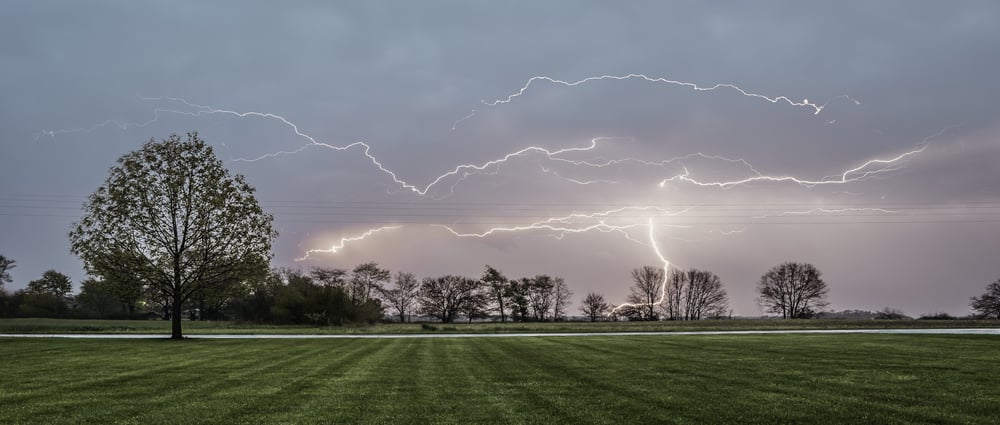
Indiana sits squarely in the cross-hairs of America’s most violent weather, where the flat prairie landscape of the north meets the rolling hills of the south, creating a natural battleground for clashing air masses. During peak season from April through August, warm, humid air streaming north from the Gulf of Mexico collides with cooler, drier air masses moving south from Canada, creating the perfect recipe for explosive thunderstorm development.
Methodology: This ranking combines severe thunderstorm warning frequency from the National Weather Service’s polygon-based warning system, along with hail and wind report density from NOAA’s Storm Events Database and recurring storm-track corridors identified in NWS and Storm Prediction Center climatology studies. The “average events per year” reflects both official severe thunderstorm warnings and qualifying local storm reports featuring hail one inch or larger or winds of 58 mph or greater near each community.
In order to come up with the very specific design ideas, we create most designs with the assistance of state-of-the-art AI interior design software. Also, assume links that take you off the site are affiliate links such as links to Amazon. this means we may earn a commission if you buy something.
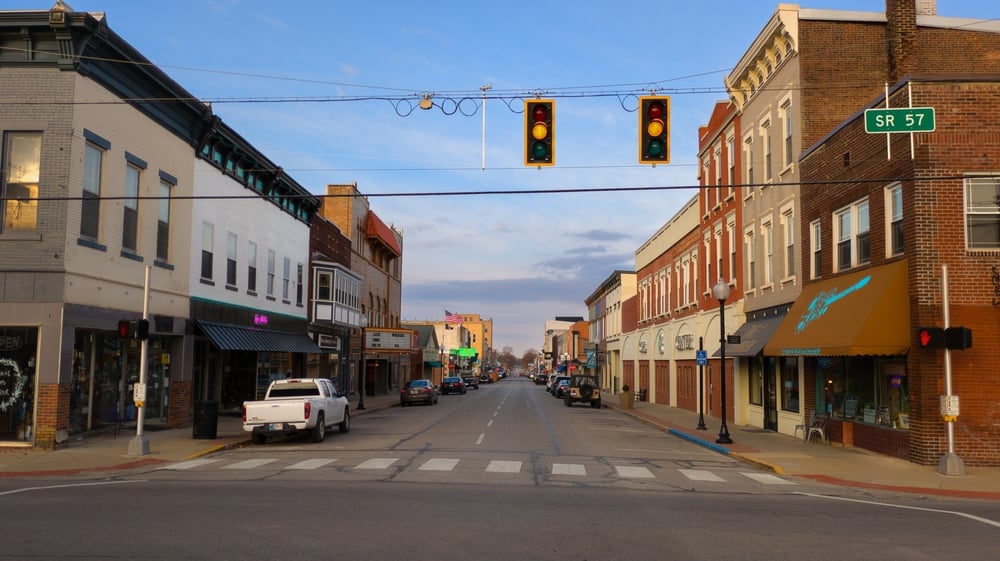
25. Remington

Average severe thunderstorm events per year: 16–20
Location: I-65 corridor in Jasper County
Why so many storms: Remington sits directly in the path of some of Indiana’s most notorious weather events. Fast-moving derecho systems and organized squall lines commonly tear through this stretch of northwest Indiana, bringing damaging winds that can exceed 80 mph. The town’s location along the interstate corridor puts it at the mercy of the region’s most linear and destructive storm complexes.
24. Rensselaer

Average severe thunderstorm events per year: 17–20
Location: Open prairie of northwest Indiana
Why so many storms: Positioned in what meteorologists call “bow-echo alley” south of Lake Michigan, Rensselaer experiences frequent severe wind events as organized storm systems sweep across the flat prairie landscape. The open terrain offers no natural barriers to slow these fast-moving systems, allowing them to maintain their severe characteristics as they race eastward from Illinois.
23. Monticello
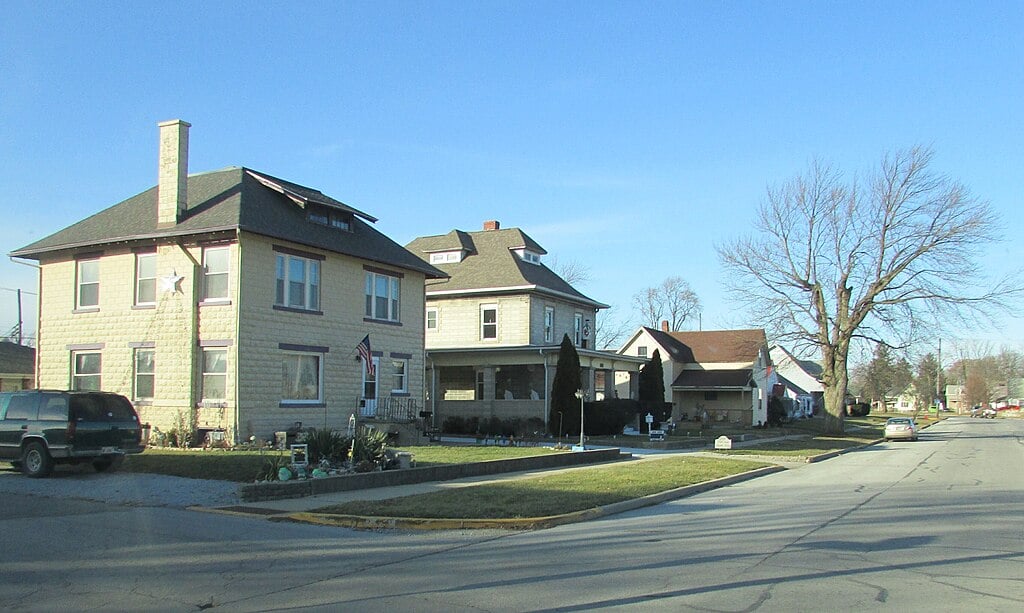
Chris Light, CC BY-SA 4.0, via Wikimedia Commons
Average severe thunderstorm events per year: 17–20
Location: Between Lafayette and Logansport on the Tippecanoe River
Why so many storms: Monticello’s position along the Tippecanoe River creates favorable conditions for storm intensification, as river valleys provide natural focusing mechanisms for atmospheric boundaries. The interaction between outflow boundaries from earlier storms and the river’s influence on local wind patterns frequently leads to steady severe weather coverage throughout the warm season.
22. Knox

Average severe thunderstorm events per year: 17–21
Location: West of Plymouth in Starke County
Why so many storms: Knox finds itself in the crosshairs of bow-echo tracks that regularly sweep across northwest Indiana. The town frequently falls within warned segments issued by both the Chicago and Northern Indiana National Weather Service offices, as organized storm systems maintain their severe characteristics while crossing this transition zone between different forecast areas.
21. Plymouth

Average severe thunderstorm events per year: 17–21
Location: North-central Indiana near glacial lakes
Why so many storms: The numerous glacial lakes surrounding Plymouth create mesoscale boundaries that help organize and intensify passing thunderstorms. Storm systems moving across this lake-influenced air mass frequently maintain or redevelop their severe characteristics, leading to consistent hail and wind damage in the Marshall County area.
20. Rochester
Average severe thunderstorm events per year: 17–21
Location: Along the US-31 corridor in Fulton County
Why so many storms: Rochester’s position along the north-south US-31 corridor places it in the path of recurrent storm tracks that follow this transportation route. The surrounding counties generate abundant severe wind reports, and the town frequently experiences the effects of organized storm systems that maintain their intensity while tracking along this preferred meteorological pathway.
19. Warsaw

Average severe thunderstorm events per year: 18–22
Location: Chain-of-lakes region of north-central Indiana
Why so many storms: Warsaw benefits—or suffers—from its location among Kosciusko County’s famous chain of lakes, which create numerous mesoscale boundaries that aid in storm organization. These lake-chain boundaries provide the atmospheric focusing mechanisms that help trigger and maintain severe thunderstorms, resulting in frequent reports of damaging winds and large hail throughout the area.
18. Columbia City

Average severe thunderstorm events per year: 18–22
Location: West of Fort Wayne in Whitley County
Why so many storms: Columbia City lies within the Northern Indiana National Weather Service’s coverage area, which shows particularly robust wind and hail report density. Atmospheric boundaries frequently focus storm development near this community, and the town’s position in northeast Indiana places it in the path of many organized severe weather systems that track across the Great Lakes region.
17. Franklin

Average severe thunderstorm events per year: 18–22
Location: South of Indianapolis in Johnson County
Why so many storms: Franklin’s location south of Indianapolis puts it in a prime position to experience the effects of evening and overnight mesoscale convective systems that cross central Indiana. Storm complexes originating from the Wabash River valley frequently track through this corridor, maintaining their severe characteristics and generating steady warning counts throughout the peak storm season.
16. Martinsville
Average severe thunderstorm events per year: 18–22
Location: Between Indianapolis and Bloomington in Morgan County
Why so many storms: Martinsville sits in the heart of central Indiana’s severe weather corridor, where storm report density reaches some of the highest levels in the state. The town frequently experiences the effects of warned squall lines that race eastward from Illinois and maintain their intensity as they cross the relatively flat terrain of central Indiana.
15. Spencer

Average severe thunderstorm events per year: 18–23
Location: West of Bloomington near the White River in Owen County
Why so many storms: Spencer’s position near the White River in the Indiana Uplands places it where organized storm systems frequently retain their severe characteristics despite the slightly more varied terrain. Lines of thunderstorms propagating through the uplands often trigger countywide severe thunderstorm warnings, and the town regularly experiences the damaging winds and hail associated with these systems.
14. Greencastle

Average severe thunderstorm events per year: 18–23
Location: West-central Indiana in Putnam County
Why so many storms: Greencastle sits directly in the path of frequent west-to-east squall lines that race across central Indiana from Illinois. These fast-moving systems often bring damaging straight-line winds that can exceed 70 mph, and the town’s position on relatively flat terrain allows these storm complexes to maintain their severe wind potential with little geographic interference.
13. Brazil

🔥 Would you like to save this?
Average severe thunderstorm events per year: 19–23
Location: Along I-70 east of Terre Haute in Clay County
Why so many storms: Brazil’s location along the I-70 corridor places it in what meteorologists recognize as a preferred squall-line pathway across central Indiana. Remnant cold pools from earlier storm activity help maintain severe wind swaths as they cross this area, and the town frequently experiences the effects of organized thunderstorm complexes that follow this east-west transportation and topographic corridor.
12. Linton
Average severe thunderstorm events per year: 19–24
Location: Southwest of Bloomington in Greene County
Why so many storms: Linton occupies a crucial transition zone where central Indiana squall lines frequently maintain their strength as they encounter the slightly more varied terrain of the Indiana Uplands. This location generates healthy warning totals throughout the storm season, as organized systems from Illinois and western Indiana often retain their severe characteristics while passing through this area.
11. Sullivan

Average severe thunderstorm events per year: 19–24
Location: Mid-Wabash Valley in Sullivan County
Why so many storms: Sullivan’s position along the Wabash River places it in one of Indiana’s most active severe weather corridors. Repeated linear mesoscale convective systems track along the Wabash Valley, bringing numerous reports of damaging winds that regularly exceed severe criteria, making this community one of the most consistently storm-battered in the state.
10. Petersburg
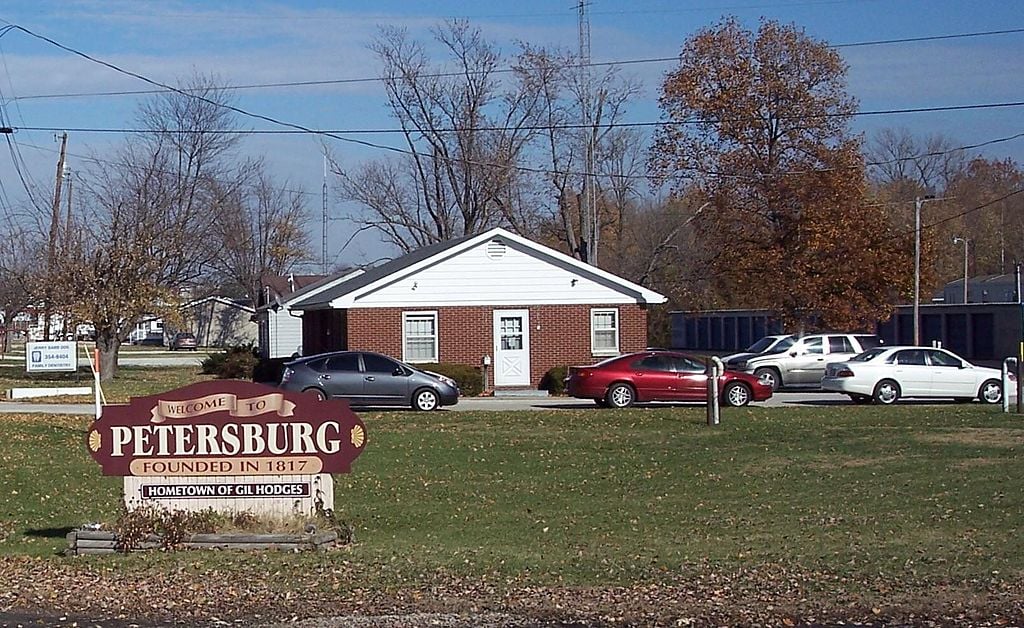
Average severe thunderstorm events per year: 20–24
Location: Between the White and Patoka Rivers in Pike County
Why so many storms: Petersburg benefits from its strategic location between two river systems, where mesoscale convective systems originating from the Missouri Ozarks and Bootheel region frequently maintain their severe characteristics. The dual river influence creates favorable atmospheric conditions that allow these storm complexes to retain their intensity well into Pike County.
9. Santa Claus
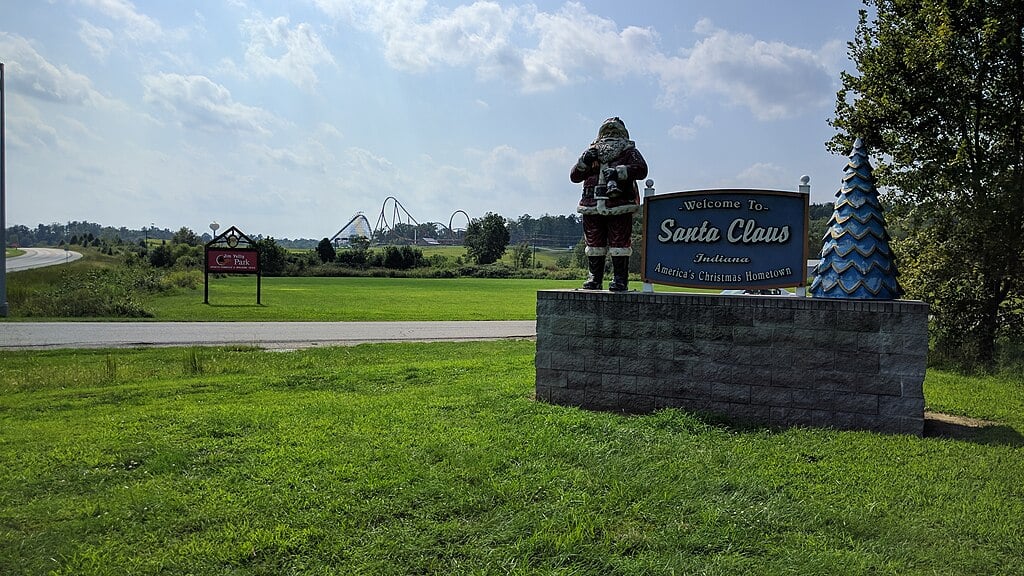
Average severe thunderstorm events per year: 20–25
Location: North of a major Ohio River bend in Spencer County
Why so many storms: The famous Christmas-themed town finds itself in a severe weather hotspot where storms frequently re-intensify near the interface between the Ohio River valley and surrounding terrain. This geographic positioning creates lift mechanisms that help maintain or redevelop severe thunderstorm characteristics, and Spencer County is regularly included in warned segments during major severe weather episodes.
8. Huntingburg

Average severe thunderstorm events per year: 20–25
Location: South-central Indiana Uplands in Dubois County
Why so many storms: Huntingburg experiences recurrent reports of damaging winds and large hail as bowing segments of organized storm systems sweep through Dubois County. The town’s location in the Indiana Uplands provides sufficient terrain variation to enhance storm structure while not being mountainous enough to significantly weaken these powerful mesoscale convective systems.
7. Boonville
Average severe thunderstorm events per year: 21–25
Location: Northeast of Evansville in Warrick County
Why so many storms: Boonville shares the same Ohio River corridor effects that make nearby Newburgh so storm-prone, with many severe thunderstorm warning polygons encompassing the town during major weather events. The community regularly experiences the damaging winds and hail associated with organized storm systems that track along this preferred meteorological pathway.
6. Washington
Average severe thunderstorm events per year: 21–26
Location: Southwest of Bloomington in the Indiana Uplands
Why so many storms: Washington sits within a common mesoscale convective system corridor that affects south-central Indiana, generating elevated warning density and local storm report frequency. The town’s position in Daviess County places it where organized storm systems frequently maintain their severe characteristics while crossing the transitional terrain between the flat areas to the north and the more varied uplands to the south.
5. Vincennes

Average severe thunderstorm events per year: 21–26
Location: Lower Wabash Valley in Knox County
Why so many storms: Vincennes experiences confluent mesoscale convective system tracks arriving from Missouri and Illinois, creating a meteorological crossroads effect that generates frequent severe thunderstorm warning polygons and robust wind reports. The town’s historic location along the Wabash River places it in one of the Midwest’s most active severe weather corridors.
4. Tell City

Average severe thunderstorm events per year: 22–27
Location: On the Ohio River along the Kentucky line in Perry County
Why so many storms: Tell City’s position directly along the Ohio River places it in the path of river-parallel storm tracks that frequently maintain their severe characteristics due to terrain-channeled outflow patterns. The river valley’s natural corridor effect concentrates severe weather activity, resulting in repeated episodes of damaging winds and significant hail.
3. Princeton

Average severe thunderstorm events per year: 22–27
Location: Lower Wabash-Ohio confluence region in Gibson County
Why so many storms: Princeton sits in one of Indiana’s most meteorologically active areas, where the confluence of two major river systems creates optimal conditions for severe weather development and maintenance. The town experiences high warning density associated with nocturnal mesoscale convective system passages, and occasional derecho corridors clip the area with particularly devastating winds.
2. Jasper

Average severe thunderstorm events per year: 23–28
Location: Indiana Uplands north of the Ohio River valley in Dubois County
Why so many storms: Jasper consistently ranks among Indiana’s most severe weather-prone communities due to its position where bowing mesoscale convective system segments frequently produce prolific hail and wind reports. Dubois County and its neighbors generate some of the highest severe weather report densities in the state, with Jasper regularly experiencing the most intense portions of these organized storm systems.
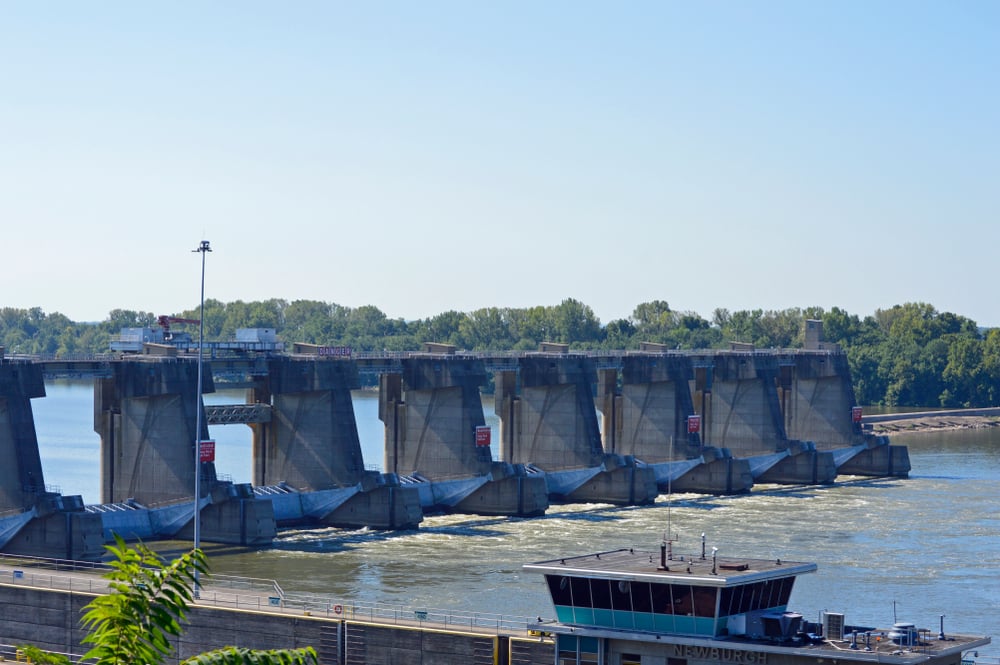
1. Newburgh
🔥 Would you like to save this?
Average severe thunderstorm events per year: 24–29
Location: Ohio River east of Evansville in Warrick County
Why so many storms: Newburgh claims the unfortunate distinction of being Indiana’s most thunderstorm-battered small town, experiencing nearly two and a half dozen severe weather events annually. The community’s location along the Ohio River corridor makes it a natural target for repeated warm-season mesoscale convective system tracks, with Warrick County and adjacent areas frequently under severe thunderstorm warnings during peak storm season. The river valley’s natural focusing effect concentrates the most intense storm activity, making Newburgh ground zero for some of Indiana’s most persistent severe weather.
References & Data Sources
- IEM VTEC Warning Search (point/county, Severe Thunderstorm Warnings)
- IEM VTEC Product Browser (navigation & updates)
- NOAA/NCEI Storm Events Database (hail & wind reports)
- NWS Indianapolis – Severe Storm Climatology (SPC dataset portal + county filters)
- NWS Northern Indiana (IWX) – Severe Weather Climatology
- NWS Chicago (LOT) – Severe Weather Climatology (includes NW Indiana counties)
- NWS Chicago (LOT) – Tornado & Severe Weather Climatology overview
- NWS Louisville (LMK) – Climate/Severe resources for south-central IN
- NWS Louisville (LMK) – Climate summaries (regional context)
- NWS Paducah (PAH) – Forecast Office (Ohio River corridor context)
- NWS Indianapolis – Event Summaries (recent severe episodes)
- NWS Indianapolis – Local Severe Weather Information hub


