Think Houston’s housing market is steady as a Texas summer? Think again. The latest July 2025 numbers show a market that’s cooling in some places, overheated in others, and confusing everywhere. On paper, you’ve got more homes for sale, more time to buy, and a handful of neighborhoods where million-dollar listings make your jaw drop. In practice, you’re staring at a market that feels wobbly — and possibly one big shove away from a correction.
In order to come up with the very specific design ideas, we create most designs with the assistance of state-of-the-art AI interior design software. Also, assume links that take you off the site are affiliate links such as links to Amazon. this means we may earn a commission if you buy something.
Here’s the countdown from #25 to #1 of the most alarming facts about Houston’s housing market right now. By the time you hit #1, you’ll see why “affordable Houston” might just be history. This list is based on expansive analysis of all the July 2025 data via Zillow Home Value Index.
25. Houston’s “average” home now costs $267,347.
That’s the July 2025 city ZHVI. For decades, Houston’s calling card was affordability compared to Dallas, Austin, or San Antonio. But breaking north of $250K for the average home officially puts Houston in “no longer a bargain” territory. If you’re renting and hoping to buy, $267K feels like a cliff instead of a step up.
24. Prices actually dropped ~3% in the past year.
From $275,514 in July 2024 to $267,348 in July 2025, Houston slipped. That may sound small, but for a city that was on a straight-up rocket during the 2020–2022 boom, even a 3% decline signals demand has softened. Homeowners who bought at the peak are already underwater on paper.
23. Houston’s sitting on 37,089 active listings.
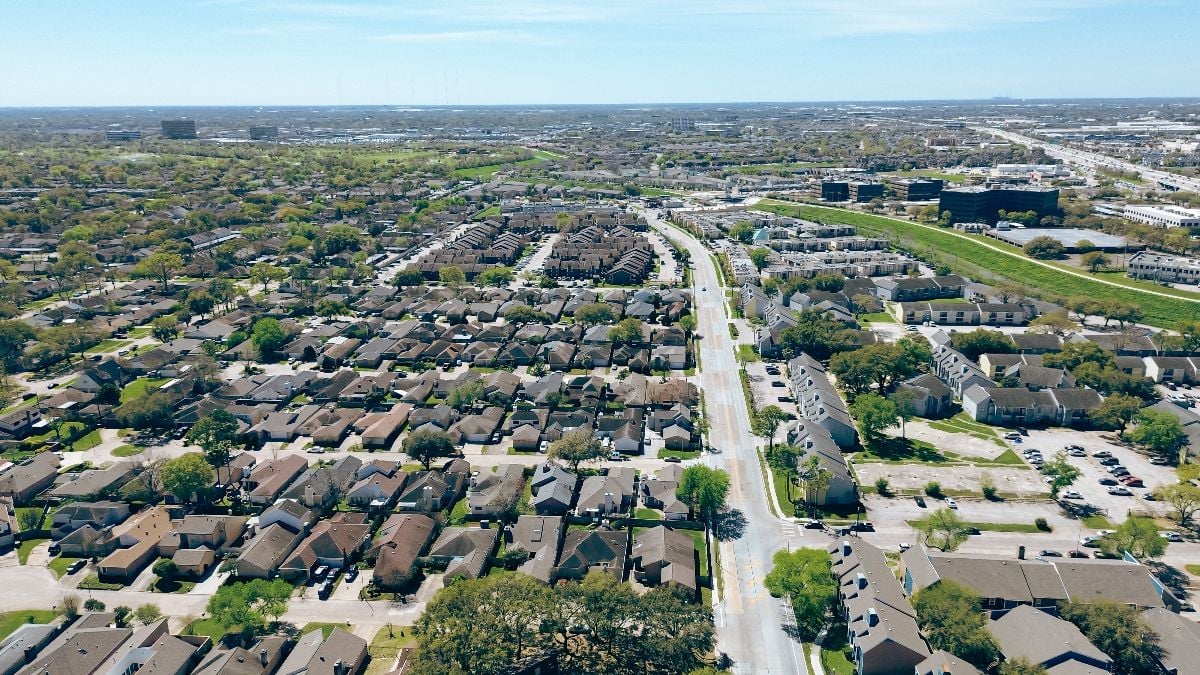
That’s July’s inventory. To put it in perspective, that’s thousands more than last summer. Imagine every seat in NRG Stadium filled with sellers waving “For Sale” signs. Buyers suddenly have options — and options change psychology.
22. Inventory surged 31% year over year.
From 28,322 in July 2024 to 37,089 in July 2025. That’s not a seasonal bump, that’s a supply wave. Sellers are testing the market, investors are unloading, and builders are adding to the pile. Supply up + demand flat = gravity starts working on prices.
21. Months of supply crept past 6 months.

Inventory ÷ sales = months of supply. In July, it hit ~6.0 months, up from ~4.8 a year ago. That’s the line between a seller’s market and a buyer’s market. For the first time in years, Houston is leaning toward balance — and that means buyers can negotiate instead of groveling.
20. Sales count didn’t collapse, but it’s not enough.
6,157 homes sold in July 2025, up +4.1% from last year’s 5,917. That sounds decent until you remember inventory jumped 31%. More homes are closing, but far more are sitting. It’s like bailing water from a boat with a teacup while the waves keep pouring in.
19. Homes are sitting for 63 days pending.
That’s how long the average Houston home lingers under contract. A year ago, it was 49 days; last month it was 60. This month it ticked up to 63. That’s nearly two months of limbo for sellers waiting on deals to finalize. Buyers clearly aren’t racing — they’re shopping, negotiating, and dragging their feet.
18. The Market Temperature Index slipped to 46.

Remember: 50 means balanced, above 50 favors sellers, below 50 favors buyers. Houston is now at 46, down from 50 last year and 47 last month. It’s like watching a thermometer dip below freezing — not catastrophic yet, but it’s trending colder.
17. The city average hides the real story.
The median neighborhood home value is $249,646, well below the city’s $267K. More than 56% of neighborhoods sit under the city average. Translation: Half the city isn’t living in “average Houston,” they’re living in below-average Houston.
16. One neighborhood’s typical home costs just $63,505.
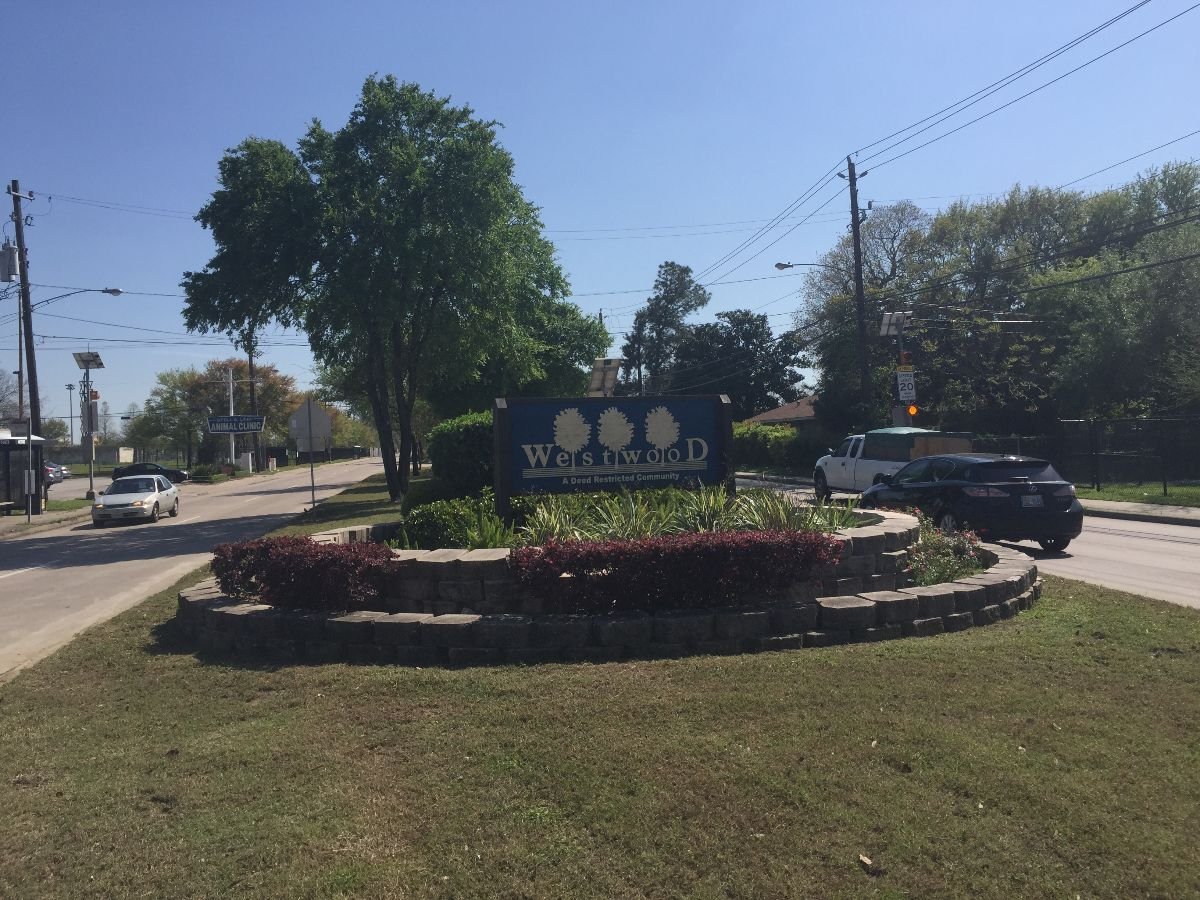
That’s Westwood. In a city where some areas top $3 million, Westwood’s homes look like relics from another era. Throw in South Park (~$137K), Harrisburg–Manchester (~$142K), Kashmere Gardens (~$147K), and Trinity–Houston Gardens (~$147K), and you’ve got a pocket of neighborhoods where affordability still exists — but at what trade-off?
15. Luxury neighborhoods are playing in the millions.
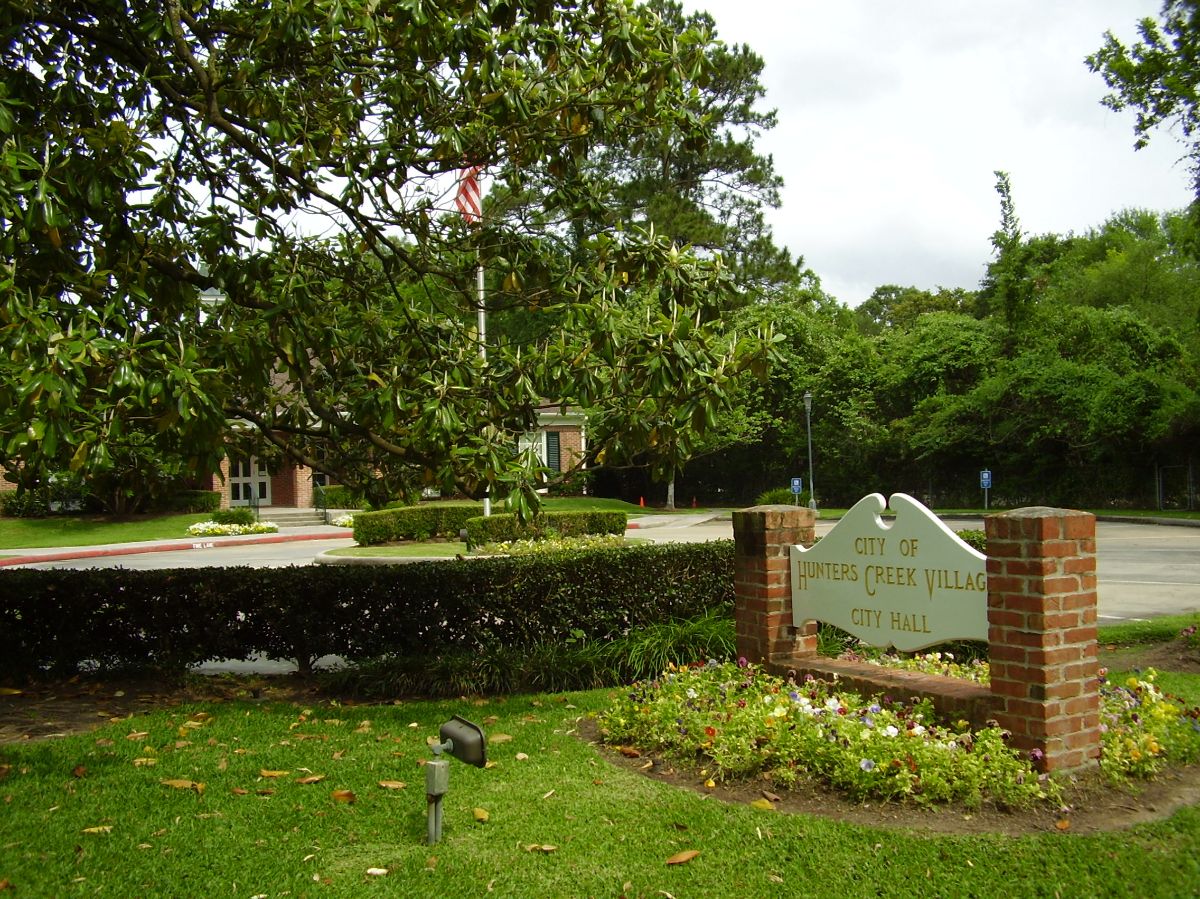
At the top end, you’ve got Piney Point (~$3.04M), Hunters Creek Village (~$2.54M), Bunker Hill Village (~$2.32M), Southside Place (~$1.98M), and West University Place (~$1.75M). These aren’t “expensive,” they’re elite — and they distort Houston’s averages into looking healthier than they are for everyday buyers.
14. The spread from bottom to top is 48×.
Piney Point’s ~$3.04M vs. Westwood’s ~$63.5K is a 47.9-to-1 gap. That’s not a market, that’s two different universes sharing a zip code. Few cities in America show this kind of internal housing inequality.
13. Even the “middle 80%” is fractured.
🔥 Would you like to save this?
The 10th percentile neighborhood is ~$168K; the 90th percentile is ~$703K. That’s a 4.17× spread inside the so-called middle tier. Middle-class housing in Houston is less a stable band and more a chaotic seesaw.
12. Nearly a third of neighborhoods are still under $200K.
Specifically, about 30.7%. If you’re searching for affordability, these areas still exist — but they’re shrinking in share as more neighborhoods drift above $250K.
11. About 10.9% of neighborhoods are above $700K.
That’s not the majority, but it’s enough to skew perceptions. These luxury pockets carry outsized weight in averages, making the city look more expensive overall, even while a third of neighborhoods sit under $200K.
10. Last summer felt hotter because it was.
The Market Temperature Index fell 4 points YoY (50 → 46). Sellers who were used to multiple offers are now staring at crickets. Buyers can sense it, and the data confirms it.
9. The cooling trend isn’t subtle.

In just one month, the temperature slipped by 1 point, and the days pending jumped by 3. That’s the kind of shift you can feel on the ground — open houses with fewer visitors, sellers getting nervous after 30 days on market.
8. Inventory rose another 4% month over month.
From 35,665 in June → 37,089 in July. That’s not seasonal noise, that’s acceleration. More homes are coming online than buyers are willing to scoop up.
7. Buyers now have genuine leverage.

When there’s 6 months of supply, homes take 63 days pending, and the temperature is at 46, you’re not in “bidding war Houston” anymore. Buyers can demand repairs, credits, and longer inspection windows — things unthinkable in 2021.
6. Citywide prices are slipping while luxury hangs tough.
The average Houston home fell ~3% YoY, but Piney Point is still $3 million, West U is still $1.75M. Luxury isn’t budging, while middle-class neighborhoods take the hit. That divergence is a warning sign of stress.
5. The “average” is a mirage.
About 43.6% of neighborhoods are above $267K, and 56.4% are below. When more than half your neighborhoods are cheaper than the “average,” you’re looking at a skewed picture.
4. Sales growth isn’t enough to offset the glut.

Yes, sales rose 4.1% YoY. But when inventory jumps 31% at the same time, it’s like adding a teaspoon of sugar to a gallon of unsweet tea. Buyers aren’t keeping pace with sellers.
3. Sellers are losing pricing power.

With homes taking 63 days pending and nearly half the city priced below “average,” your first offer might be your best offer. Overpricing now isn’t a flex — it’s a mistake.
2. All the ingredients for price cuts are in the bowl.

Inventory up. Days pending up. Market temperature down. City ZHVI down. That’s the recipe you’ve seen in every past correction. Price cuts aren’t coming — they’re already happening quietly in MLS feeds.
1. Houston is flirting with its first broad correction since 2008.
🔥 Would you like to save this?
Put it all together: city prices are sliding, months of supply crossed 6, pendings slowed by 14 days in a year, and sellers are flooding the market. Unless mortgage rates collapse or new demand floods in, Houston is on the cusp of a correction it hasn’t faced in nearly two decades.
Quick Reference (Houston – July 2025)
- City ZHVI (Houston, TX): $267,347 (↓ ~3.0% YoY from $275,514)
- Metro Inventory: 37,089 (↑ ~31% YoY, ↑ ~4% MoM)
- Metro Sales Count: 6,157 (↑ ~4.1% YoY, ↓ ~2.2% MoM)
- Mean Days Pending: 63 (↑ +14 YoY, ↑ +3 MoM)
- Market Temperature Index: 46 (↓ 4 YoY, ↓ 1 MoM)
- Months of Supply (approx): ~6.0 (vs ~4.8 last July)
- Neighborhoods analyzed: 101 (City of Houston)
- Median neighborhood value: $249,646 (below city ZHVI $267K)
- P10–P90 band: $168,371 → $702,834 (~4.2× spread)
- Lowest neighborhood: Westwood ~ $63,505
- Highest neighborhood: Piney Point ~ $3,043,352