Counties with the shortest life expectancy in Michigan
Life expectancy can be affected by a variety of factors. About 25% of your lifespan is determined by genetics, according to the National Library of Medicine. Health and wellness habits—like following a balanced, nutrient-rich diet; not smoking; drinking minimal alcohol; maintaining a healthy weight; and staying physically active—can add more than a decade to your life, research from the National Institutes of Health shows. While these factors are significant, another important element that you might not have considered is your environment and community.
In order to come up with the very specific design ideas, we create most designs with the assistance of state-of-the-art AI interior design software. Also, assume links that take you off the site are affiliate links such as links to Amazon. this means we may earn a commission if you buy something.
While life expectancy generally increases annually in the United States—jumping from about 70.8 years old to 77.5 between 1970 and 2022, according to the Centers for Disease Control and Prevention—this particular metric can vary from state to state or even county to county. In some parts of the country, the average lifespan is getting shorter based on a variety of risk factors on top of health, including socioeconomic factors like poverty, unemployment, income, and education.
According to a 2020 study from researchers at Penn State, West Virginia, and Michigan State Universities, communities with a higher population density, more fast food restaurants, and a high number of extraction industry-based jobs tend to have shorter life expectancies.
To find out how life expectancy varies within Michigan, Stacker used 2024 County Health Rankings & Roadmaps from the University of Wisconsin Population Health Institute to identify the counties with the shortest life expectancy. Life expectancy measures the average number of years from birth a person can expect to live and is calculated based on the number of deaths in a given time period and the average number of people at risk of dying during that period. Counties with unreliable or insufficient data were excluded from the analysis. Mortality data came from the National Vital Statistics System.
Read on to see if your county is on the list.
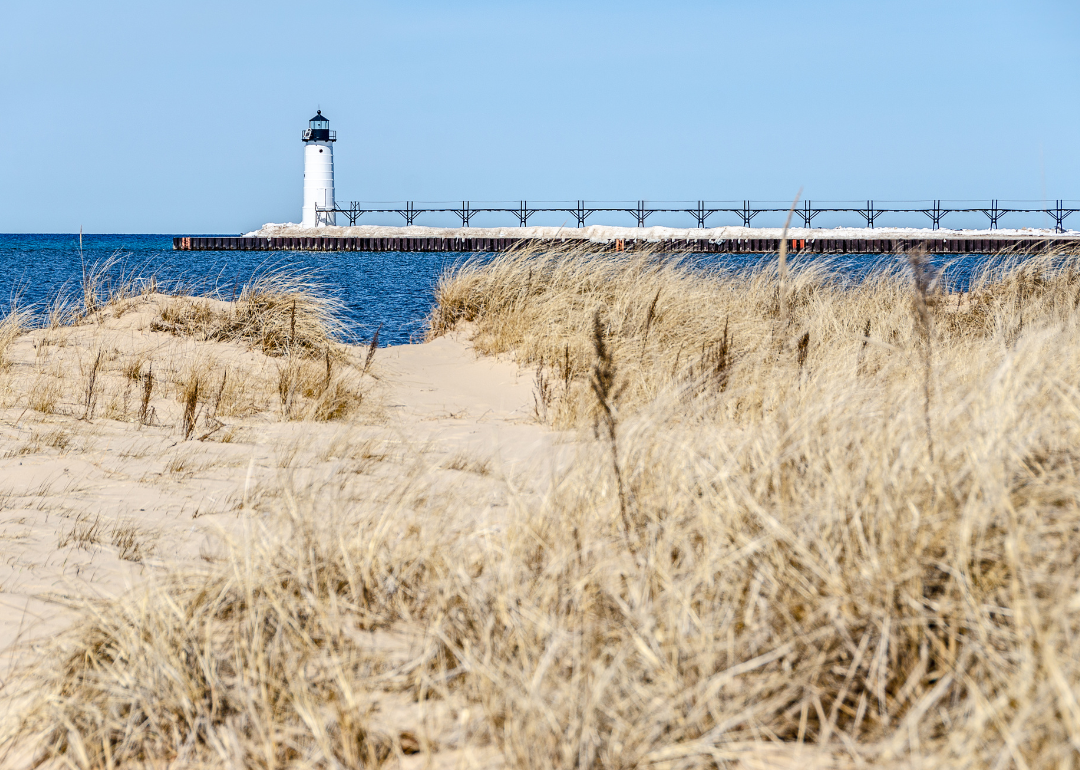
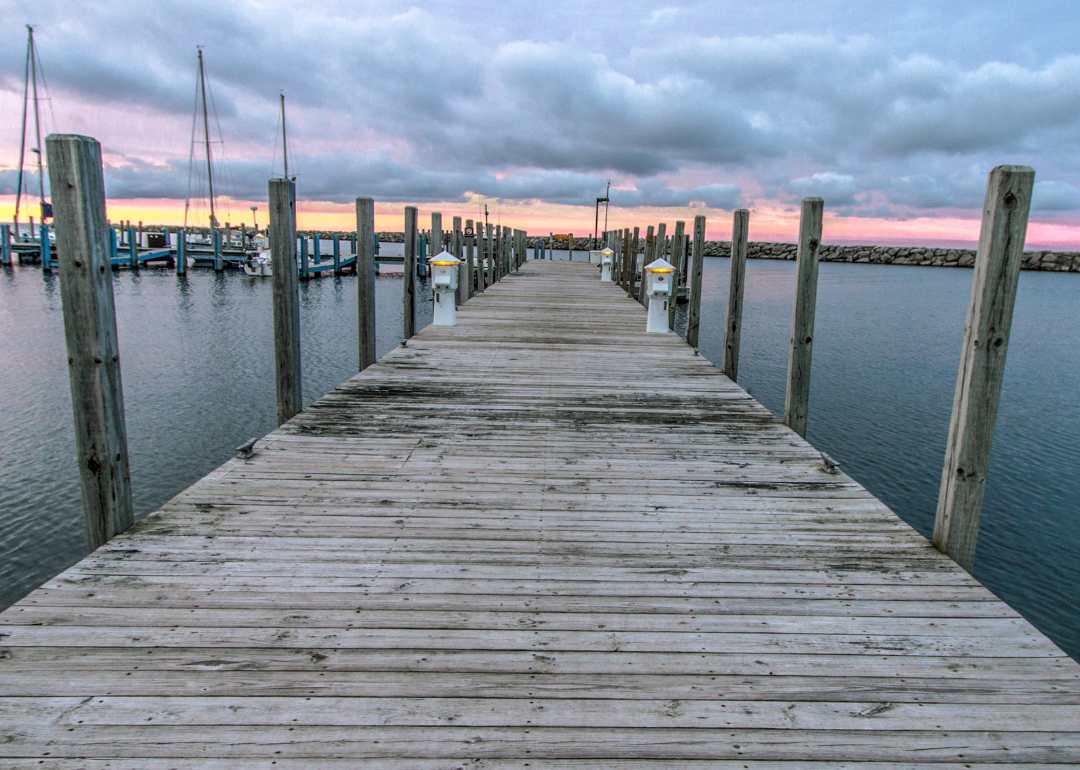
You may also like: Best beach towns on the Great Lakes
#42. Gogebic County (tie)
– Life expectancy: 76.6 years
— Same as state average

About
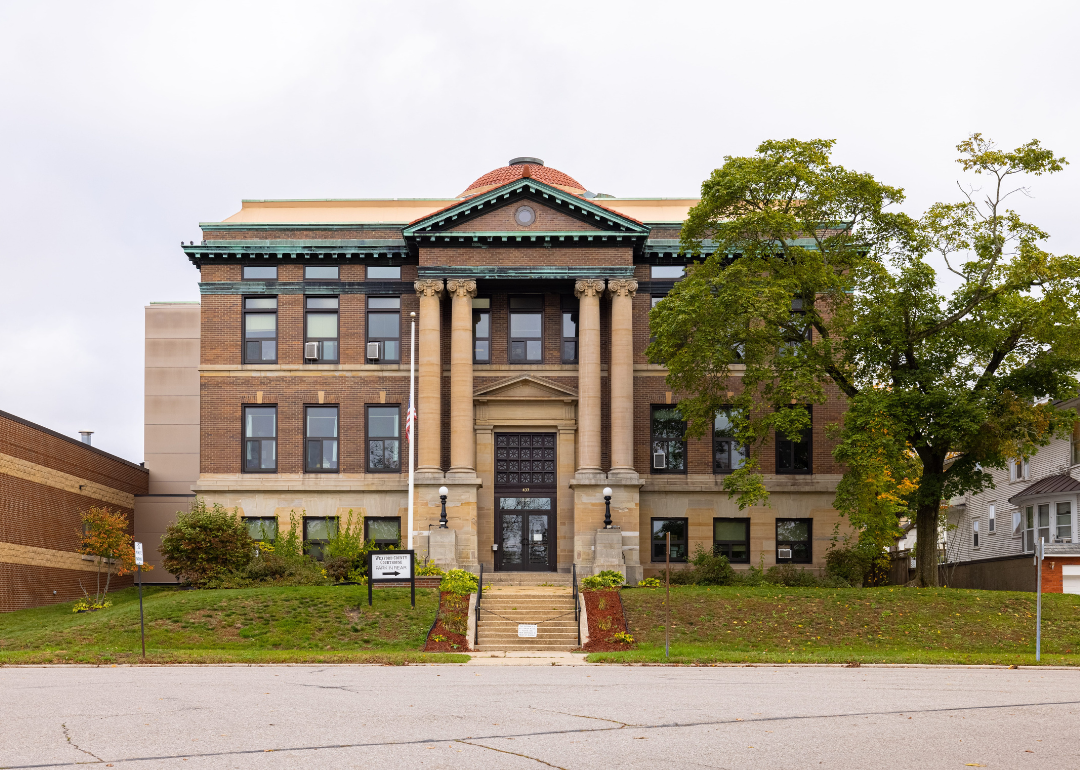
Gogebic County carries a legacy shaped by iron mining and logging, industries that drew settlers to Michigan’s western Upper Peninsula. Bessemer, the county seat, anchors schools, commerce, and civic life, while Ironwood reflects the region’s industrial heritage and cultural traditions. The county’s identity blends its working past with the resilience of communities rooted in the northwoods.
Forests, lakes, and the rugged shores of Lake Superior form the natural backdrop, offering both livelihood and recreation. Festivals, winter sports, and strong family networks continue to tie residents together across generations. Gogebic County endures as a place where history, land, and community remain inseparably bound.
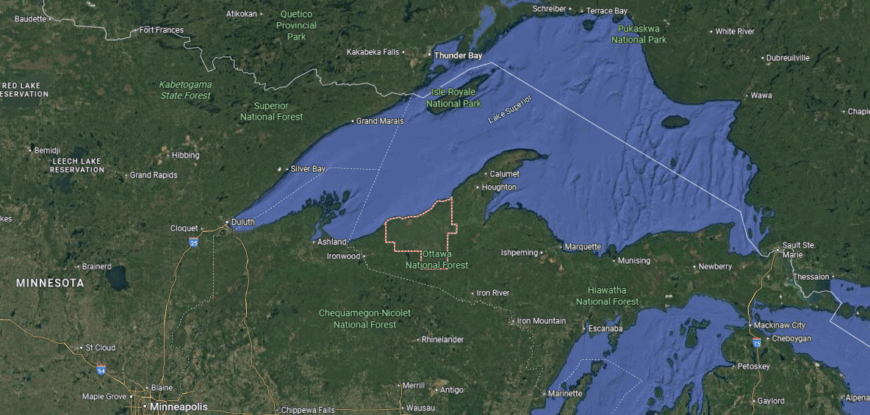
Where is Gogebic County?
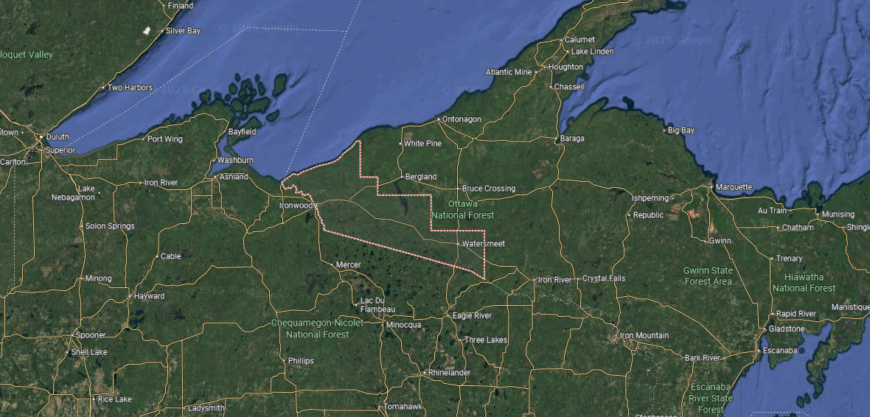
Gogebic County is located in the western Upper Peninsula of Michigan, along the state’s border with Wisconsin. It covers more than 1,400 square miles, making it one of the larger counties in the region, with a landscape of forests, lakes, and rugged terrain. The county lies along the southern shore of Lake Superior and includes parts of the Ottawa National Forest.
Bessemer, the county seat, is positioned near the center and serves as the hub for government and community life. Other towns include Ironwood, which anchors the western edge along the Wisconsin line, and Wakefield, near Sunday Lake. With its lakefront, forestlands, and cross-border location, Gogebic County reflects the natural beauty and heritage of Michigan’s Upper Peninsula.
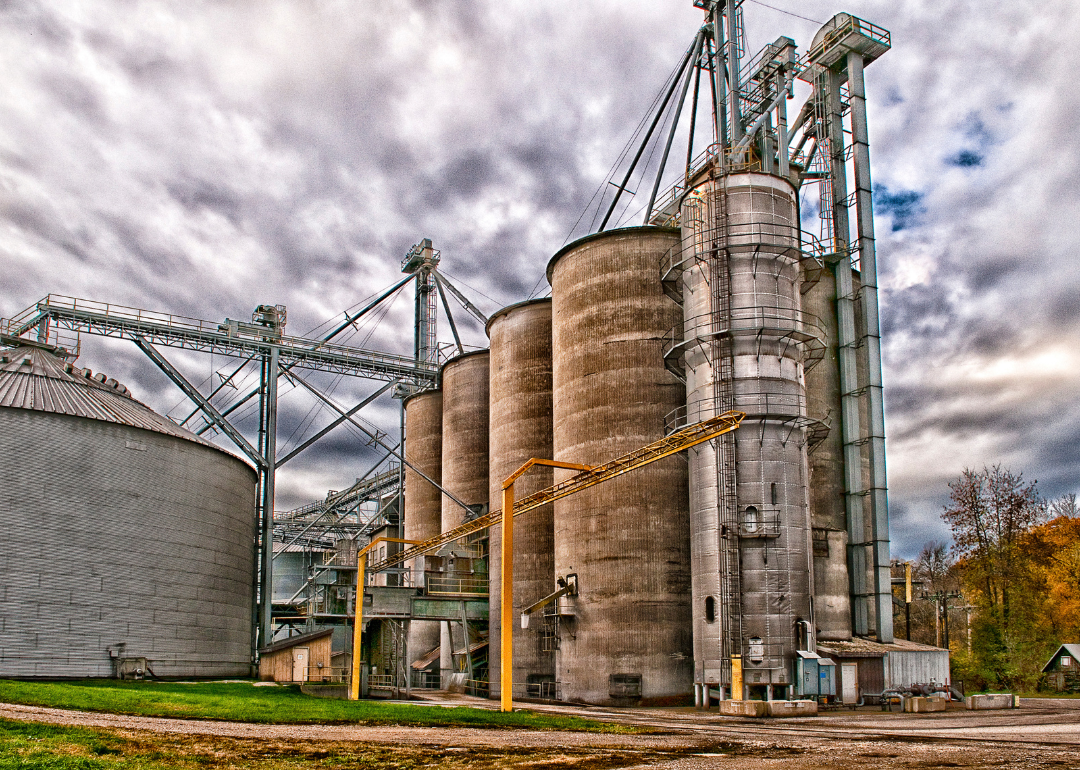
#41. Delta County (tie)
– Life expectancy: 76.5 years
— 0.1 years lower than the state average
About
Delta County is defined by its community spirit, where festivals, church gatherings, and school events highlight the traditions of Michigan’s Upper Peninsula. Escanaba, the county seat, serves as a hub for commerce, education, and cultural life, tying together smaller towns and rural areas. The county’s identity reflects both small-town connections and the influence of the Great Lakes.
Its history is tied to logging, shipping, and manufacturing, industries that shaped settlement and growth along the bays of Lake Michigan. Forests, lakes, and shoreline provide both livelihood and recreation, grounding families in a distinctive landscape. Delta County continues to stand as a place where culture, land, and history remain firmly connected.
Where is Delta County?
Delta County is located in Michigan’s Upper Peninsula along the northern shore of Lake Michigan. It spans more than 1,700 square miles, including extensive forestland, farmland, and over 200 miles of Lake Michigan shoreline. The county lies at the head of Little Bay de Noc and is known for its mix of waterfront communities, inland lakes, and access to the Hiawatha National Forest.
Escanaba, the county seat and largest city, anchors government, commerce, and culture at the bayfront. Gladstone sits nearby as another key hub, while smaller communities such as Rapid River, Bark River, and Nahma connect the rural interior and shoreline. With its Great Lakes setting, forests, and small towns, Delta County reflects the blend of natural resources and community life characteristic of Michigan’s Upper Peninsula.
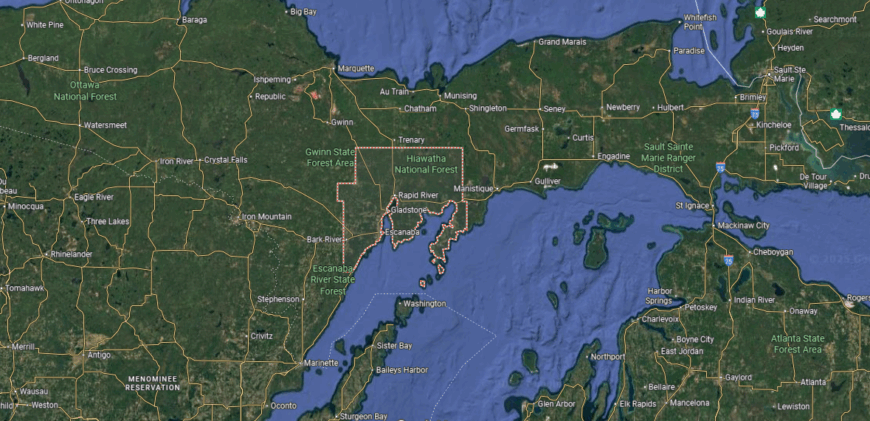
#40. Newaygo County (tie)
– Life expectancy: 76.5 years
— 0.1 years lower than the state average
About
Newaygo County lies in western Michigan, where forests, rivers, and rolling hills form a landscape well known for its natural beauty. White Cloud, the county seat, serves as a center for schools, commerce, and civic life, connecting smaller towns and rural communities. The Muskegon River and numerous lakes anchor both the county’s scenery and its way of life.
Its history is rooted in logging and farming, industries that shaped settlement and development across generations. Festivals, outdoor recreation, and community traditions keep residents connected to both heritage and place. Newaygo County remains a place where land, history, and culture remain firmly interwoven.
Where is Newaygo County?
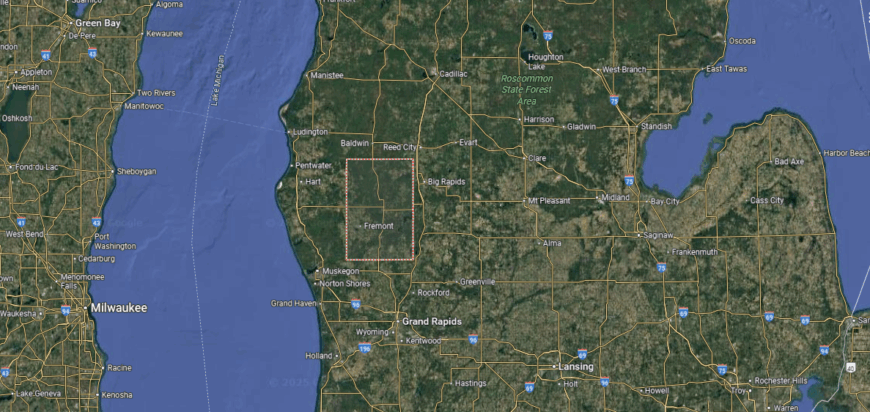
Newaygo County is located in western Michigan, about 35 miles north of Grand Rapids. It spans more than 850 square miles of forestland, farmland, and river valleys within the Lower Peninsula. The Muskegon River flows through the county, along with numerous lakes and streams that shape both its geography and recreation.
White Cloud, the county seat, sits near the center and serves as the hub for government and community life. Fremont and Newaygo are other key towns, each anchoring parts of the county with commerce, culture, and local industry. With its wooded terrain, waterways, and small-town centers, Newaygo County reflects the natural and rural character of western Michigan.
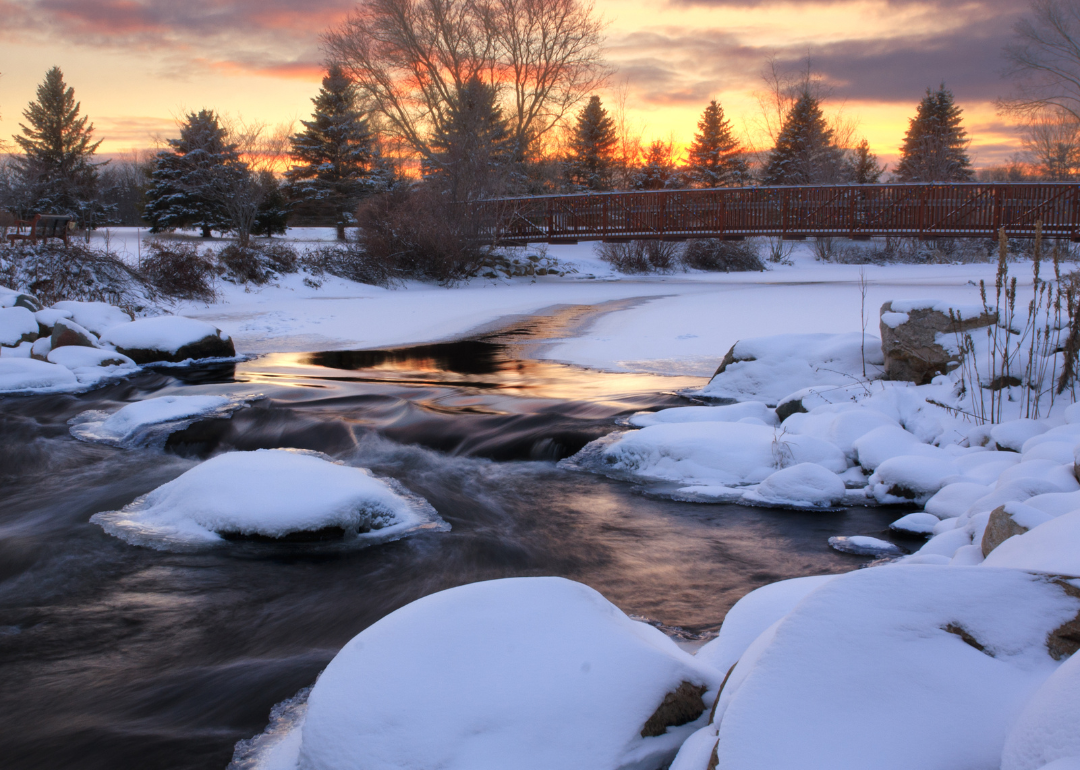
#39. Crawford County (tie)
– Life expectancy: 76.5 years
— 0.1 years lower than the state average
About
Crawford County’s story is tied to the lumber era, when dense pine forests of northern Michigan fueled early settlement and industry. Grayling, the county seat, grew as a center for logging, schools, and civic life, and it remains the county’s hub today. The county’s identity reflects both its historic roots and its continuing ties to the surrounding forests.
The Au Sable and Manistee Rivers cut through its landscape, offering recreation, livelihood, and a deep connection to nature. Festivals, outdoor traditions, and community gatherings keep cultural life strong across generations. Crawford County endures as a place where history, land, and community remain firmly linked.
Where is Crawford County?
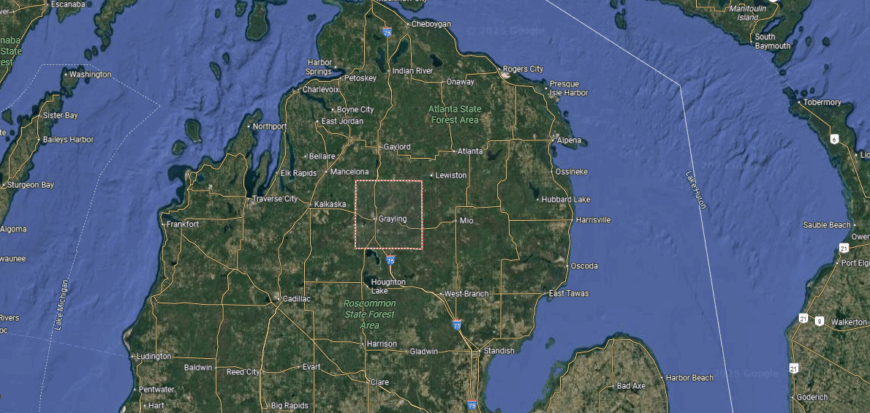
Crawford County is located in the northern Lower Peninsula of Michigan, about 55 miles northeast of Traverse City and 65 miles southeast of Petoskey. It covers more than 550 square miles of forested terrain, much of it part of the Huron National Forest and state-protected lands. The Au Sable River runs across the county, providing a defining natural feature and recreational resource.
Grayling, the county seat, lies near the center and serves as the hub for government, business, and tourism. Smaller communities such as Lovells and Frederic are scattered along the river valleys and forested areas. With its wooded landscape, river access, and central location in northern Michigan, Crawford County is closely tied to outdoor recreation and natural heritage.
#38. Macomb County (tie)
– Life expectancy: 76.5 years
— 0.1 years lower than the state average
You may also like: Best- and worst-run cities in Michigan
About
Macomb County is shaped by its strong communities, where festivals, neighborhood traditions, and civic life highlight both suburban and industrial roots. Mount Clemens, the county seat, provides a historic and cultural anchor, while larger cities like Warren reflect the county’s role as a hub of manufacturing and commerce. The county’s identity blends local pride with the energy of the greater Detroit metropolitan area.
Its history includes farming, river trade, and later the rise of the auto industry, each leaving a lasting mark on its development. The shoreline of Lake St. Clair and regional parks provide recreation and a natural balance to urban growth. Macomb County endures as a place where culture, history, and community remain firmly interwoven.
Where is Macomb County?
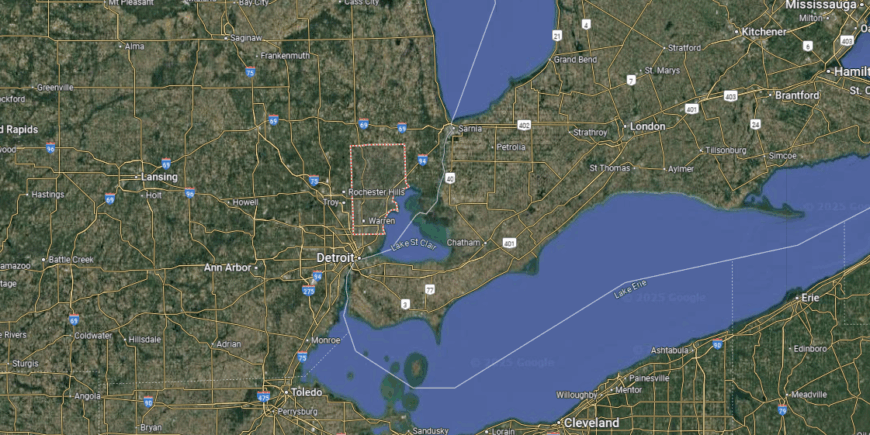
Macomb County is located in southeastern Michigan, forming part of the Detroit metropolitan area. It borders Lake St. Clair to the east and covers more than 480 square miles of urban, suburban, and rural landscapes. The county lies directly north of Wayne County and about 15 miles northeast of downtown Detroit.
Mount Clemens, the county seat, is positioned near the Clinton River and serves as the governmental hub. Larger cities such as Warren, Sterling Heights, and St. Clair Shores anchor the southern portion, while the northern areas remain more rural and agricultural. With its mix of lakefront, industry, suburbs, and farmland, Macomb County reflects the diverse character of southeast Michigan.
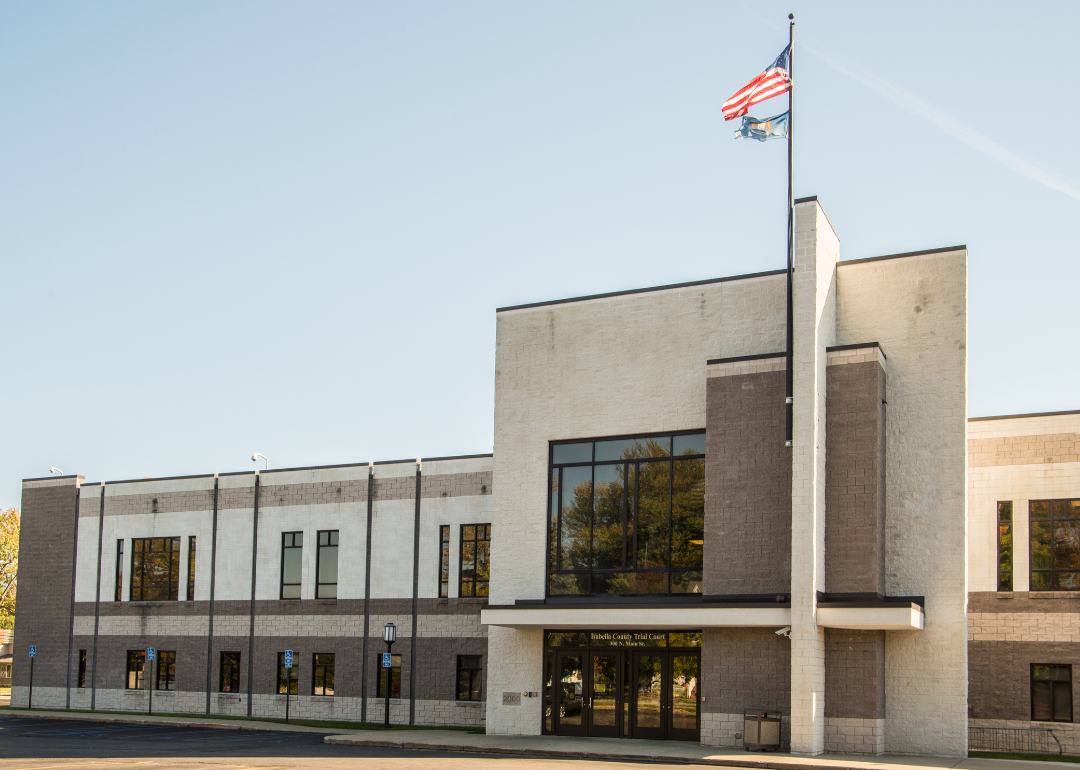
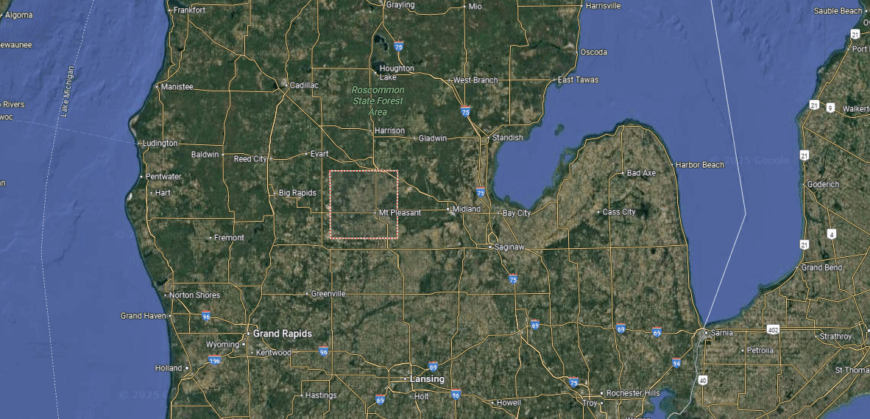
#37. Isabella County (tie)
– Life expectancy: 76.2 years
— 0.4 years lower than the state average
About
Isabella County lies in central Michigan, where rolling farmland, forests, and rivers shape the landscape of the region. Mount Pleasant, the county seat, serves as a hub for education, commerce, and culture, home to Central Michigan University and a center for surrounding rural communities. The county’s identity reflects both its natural setting and its role as an educational and cultural anchor.
Its history is tied to farming, Native American heritage, and the growth of institutions that brought new opportunity to the area. Festivals, university events, and community traditions keep residents connected to both past and present. Isabella County continues to stand as a place where land, history, and community remain strongly linked.
Where is Isabella County?
🔥 Would you like to save this?
Isabella County is situated in central Michigan, about 65 miles north of Lansing and 30 miles west of Midland. It covers just over 570 square miles of farmland, rolling hills, and forestland within the Lower Peninsula. The Chippewa River runs through the county, shaping its landscape and providing recreation.
Mount Pleasant, the county seat, lies near the center and serves as the hub for government, commerce, and culture. It is also home to Central Michigan University, which plays a major role in the county’s identity. With its mix of agriculture, education, and small-town communities, Isabella County represents the character of mid-Michigan.
#36. Manistee County (tie)
– Life expectancy: 76.2 years
— 0.4 years lower than the state average
About
Manistee County’s story is rooted in the lumber era, when sawmills and shipping along Lake Michigan made the region a hub of industry. Manistee, the county seat, still reflects this heritage through historic architecture, civic life, and its connection to the waterfront. The county’s identity blends its industrial past with the steady traditions of small-town living.
Forests, rivers, and the shoreline of Lake Michigan frame both work and recreation, sustaining a deep tie to the land. Festivals, fishing traditions, and community gatherings continue to bring residents together across generations. Manistee County stands as a place where history, landscape, and culture remain firmly interwoven.
Where is Manistee County?
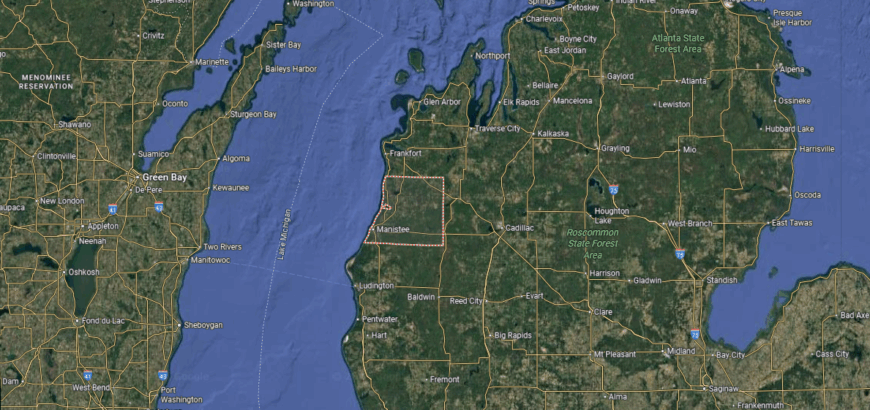
Manistee County is located along the northwestern shore of Michigan’s Lower Peninsula, bordered by Lake Michigan to the west. It spans about 1,280 square miles, with forested hills, inland lakes, and stretches of sandy shoreline. The county lies roughly 120 miles northwest of Grand Rapids and is part of Michigan’s scenic coastal region.
Manistee, the county seat, sits at the mouth of the Manistee River on Lake Michigan and serves as the hub for government and commerce. Smaller communities such as Onekama, Bear Lake, and Kaleva are spread across the countryside and along the lakes. With its mix of shoreline, rivers, and forestland, Manistee County reflects the natural beauty and heritage of northwest Michigan.
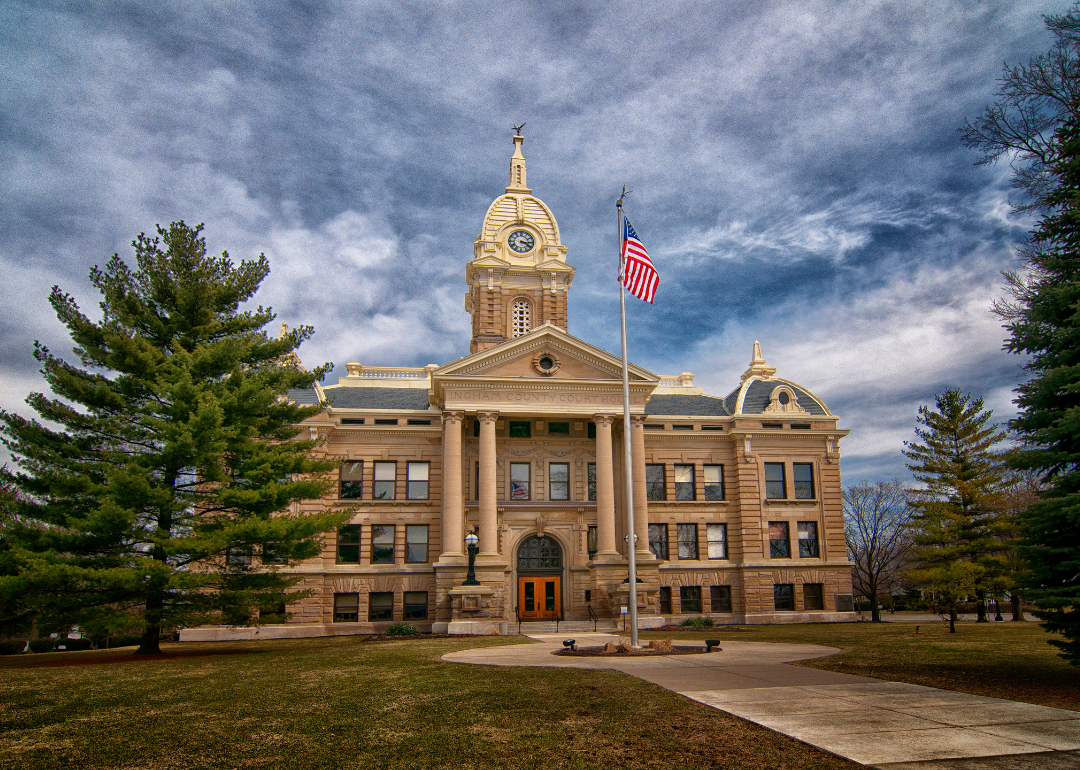
#35. Ingham County (tie)
– Life expectancy: 76.1 years
— 0.5 years lower than the state average
About
Ingham County is shaped by its role as both a governmental and educational center, where civic traditions, university life, and community events connect people across the region. Lansing, the state capital and part of the county, anchors political, cultural, and economic activity, while East Lansing reflects the influence of Michigan State University. The county’s identity blends local pride with the broader energy of a capital region.
Its history is tied to statehood, agriculture, and the growth of institutions that continue to define its character. Parks, festivals, and university-centered traditions keep community life vibrant across generations. Ingham County endures as a place where culture, history, and civic identity remain firmly linked.
Where is Ingham County?
Ingham County is located in south-central Michigan, covering more than 550 square miles of farmland, rivers, and urban centers. It lies about 90 miles west of Detroit and 65 miles east of Grand Rapids, making it a central part of the Lower Peninsula. The county is crossed by the Grand River and several smaller tributaries that shape its landscape.
Mason, the county seat, is situated near the geographic center and serves as the governmental hub. Lansing, the state capital, extends into the county and anchors its economy, culture, and education, alongside East Lansing, home to Michigan State University. With its mix of farmland, river valleys, and urban centers, Ingham County plays a central role in Michigan’s political and academic life.
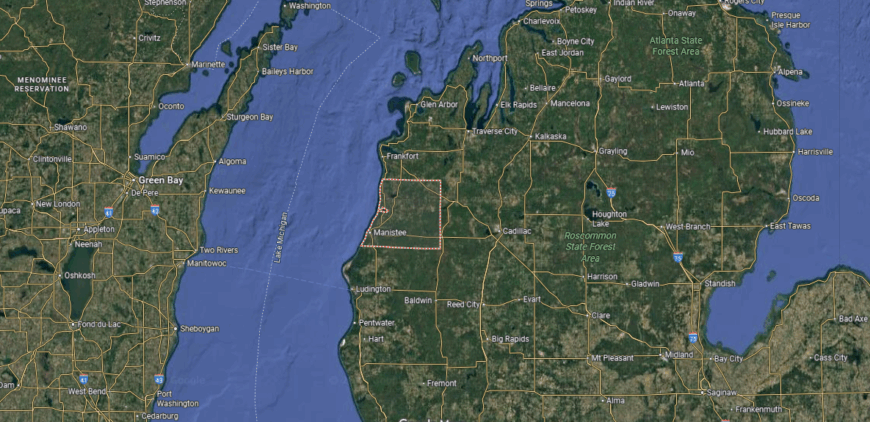
#34. Van Buren County (tie)
– Life expectancy: 76.1 years
— 0.5 years lower than the state average

About
Van Buren County carries a heritage shaped by farming, fruit orchards, and the shipping routes that once defined its lakeshore towns. Paw Paw and South Haven both reflect this history, with one serving as the county seat and the other as a vibrant port community. Generational families have passed down traditions tied to agriculture and community pride.
The shoreline of Lake Michigan, along with inland farms and orchards, continues to guide the county’s way of life. Festivals, markets, and neighborhood gatherings highlight the ongoing connection between land and community. Van Buren County stands as a place where history, culture, and geography remain closely bound.
Where is Van Buren County?
Van Buren County is situated in southwestern Michigan along the eastern shore of Lake Michigan. It spans about 1,090 square miles of shoreline, orchards, farmland, and inland lakes, giving it both agricultural and recreational importance. The county lies roughly 45 miles west of Kalamazoo and about 65 miles southwest of Grand Rapids.
Paw Paw, the county seat, sits near the center and serves as the hub for government and local commerce. South Haven, on the Lake Michigan coast, anchors tourism and trade, while smaller towns such as Decatur, Hartford, and Lawrence connect the rural interior. With its lakefront, vineyards, orchards, and small-town centers, Van Buren County blends natural resources with community life in southwest Michigan.
#33. Branch County (tie)
– Life expectancy: 76.1 years
— 0.5 years lower than the state average
You may also like: Best colleges in Michigan

About
Branch County is known for its close-knit communities, where school events, church gatherings, and county fairs provide a rhythm of daily life. Coldwater, the county seat, serves as a hub for education, commerce, and civic traditions, anchoring smaller towns and rural areas. The county’s identity blends small-town values with the cultural energy of community traditions.
Its history is tied to farming, milling, and regional trade, which supported settlement and growth across generations. Rolling farmland, lakes, and rivers shape the landscape, offering both livelihood and recreation. Branch County continues to stand as a place where culture, history, and land remain firmly interwoven.
Where is Branch County?
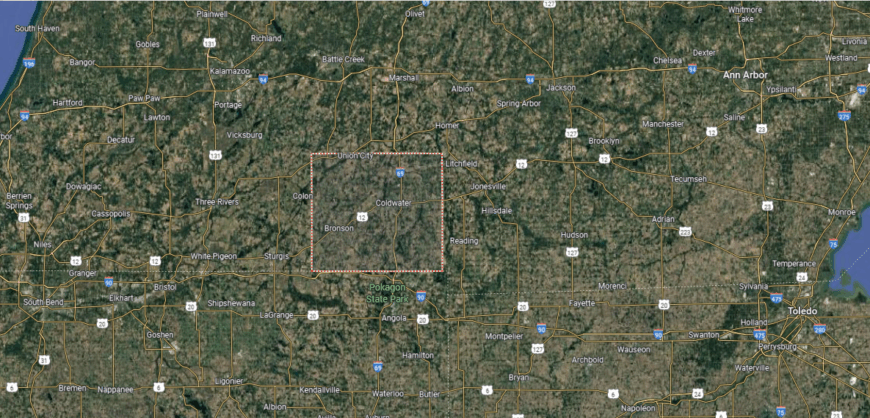
Branch County is located in southern Michigan along the Indiana border. It covers more than 500 square miles of farmland, lakes, and small towns within the Lower Peninsula. The county lies about 65 miles south of Lansing and 60 miles northwest of Toledo, Ohio, giving it ties to both Michigan and northern Indiana.
Coldwater, the county seat, is positioned near the center and serves as the hub for government, business, and community life. Smaller communities such as Quincy, Bronson, and Union City connect the surrounding rural areas. With its farmland, chain of lakes, and borderland setting, Branch County reflects the rural character of southern Michigan.
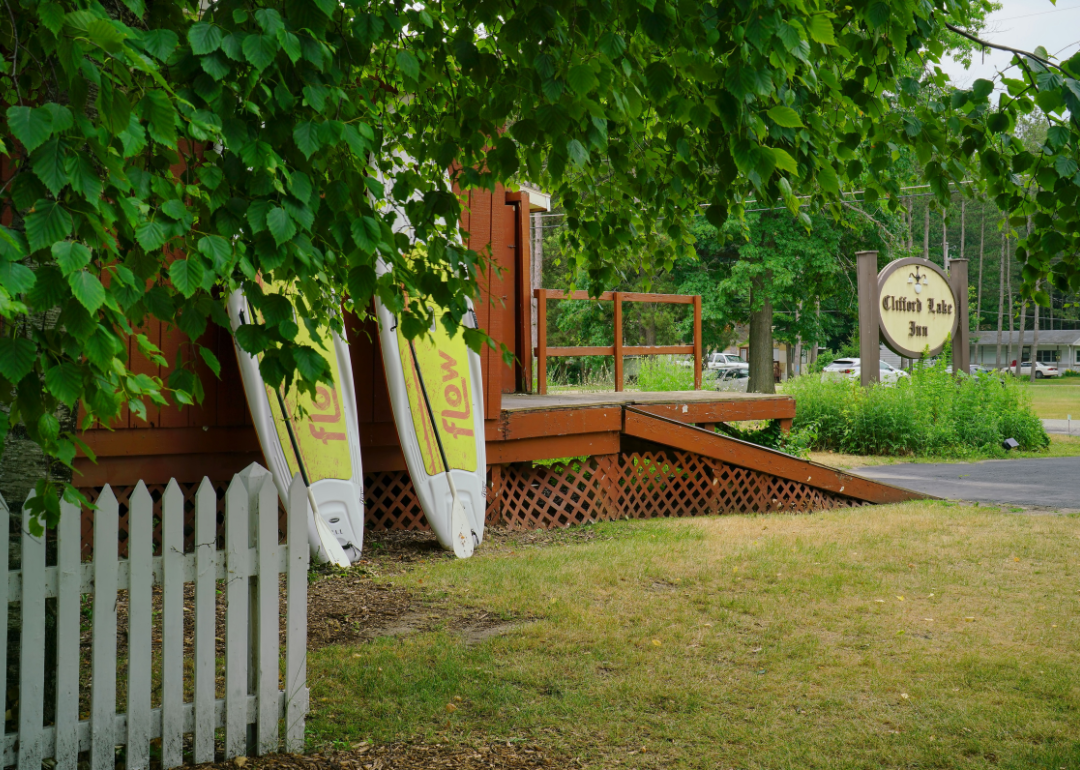
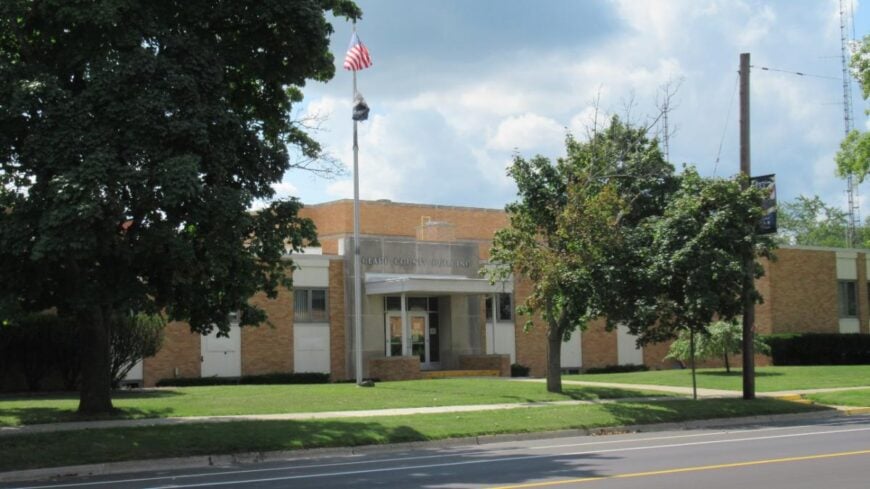
#32. Gratiot County (tie)
– Life expectancy: 76.1 years
— 0.5 years lower than the state average
About
Gratiot County lies in the heart of Michigan’s Lower Peninsula, where open farmland and small towns define the landscape. Ithaca, the county seat, provides a hub for schools, commerce, and civic life, while Alma reflects the county’s educational and cultural presence. The county’s identity blends its agricultural foundation with the connections of close-knit communities.
Its history is tied to farming, milling, and early settlement, which shaped its growth over generations. Festivals, school events, and family traditions preserve continuity and strengthen community bonds. Gratiot County endures as a place where land, history, and culture remain closely linked.
Where is Gratiot County?
Gratiot County is located in the central part of Michigan’s Lower Peninsula. It spans about 570 square miles of primarily agricultural land, with gently rolling plains and scattered woodlots. The county lies roughly 45 miles north of Lansing and 30 miles south of Mount Pleasant, placing it within easy reach of several regional centers.
Ithaca, the county seat, sits near the geographic center and serves as the hub for government and local services. Alma and St. Louis, two of the larger cities, anchor the county’s economy and culture, with Alma noted for its college and St. Louis for its historic role in the region. With its farming base, small towns, and central location, Gratiot County reflects the agricultural heart of mid-Michigan.
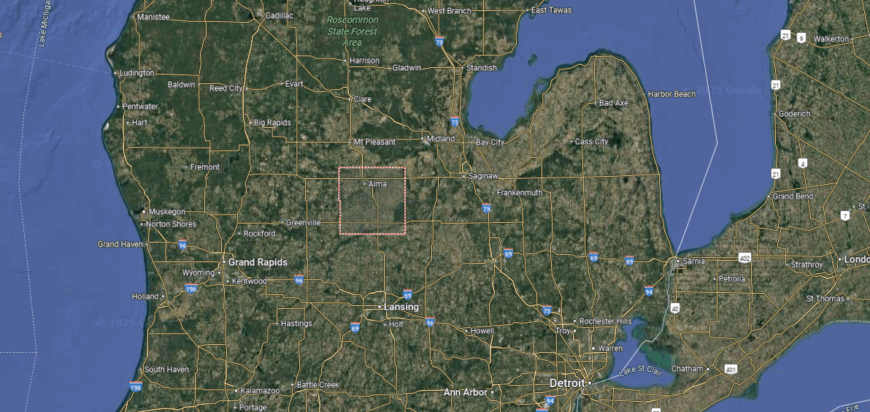
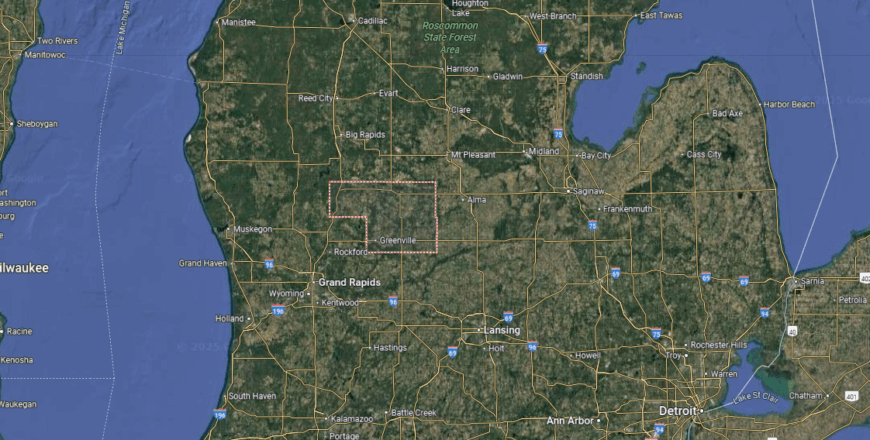
#31. Montcalm County (tie)
– Life expectancy: 76.1 years
— 0.5 years lower than the state average
About
Montcalm County’s story is tied to early settlement, farming, and the timber industry that once drove its growth. Stanton, the county seat, reflects this heritage as the center of government, schools, and civic activity for the surrounding communities. The county’s identity blends its historic roots with the steady traditions of rural Michigan life.
Rolling farmland, lakes, and forests frame the landscape, providing both livelihood and recreation. Festivals, local fairs, and generational family ties sustain cultural continuity across the county. Montcalm County remains a place where history, land, and community remain firmly connected.
Where is Montcalm County?
🔥 Would you like to save this?
Montcalm County is located in central Michigan, about 40 miles northeast of Grand Rapids and 30 miles northwest of Lansing. It spans more than 700 square miles of farmland, forests, and over 100 inland lakes. The Flat River winds through the county, creating valleys and supporting both agriculture and recreation.
Stanton, the county seat, lies near the center and serves as the hub for government and community life. Greenville, the largest city, anchors the county’s economy and culture, while smaller towns such as Howard City and Carson City connect the rural areas. With its mix of farmland, waterways, and small towns, Montcalm County reflects the balance of natural and rural character in mid-Michigan.
#30. Baraga County (tie)
– Life expectancy: 76.0 years
— 0.6 years lower than the state average
About
Baraga County is marked by its strong community ties, where church gatherings, local festivals, and tribal traditions reflect the heritage of the Upper Peninsula. L’Anse, the county seat, anchors schools, commerce, and civic life, while nearby communities maintain close connections through shared customs and events. The county’s identity blends small-town spirit with Native American culture and long-standing local traditions.
Its history is tied to logging, mining, and the waters of Lake Superior, each leaving a lasting imprint on its growth. Forests, rivers, and the vast shoreline provide both livelihood and recreation for residents across generations. Baraga County endures as a place where culture, history, and land remain inseparably linked.
Where is Baraga County?
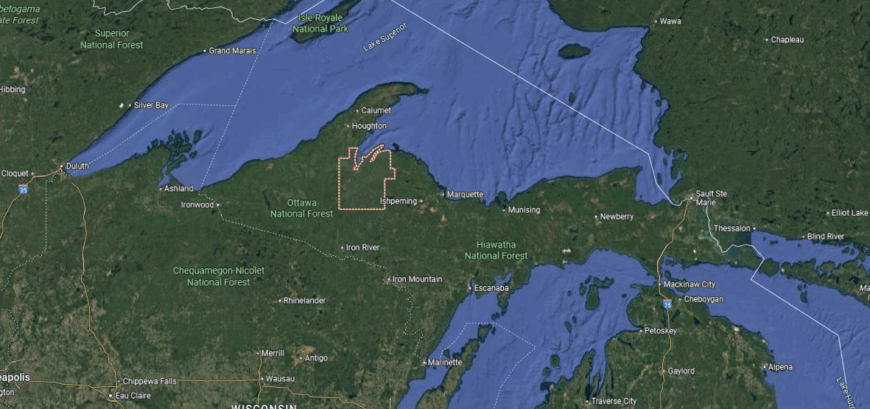
Baraga County is located in the northwestern Upper Peninsula of Michigan along the shore of Lake Superior. It covers more than 900 square miles of forestland, rugged hills, and waterways, including part of the Huron Mountains. The county lies about 70 miles west of Marquette and is home to some of the state’s most remote wilderness areas.
L’Anse, the county seat, sits on Keweenaw Bay and serves as the hub for government and local commerce. Nearby Baraga shares the bayfront and connects to U.S. Highway 41, while smaller communities and tribal lands extend into the interior. With its lakefront, forests, and mountain terrain, Baraga County reflects the natural beauty and cultural heritage of the Upper Peninsula.
#29. Lapeer County (tie)
– Life expectancy: 76.0 years
— 0.6 years lower than the state average
About
Lapeer County’s story is tied to its early settlement, with farming and milling forming the backbone of its growth. The city of Lapeer, serving as the county seat, reflects this heritage through historic architecture, schools, and civic traditions that connect residents today. Generational families have carried forward a sense of continuity rooted in both work and community pride.
Festivals, church events, and local gatherings reinforce cultural ties that remain central to county life. Rolling farmland and wooded stretches frame the landscape, offering both livelihood and recreation across the region. Lapeer County stands as a place where history, culture, and land remain firmly linked.
Where is Lapeer County?
Lapeer County is located in southeastern Michigan, about 60 miles north of Detroit and 30 miles east of Flint. It spans just over 650 square miles of rolling farmland, forested areas, and small lakes, forming part of the state’s Thumb region. The Flint River flows across the county, adding to its natural resources and rural landscape.
Lapeer, the county seat, lies near the center and serves as the hub for government, commerce, and culture. Smaller communities such as Imlay City, Almont, and Dryden connect the surrounding farmland and towns. With its mix of rural countryside, rivers, and growing communities, Lapeer County blends agricultural heritage with links to metropolitan southeast Michigan.
#28. Sanilac County
– Life expectancy: 75.9 years
— 0.7 years lower than the state average
You may also like: Counties with the highest cancer rates in Michigan
About
Sanilac County rests along the Lake Huron shoreline, where farming communities meet the influence of the Great Lakes. Sandusky, the county seat, anchors civic life, schools, and commerce, while smaller towns and villages carry on local traditions.
The county’s history is tied to farming, shipping, and the timber trade, industries that shaped settlement and growth. Festivals, lake-centered recreation, and church gatherings continue to sustain community pride. Together, land, history, and culture define Sanilac County as a place where shoreline and countryside remain closely linked.
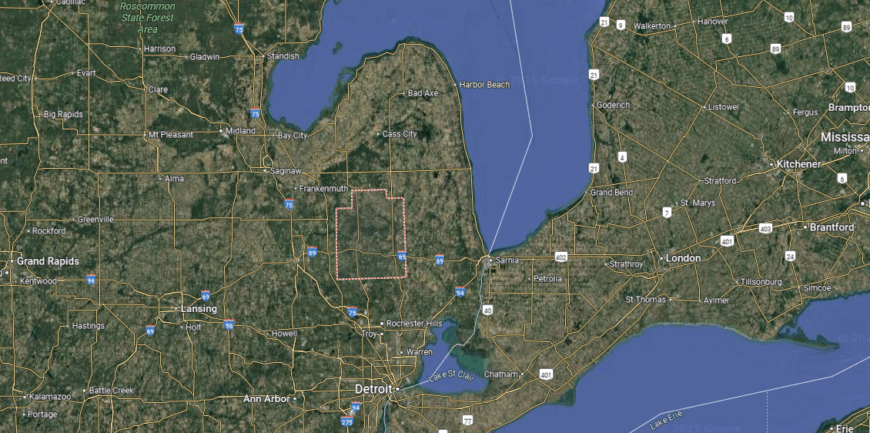
Where is Sanilac County?
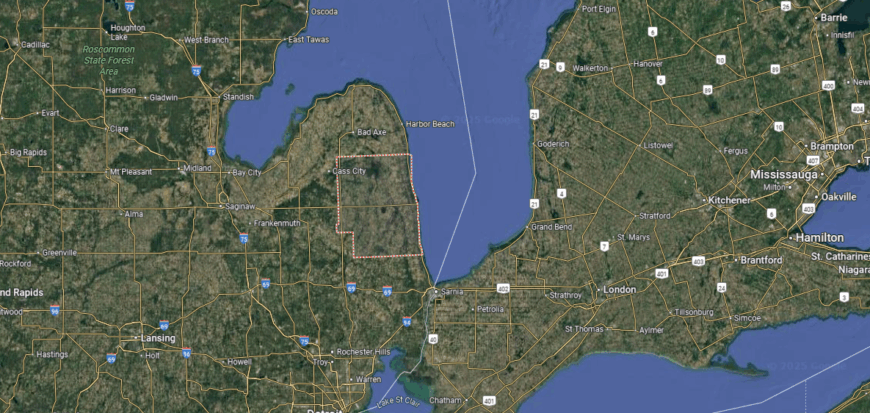
Sanilac County is located in Michigan’s Thumb region along the eastern shoreline of the Lower Peninsula. It covers just under 1,600 square miles when land and water are included, with about 960 square miles of farmland, forests, and small towns inland, and more than 40 miles of Lake Huron shoreline. Its position along the lakefront makes it both an agricultural and a recreational county.
Sandusky, the county seat, anchors government and local services near the center of the county. On the Lake Huron coast, Lexington and Port Sanilac serve as hubs for tourism and seasonal activity, while smaller communities such as Croswell, Marlette, and Peck connect the rural interior. With its farmland, lakefront, and small-town centers, Sanilac County reflects the agricultural and coastal character of Michigan’s Thumb.
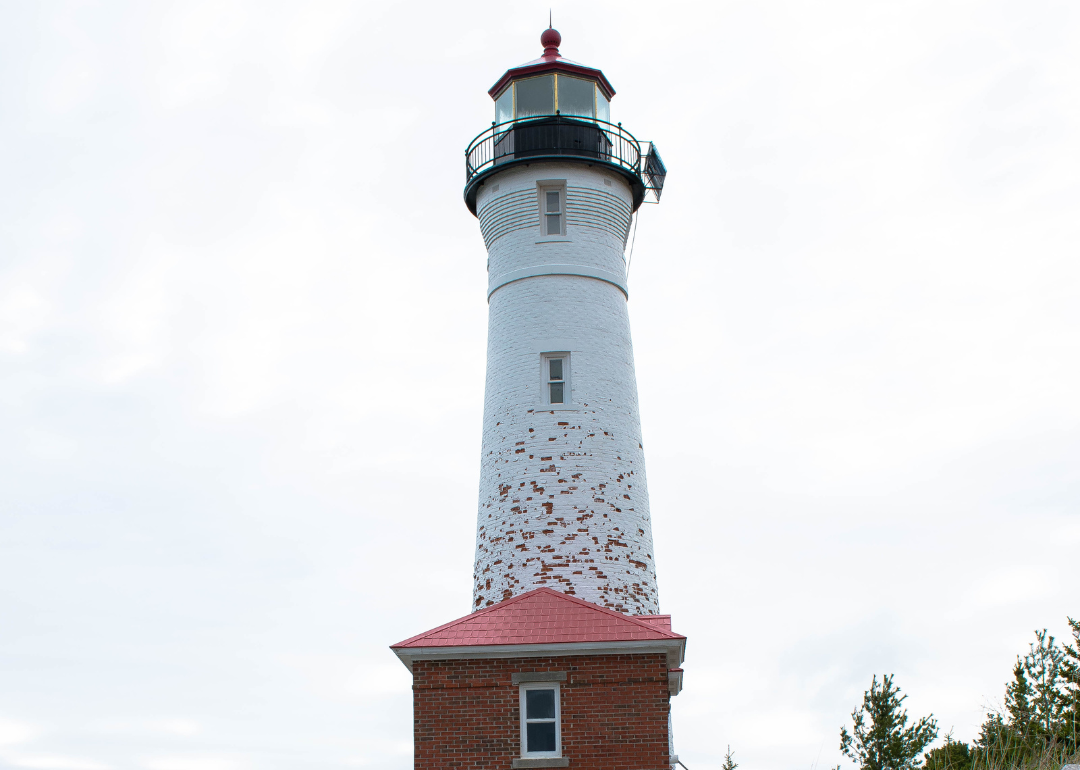
#27. Cheboygan County
– Life expectancy: 75.8 years
— 0.8 years lower than the state average

About
Cheboygan County’s story is rooted in its lumbering and shipping past, when Lake Huron and inland waterways drove settlement and trade. Cheboygan, the county seat, grew as a center for schools, commerce, and civic life, reflecting the region’s ties to both industry and community traditions. The county’s identity blends its working heritage with the character of small-town northern Michigan.
Forests, rivers, and the Great Lakes shoreline frame the county’s landscape, offering both livelihood and recreation. Festivals, outdoor traditions, and strong family ties keep cultural life vibrant across generations. Cheboygan County remains a place where history, land, and community remain closely connected.
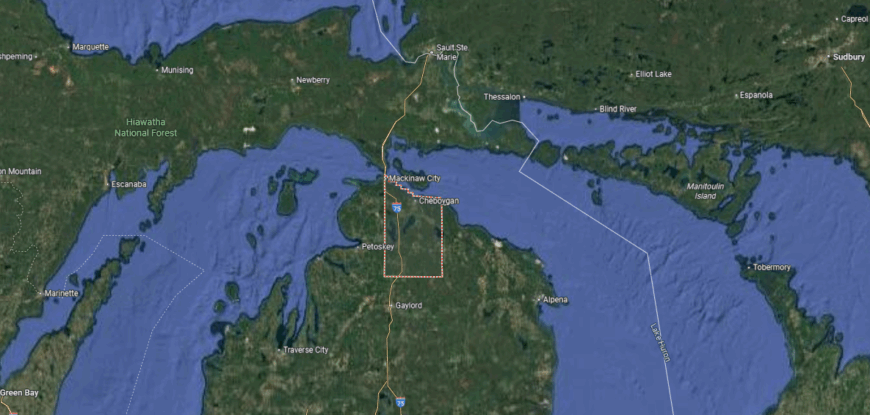
Where is Cheboygan County?
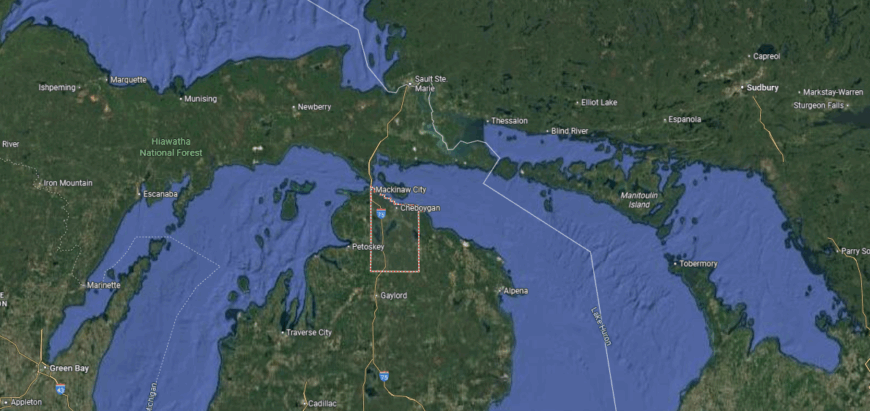
Cheboygan County is located in the northern tip of Michigan’s Lower Peninsula, bordered by Lake Huron to the northeast. It spans more than 1,200 square miles of forestland, farmland, and waterways, including portions of the Inland Waterway that link area lakes and rivers to the Great Lakes. The county lies about 15 miles south of the Mackinac Bridge, giving it a central position in the Straits region.
Cheboygan, the county seat, sits along Lake Huron and serves as the hub for government, business, and local culture. Smaller communities such as Indian River, Mackinaw City (partly in the county), and Wolverine connect the surrounding rural areas. With its lakefront, rivers, and proximity to the Straits, Cheboygan County reflects the natural and historic character of northern Michigan.
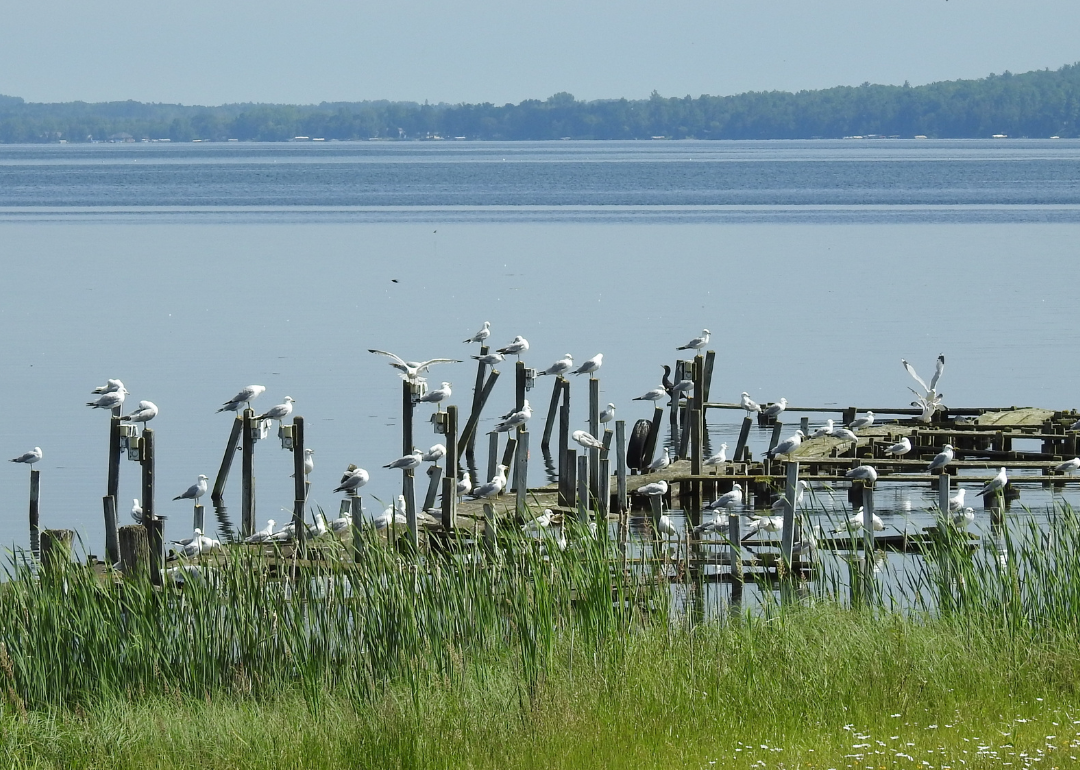
#26. Hillsdale County (tie)
– Life expectancy: 75.6 years
— 1.0 years lower than the state average
🔥 Would you like to save this?
About
Hillsdale County is defined by its community-centered traditions, where fairs, school events, and local gatherings reflect the character of southern Michigan. Hillsdale, the county seat, serves as a hub for education, commerce, and cultural life, anchored by the presence of Hillsdale College. The county’s identity blends small-town values with the energy of its academic and civic institutions.
Its history is tied to farming, milling, and early settlement, which shaped its growth and development over generations. Rolling farmland, lakes, and wooded stretches form the landscape, offering both livelihood and recreation. Hillsdale County continues to stand as a place where culture, history, and land remain strongly connected.
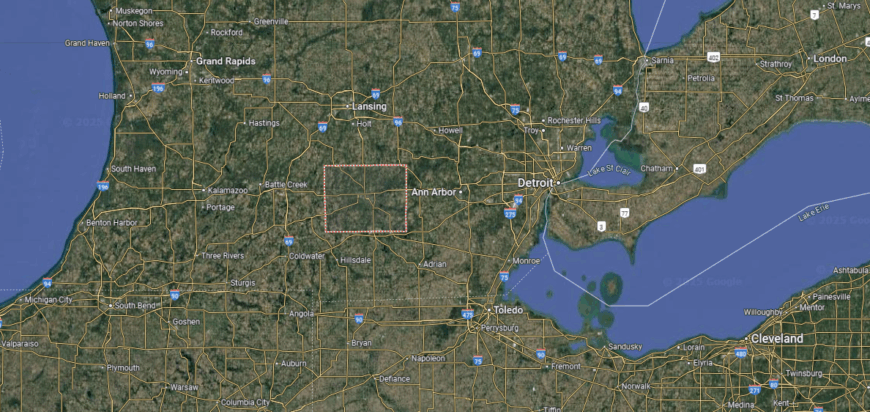
Where is Hillsdale County?
Hillsdale County is located in southern Michigan along the state’s border with Ohio and Indiana. It covers about 600 square miles of rolling farmland, wooded areas, and more than 40 inland lakes. The county lies roughly 90 miles southwest of Detroit and 70 miles southeast of Kalamazoo, giving it a central spot in the tri-state area.
Hillsdale, the county seat, sits near the center and serves as the hub for government, commerce, and education. Jonesville, Litchfield, and Reading are smaller communities that connect the surrounding rural landscape. With its farmland, lakes, and small towns, Hillsdale County reflects the rural character of southern Michigan.
#25. Luce County (tie)
– Life expectancy: 75.6 years
— 1.0 years lower than the state average
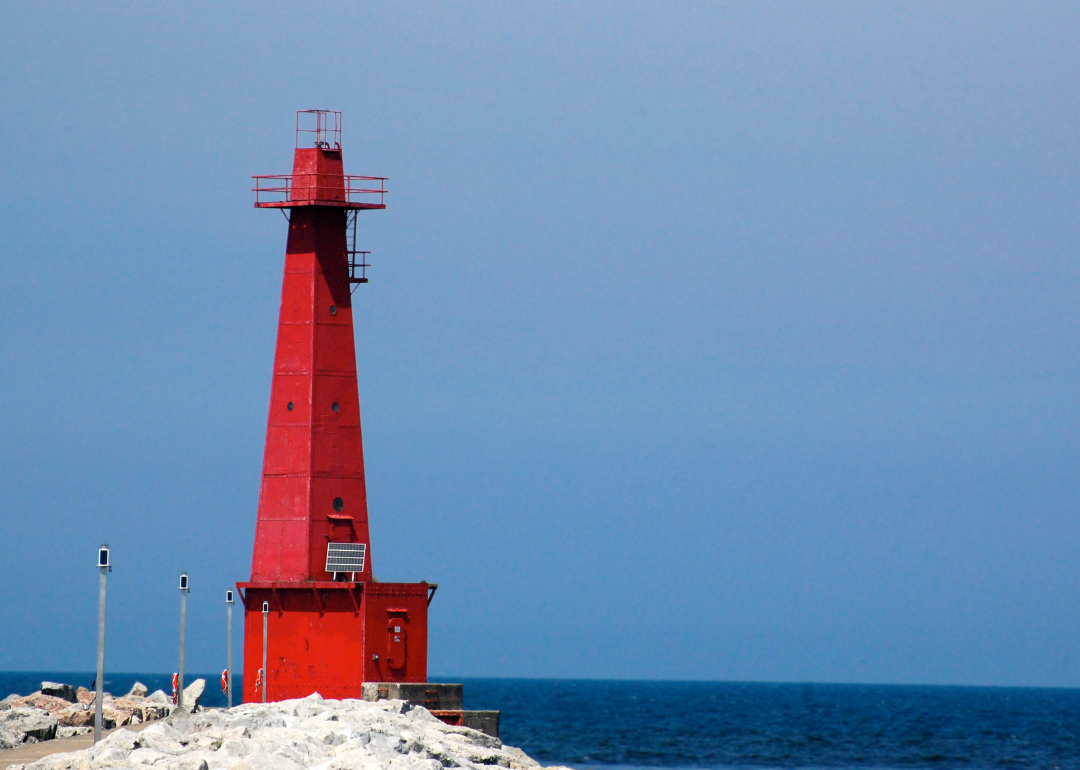
About
Luce County lies in the eastern Upper Peninsula, where forests, rivers, and the Lake Superior shoreline shape both its setting and daily life. Newberry, the county seat, anchors schools, commerce, and civic activity, serving as a central link for smaller rural communities. The county’s identity reflects both its rugged landscape and the traditions of northern Michigan living.
Its history is tied to logging, railroads, and the industries that once drove settlement in the region. Outdoor recreation, seasonal festivals, and close-knit family ties help sustain continuity across generations. Luce County remains a place where geography, history, and community are firmly interwoven.
Where is Luce County?
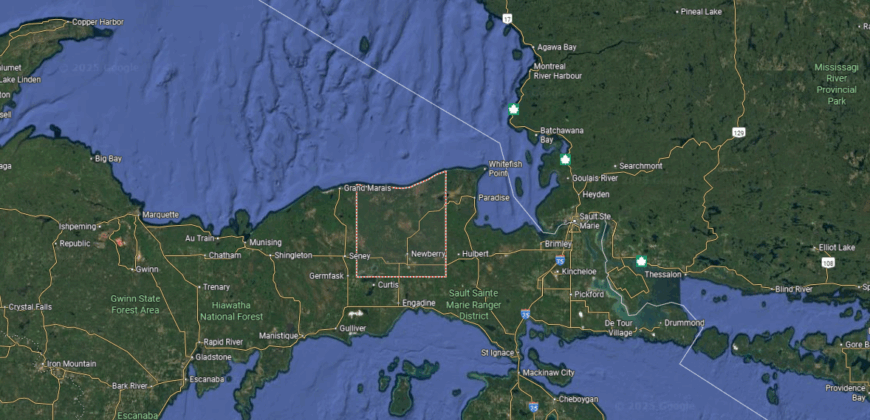
Luce County is located in the eastern Upper Peninsula of Michigan, bordered by Lake Superior to the north. It covers more than 900 square miles, much of it forestland, wetlands, and shoreline within the Hiawatha National Forest. The county lies about 65 miles northwest of Sault Ste. Marie and includes some of the most remote wilderness in the state.
Newberry, the county seat, is positioned near the center and serves as the hub for government and community services. Smaller settlements such as McMillan and Pentland connect the rural interior, while Muskallonge Lake State Park anchors the northern shoreline. With its vast forests, lakes, and access to Lake Superior, Luce County reflects the rugged natural character of Michigan’s Upper Peninsula.
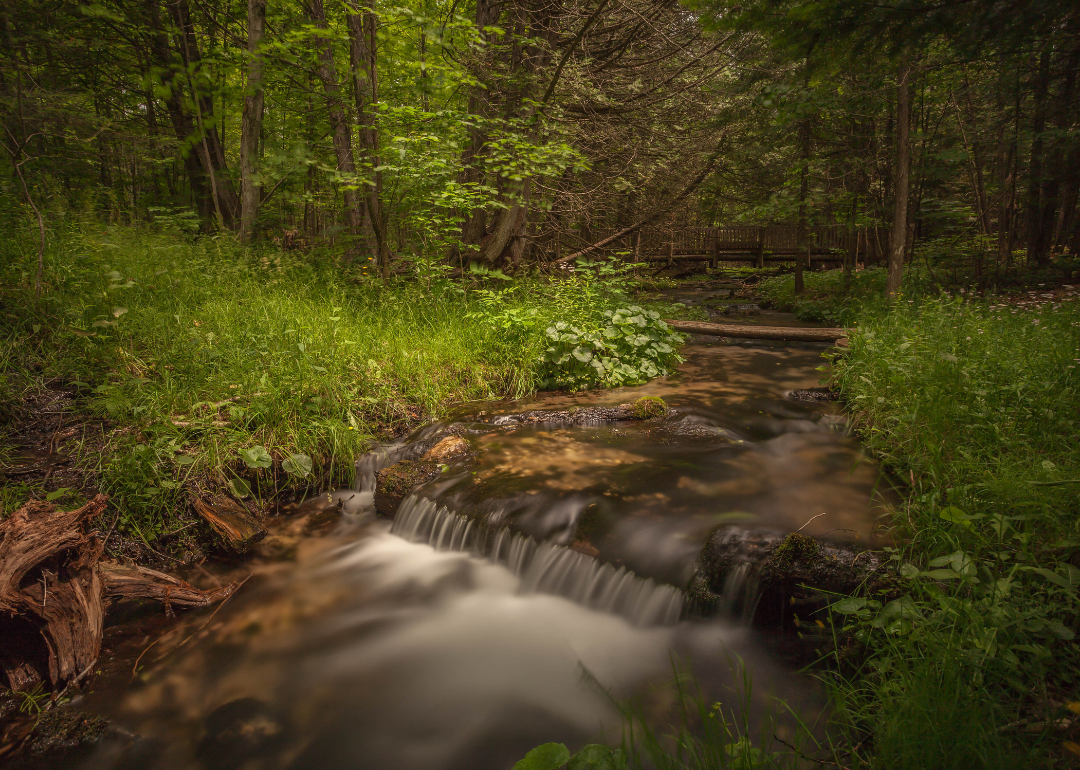
#24. Muskegon County (tie)
– Life expectancy: 75.6 years
— 1.0 years lower than the state average
About
Muskegon County’s story is rooted in the lumber era, when its deep harbor on Lake Michigan made it a hub for shipping and industry. Muskegon, the county seat, reflects this heritage in its historic districts, cultural institutions, and role as a regional center of commerce. The county’s identity blends its industrial past with the energy of a modern lakeshore community.
The shoreline of Lake Michigan, along with rivers, forests, and dunes, provides both livelihood and recreation for residents. Festivals, arts events, and strong neighborhood traditions keep community life vibrant across generations. Muskegon County remains a place where history, culture, and landscape remain firmly bound together.
Where is Muskegon County?
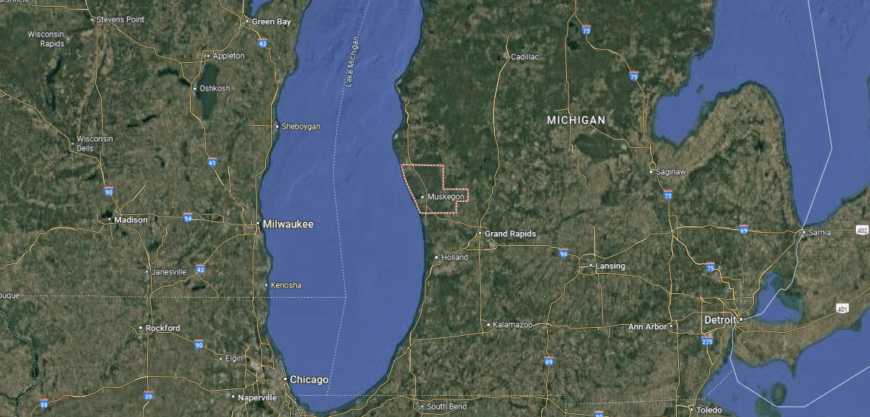
Muskegon County is located along the western shore of Michigan’s Lower Peninsula, bordered by Lake Michigan to the west. It spans about 1,460 square miles, with sandy shoreline, forestland, and the Muskegon River flowing through its center. The county lies roughly 40 miles northwest of Grand Rapids, placing it within the state’s lakeshore region.
Muskegon, the county seat and largest city, sits on Muskegon Lake, which connects directly to Lake Michigan. Other communities such as Norton Shores, Whitehall, and Montague anchor different parts of the county. With its lakefront, river valleys, and urban centers, Muskegon County blends natural resources with industry and recreation.
#23. Kalkaska County (tie)
– Life expectancy: 75.4 years
— 1.2 years lower than the state average
You may also like: Fastest-growing jobs in Michigan
About
Kalkaska County is marked by its strong sense of community, where fairs, festivals, and school events highlight the rhythms of northern Michigan life. Kalkaska, the county seat, serves as a hub for schools, commerce, and civic life, while outdoor traditions tie together smaller communities across the region. The county’s identity reflects both its small-town character and its connection to the natural world.
Its history is tied to logging and farming, industries that supported early settlement and shaped its growth. Forests, rivers, and lakes frame the landscape, providing both recreation and a steady link to the land. Kalkaska County continues to stand as a place where culture, history, and geography remain closely bound.
Where is Kalkaska County?
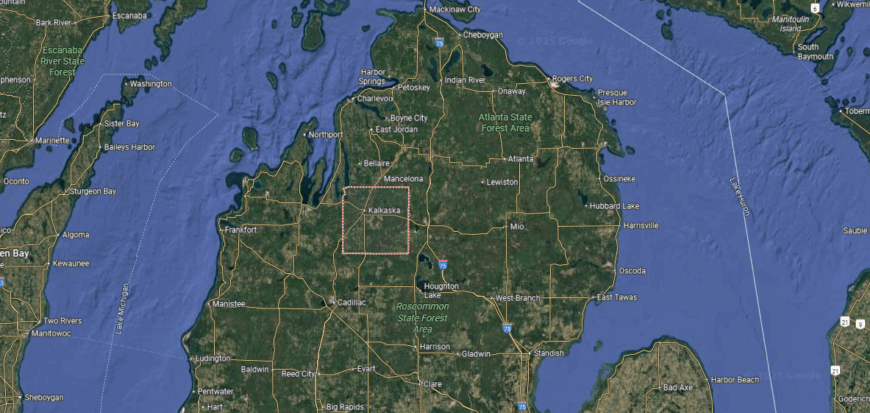
Kalkaska County is located in the northwestern Lower Peninsula of Michigan, about 25 miles east of Traverse City. It covers more than 570 square miles of forestland, farmland, and over 80 inland lakes, with the Boardman and Rapid Rivers flowing through its landscape. The county lies within a region known for outdoor recreation and natural beauty.
Kalkaska, the county seat, is positioned near the center and serves as the hub for government and local services. Smaller communities such as Rapid City, South Boardman, and Fife Lake connect the rural countryside. With its wooded terrain, rivers, and lakes, Kalkaska County reflects the natural character of northern Michigan.
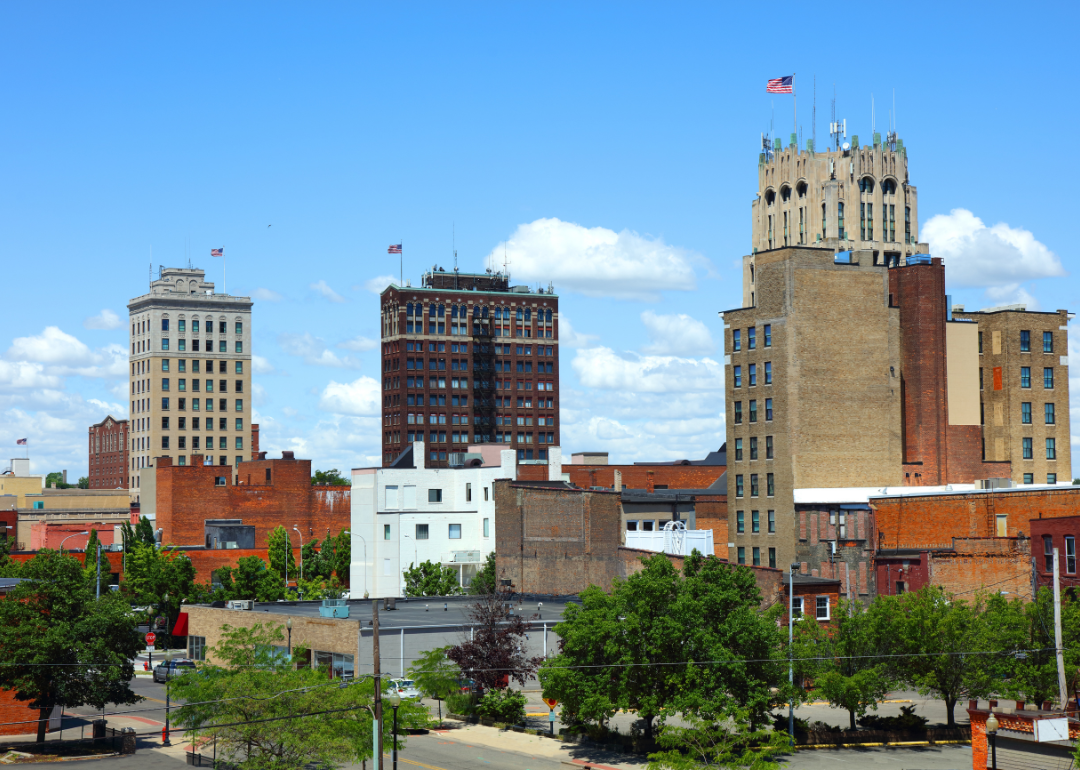
#22. Jackson County (tie)
– Life expectancy: 75.4 years
— 1.2 years lower than the state average
About
Jackson County lies in south-central Michigan, where rolling farmland, woodlands, and lakes form a varied landscape. Jackson, the county seat, anchors schools, commerce, and cultural life, serving as both a regional hub and a community with deep historical roots. The county’s identity reflects the balance of natural setting, civic tradition, and local pride.
Its history includes farming, manufacturing, and the rise of transportation routes that shaped growth over time. Festivals, arts events, and neighborhood traditions help keep cultural life strong across generations. Jackson County remains a place where geography, history, and community remain firmly connected.
Where is Jackson County?
Jackson County is located in south-central Michigan, about 40 miles west of Ann Arbor and 35 miles south of Lansing. It covers just over 700 square miles of rolling farmland, forested areas, and more than 100 inland lakes. The Grand River begins in the county, adding to its natural features and waterways.
Jackson, the county seat and largest city, sits near the center and serves as the hub for government, commerce, and culture. Smaller communities such as Grass Lake, Spring Arbor, and Brooklyn connect the surrounding rural areas. With its lakes, farmland, and historic towns, Jackson County reflects the blend of natural and cultural heritage in southern Michigan.
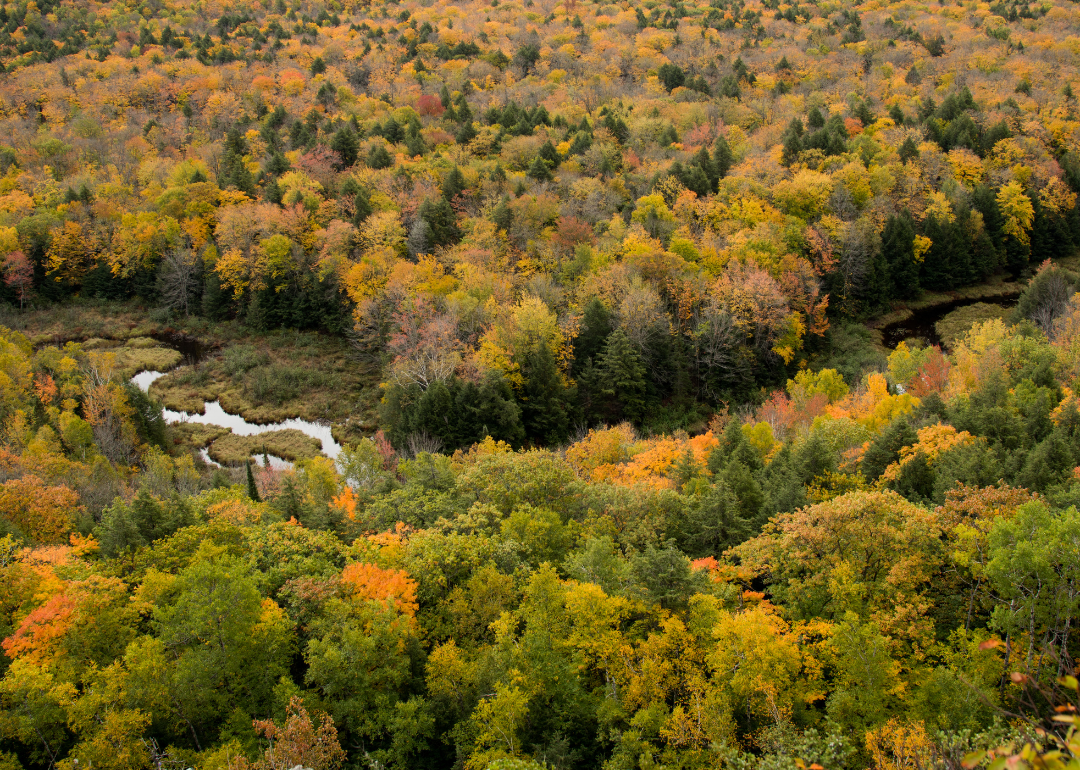
#21. Alcona County (tie)
– Life expectancy: 75.4 years
— 1.2 years lower than the state average
About
Alcona County’s story is rooted in the lumber trade, when dense forests and Lake Huron shipping routes drove settlement in the 19th century. Harrisville, the county seat, reflects this past through its historic character while serving as a hub for schools, commerce, and civic life. The county’s identity blends its industrial heritage with the traditions of rural northern Michigan.
Lake Huron’s shoreline, along with forests and inland lakes, shapes both livelihood and recreation for residents. Seasonal festivals, outdoor traditions, and close-knit family ties keep community spirit strong across generations. Alcona County stands as a place where history, land, and community remain firmly connected.
Where is Alcona County?
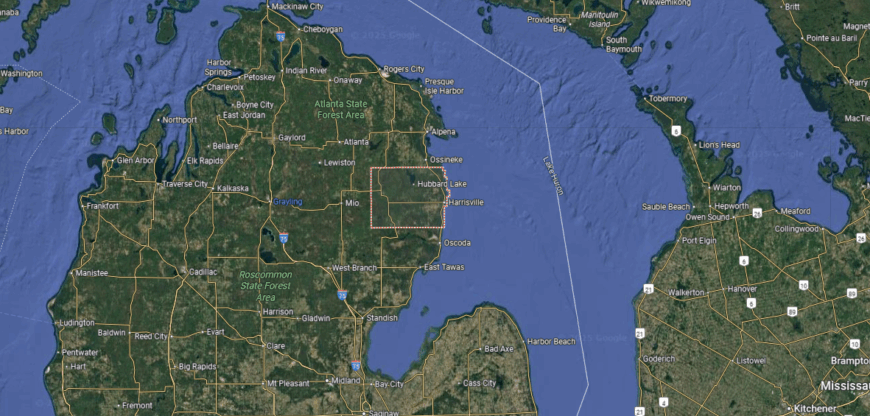
Alcona County is located in the northeastern part of Michigan’s Lower Peninsula, bordered by Lake Huron to the east. It spans more than 670 square miles of forestland, farmland, and lakes, much of it within the Huron National Forest. The county lies about 80 miles north of Bay City, with U.S. Highway 23 running along its shoreline.
Harrisville, the county seat, sits on Lake Huron and serves as the hub for government and community life. Smaller towns such as Lincoln, Mikado, and Curran connect the inland areas. With its lakefront, forests, and rural communities, Alcona County reflects the natural and recreational character of northern Michigan.
#20. Ontonagon County (tie)
– Life expectancy: 75.4 years
— 1.2 years lower than the state average
About
Ontonagon County is defined by its close-knit communities, where local festivals, church gatherings, and school events carry forward the traditions of Michigan’s western Upper Peninsula. Ontonagon, the county seat, anchors schools, commerce, and civic life, serving as a link for rural towns spread across a wide landscape. The county’s identity blends small-town spirit with the enduring culture of the northwoods.
Its history is tied to copper mining, logging, and shipping along Lake Superior, industries that left a lasting mark on its development. Today, forests, rivers, and the vast shoreline provide both recreation and a strong connection to the land. Ontonagon County continues to stand as a place where culture, history, and geography remain deeply bound together.
Where is Ontonagon County?
Ontonagon County is located in the western Upper Peninsula of Michigan along the southern shore of Lake Superior. It spans more than 1,300 square miles, making it one of the state’s largest counties by area, with terrain that includes dense forests, rivers, and parts of the Porcupine Mountains. The county lies about 90 miles west of Marquette and is known for its remote wilderness and shoreline.
Ontonagon, the county seat, sits at the mouth of the Ontonagon River on Lake Superior and serves as the hub for government and community life. Smaller towns and settlements such as White Pine, Bergland, and Greenland are spread throughout the forested interior. With its lakefront, mountains, and rugged landscapes, Ontonagon County reflects the wild and natural character of Michigan’s Upper Peninsula.
#19. Wexford County (tie)
– Life expectancy: 75.4 years
— 1.2 years lower than the state average
About
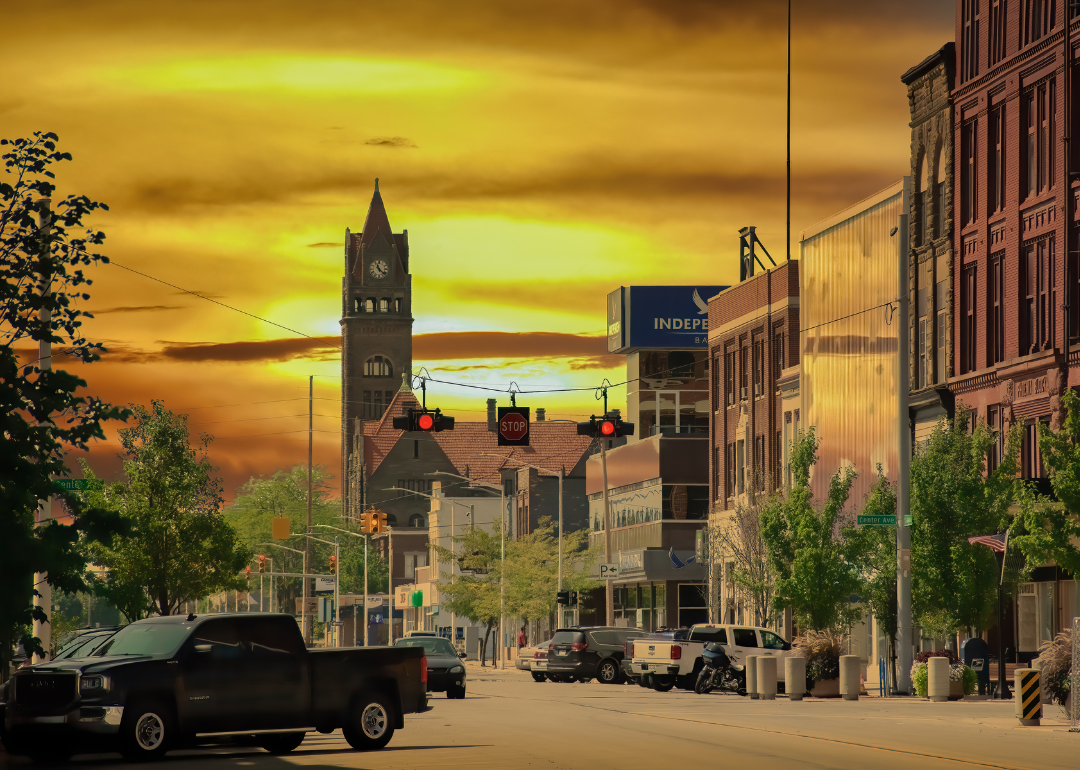
Wexford County lies in northern Michigan, where forests, rivers, and rolling hills frame both work and recreation. Cadillac, the county seat, anchors schools, commerce, and cultural life, serving as the hub for smaller communities across the region. The county’s identity reflects its natural setting alongside the traditions of small-town Michigan.
Its history is tied to the lumber industry, which spurred early settlement and shaped its growth. Festivals, outdoor events, and strong family ties keep community spirit alive across generations. Wexford County endures as a place where geography, history, and culture remain firmly connected.
Where is Wexford County?
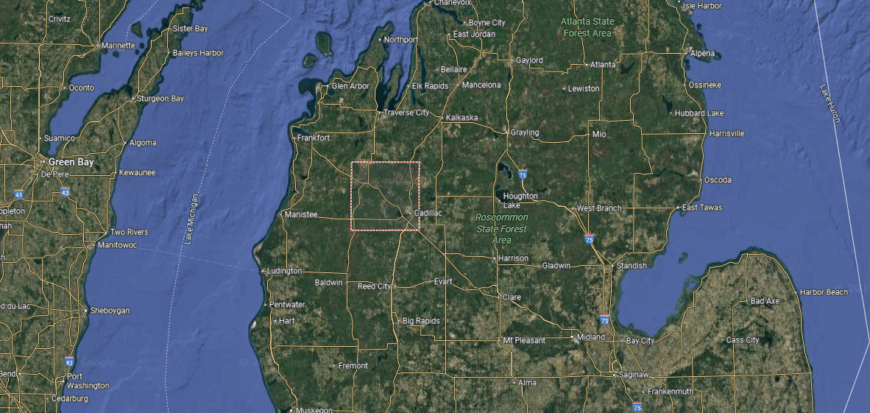
Wexford County is located in the northwestern part of Michigan’s Lower Peninsula, about 50 miles southeast of Traverse City. It covers more than 560 square miles of forestland, farmland, and river valleys, with parts of the Manistee National Forest extending into its borders. The county lies within a region known for its rolling hills and outdoor recreation.
Cadillac, the county seat and largest city, is positioned near the center and anchors government, business, and culture. Smaller communities such as Manton, Mesick, and Harrietta connect the surrounding countryside. With its forests, lakes, and small towns, Wexford County reflects the natural and rural character of northern Michigan.
#18. Bay County (tie)
– Life expectancy: 75.3 years
— 1.3 years lower than the state average
You may also like: Counties with the most homes selling under list price in Michigan
About
Bay County’s story is tied to its location along Saginaw Bay, where shipping, lumbering, and industry fueled its early growth. Bay City, the county seat, reflects this heritage through its waterfront, historic districts, and role as a cultural and economic hub. The county’s identity blends its industrial past with the traditions of a lakeshore community.
The shoreline of Lake Huron, along with rivers and wetlands, provides both recreation and natural beauty for residents. Festivals, arts events, and neighborhood traditions help sustain community life across generations. Bay County continues to stand as a place where history, land, and culture remain firmly connected.
Where is Bay County?
Bay County is located in east-central Michigan along the shoreline of Saginaw Bay on Lake Huron. It spans about 450 square miles of farmland, wetlands, and river valleys, with the Saginaw River running through the county into the bay. The county lies roughly 120 miles northwest of Detroit and 70 miles north of Lansing.
Bay City, the county seat, sits at the mouth of the Saginaw River and serves as the hub for government, commerce, and culture. Smaller communities such as Essexville, Pinconning, and Auburn connect the surrounding rural and suburban areas. With its lakefront, river access, and agricultural base, Bay County reflects the mix of natural and economic resources of east-central Michigan.
#17. Tuscola County (tie)
– Life expectancy: 75.3 years
— 1.3 years lower than the state average
About
Tuscola County is defined by its community spirit, where school events, county fairs, and local gatherings highlight the traditions of Michigan’s Thumb region. Caro, the county seat, serves as a hub for education, commerce, and civic life, tying together smaller farming towns across the area. The county’s identity reflects both small-town values and a strong agricultural base.
Its history is tied to farming, milling, and trade, which guided settlement and growth through generations. Rolling fields, woodlands, and rivers shape the landscape, supporting both livelihood and recreation. Tuscola County remains a place where culture, history, and land continue to work hand in hand.
Where is Tuscola County?
Tuscola County is located in Michigan’s Thumb region, about 90 miles north of Detroit and 30 miles east of Saginaw. It spans more than 900 square miles of fertile farmland, rolling hills, and small towns, with the Cass River running through its center. The county’s position places it between the Saginaw Bay shoreline and the interior of the Thumb.
Caro, the county seat, lies near the middle and serves as the hub for government and local commerce. Smaller communities such as Vassar, Cass City, and Millington connect the surrounding countryside. With its strong agricultural base, river valleys, and rural towns, Tuscola County reflects the character of Michigan’s Thumb.
#16. Saginaw County (tie)
– Life expectancy: 75.3 years
— 1.3 years lower than the state average
About
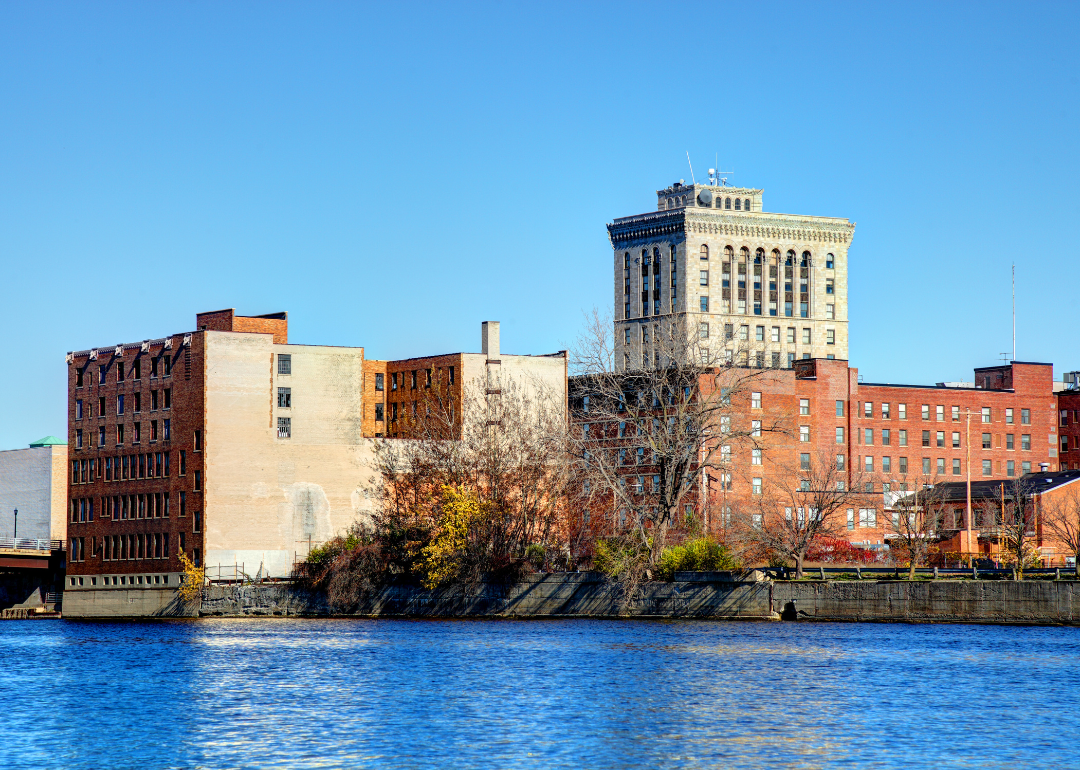
Saginaw County lies in central Michigan, where rivers, farmland, and urban centers create a diverse landscape. Saginaw, the county seat, serves as a hub for schools, commerce, and culture, linking surrounding rural towns with the energy of a metropolitan area. The county’s identity reflects both its natural setting and its role as a regional center.
Its history is tied to Native American heritage, the lumber trade, and later industrial growth, each leaving a strong imprint on its development. Festivals, arts, and neighborhood traditions continue to keep community ties strong across generations. Saginaw County remains a place where geography, history, and culture are closely connected.
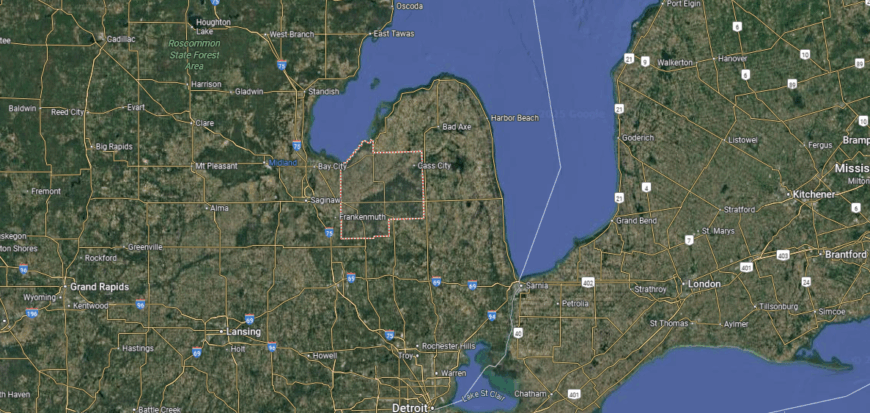
Where is Saginaw County?
Saginaw County is located in east-central Michigan, about 95 miles northwest of Detroit and 65 miles north of Lansing. It spans nearly 820 square miles of farmland, river valleys, and urban centers, with the Saginaw River running northward through the county into Saginaw Bay. Its location places it at the heart of the Great Lakes Bay Region.
Saginaw, the county seat, sits along the river and serves as the hub for government, commerce, and culture. Other communities such as Birch Run, Frankenmuth, and Chesaning add to the county’s economic and cultural identity. With its mix of agriculture, industry, and historic towns, Saginaw County reflects both the rural and urban character of mid-Michigan.
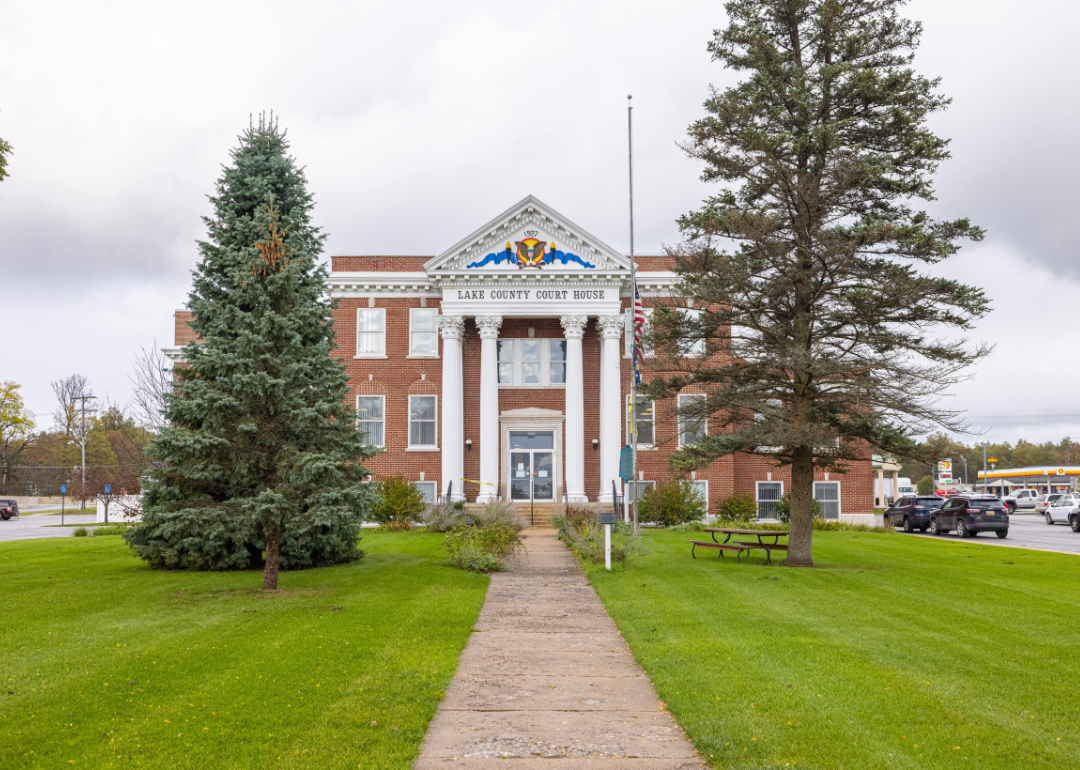
#15. Lake County (tie)
– Life expectancy: 75.2 years
— 1.4 years lower than the state average
About
Lake County’s story is tied to the lumbering era, when dense forests and sawmills drove settlement in Michigan’s Lower Peninsula. Baldwin, the county seat, grew as a small hub for commerce, schools, and civic life, reflecting both the county’s frontier heritage and its enduring rural traditions. The county’s identity blends this history with the steady pace of northern Michigan living.
Forests, rivers, and lakes dominate the landscape, providing space for recreation, livelihood, and community gatherings. Seasonal festivals, outdoor traditions, and generational family ties keep cultural life strong across the region. Lake County continues to stand as a place where history, land, and community remain firmly interwoven.
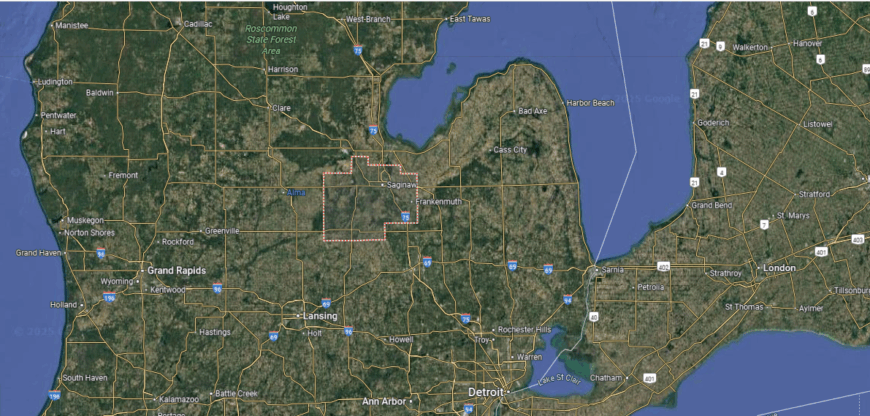
Where is Lake County?
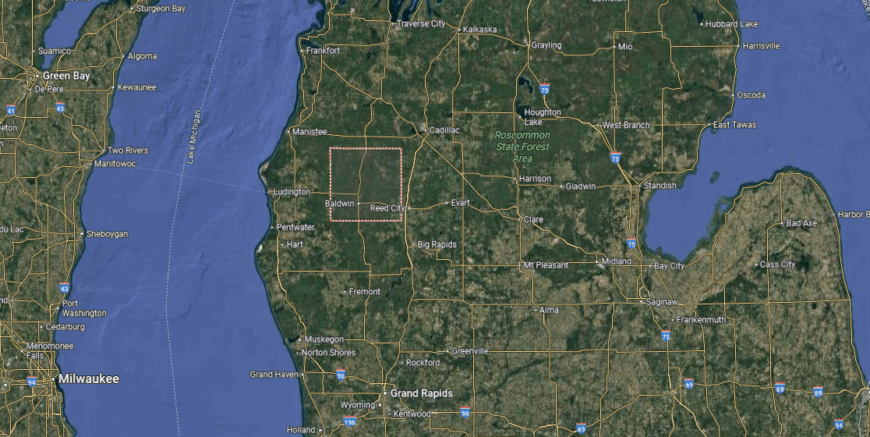
Lake County is located in the west-central part of Michigan’s Lower Peninsula, about 65 miles north of Grand Rapids. It covers more than 570 square miles, much of it forestland, lakes, and rivers within the Manistee National Forest. The Pere Marquette and Pine Rivers flow through the county, shaping its natural landscape and recreation opportunities.
Baldwin, the county seat, sits near the center and serves as the hub for government and community life. Smaller communities such as Luther, Chase, and Idlewild are scattered across the wooded countryside. With its forests, rivers, and inland lakes, Lake County reflects the outdoor character of northern Michigan.
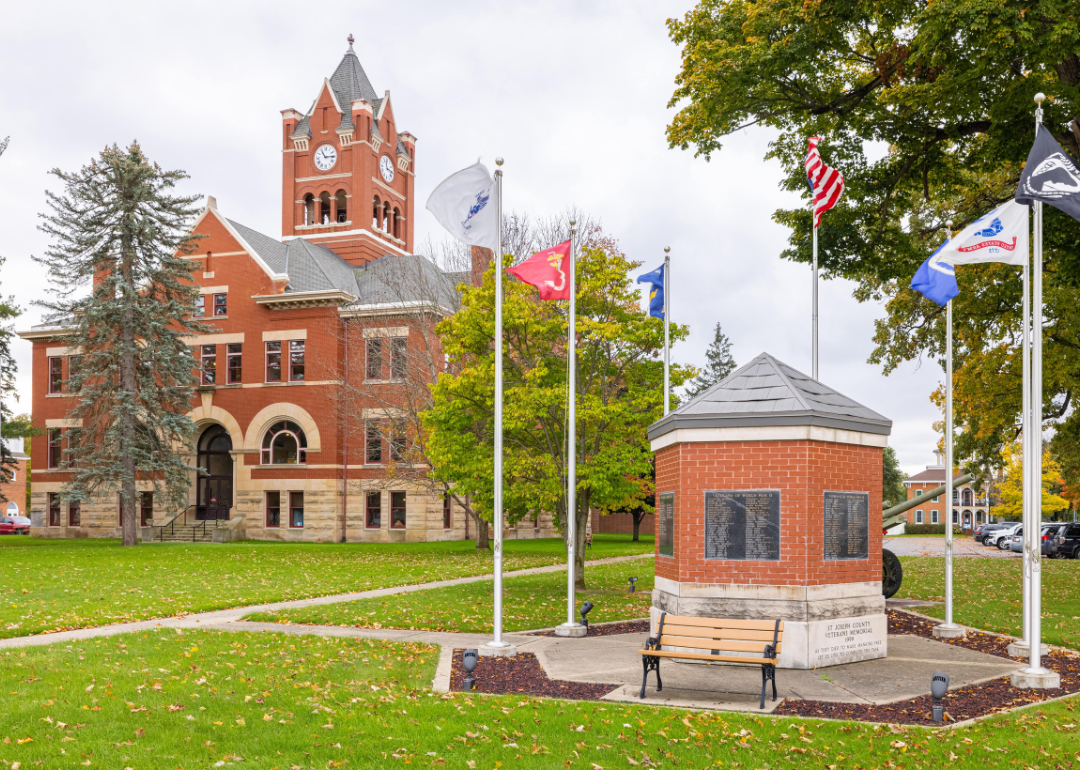
#14. St. Joseph County (tie)
– Life expectancy: 75.2 years
— 1.4 years lower than the state average

About
St. Joseph County is marked by its strong community ties, where county fairs, school events, and church gatherings highlight the rhythms of southern Michigan life. Centreville, the county seat, anchors schools, commerce, and civic activity, while nearby towns and villages sustain local traditions. The county’s identity reflects both small-town pride and the close connections of rural living.
Its history is tied to farming, milling, and trade, industries that guided settlement and growth along rivers and fertile land. Lakes, streams, and rolling farmland continue to provide both livelihood and recreation for families. St. Joseph County remains a place where culture, history, and geography remain closely connected.
Where is St. Joseph County?
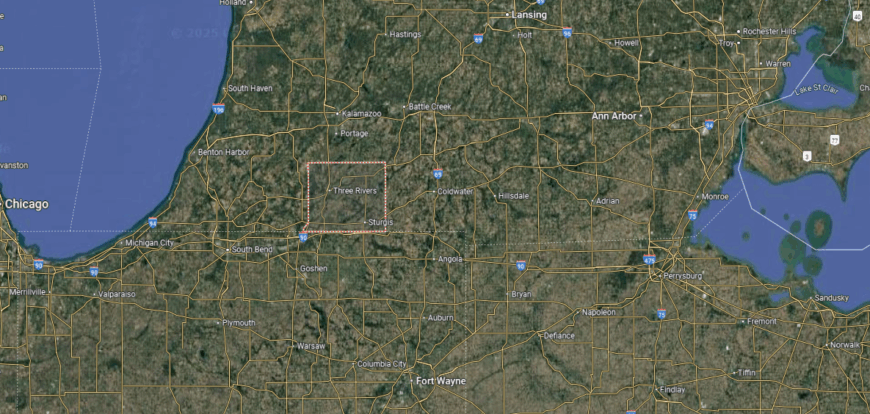
St. Joseph County is located in the southwestern corner of Michigan along the Indiana border. It spans about 520 square miles of farmland, small lakes, and river valleys, with the St. Joseph River running diagonally across the county. The area lies roughly 30 miles south of Kalamazoo and 70 miles west of Ann Arbor, giving it strong regional connections.
Centreville, the county seat, is positioned near the middle and serves as the hub for government and community life. Sturgis, Three Rivers, and Constantine are other key towns that anchor commerce and culture across the county. With its river system, farmland, and border location, St. Joseph County blends rural character with cross-state ties.
#13. Arenac County (tie)
– Life expectancy: 75.2 years
— 1.4 years lower than the state average
You may also like: How compensation compares between Michigan staff and travel nurses
About
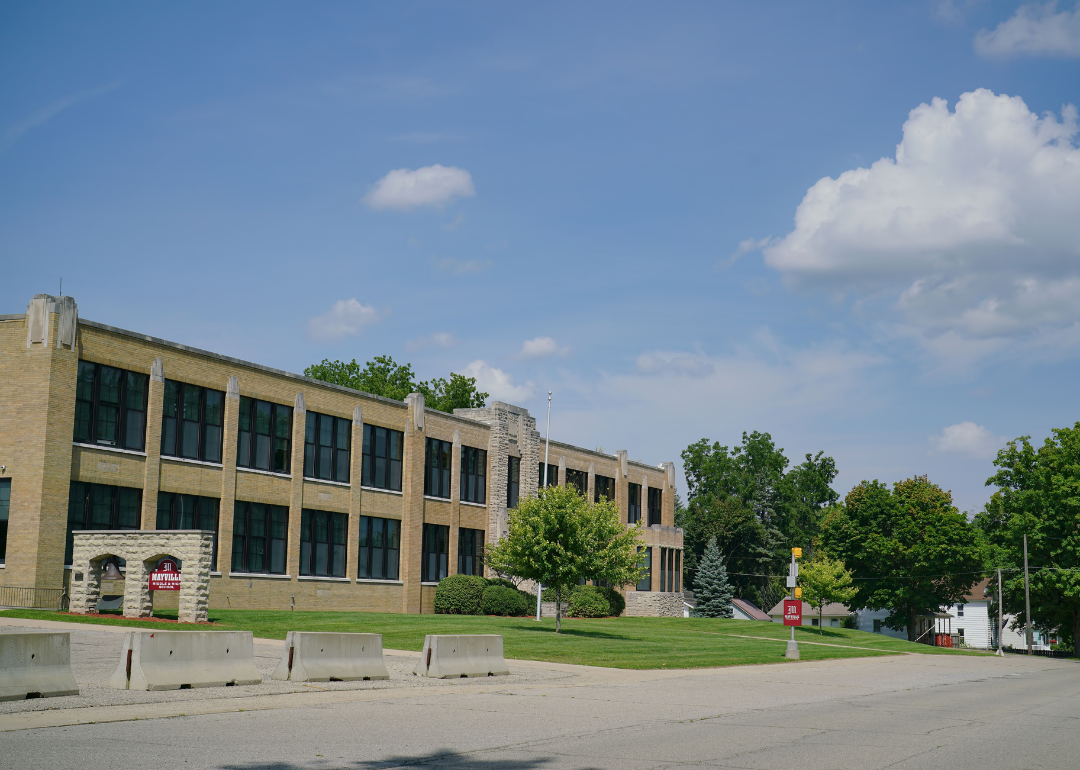
Arenac County lies along the shores of Saginaw Bay, where rivers, farmland, and wetlands shape its landscape. Standish, the county seat, anchors schools, commerce, and civic life, serving as a hub for the county’s rural communities. The county’s identity reflects both its lakeshore setting and its agricultural traditions.
Its history is tied to farming, logging, and shipping, industries that guided settlement and growth along the bay. Festivals, outdoor recreation, and strong family traditions continue to sustain community pride across generations. Arenac County remains a place where geography, history, and culture remain firmly connected.
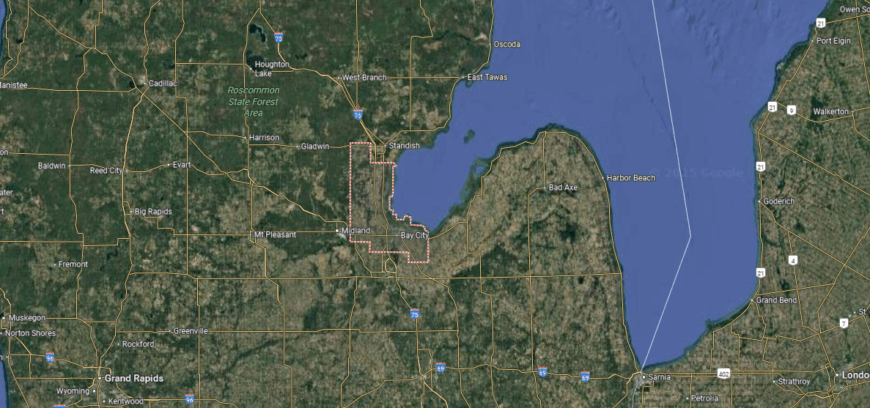
Where is Arenac County?
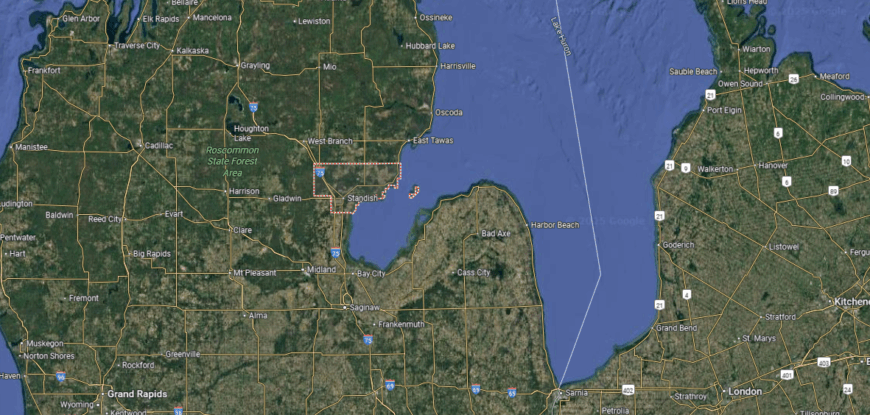
Arenac County is located in east-central Michigan along the shoreline of Saginaw Bay on Lake Huron. It spans about 370 square miles, with a landscape of flat farmland, forested areas, and coastal wetlands. The county lies about 30 miles north of Bay City and marks the southern gateway to Michigan’s northern Lower Peninsula.
Standish, the county seat, is situated near the center and serves as the hub for government and local services. Smaller communities such as Au Gres, Omer, and Turner connect the inland areas to the lakefront. With its farmland, shoreline, and small towns, Arenac County reflects the transition between mid-Michigan and the state’s northern lake region.
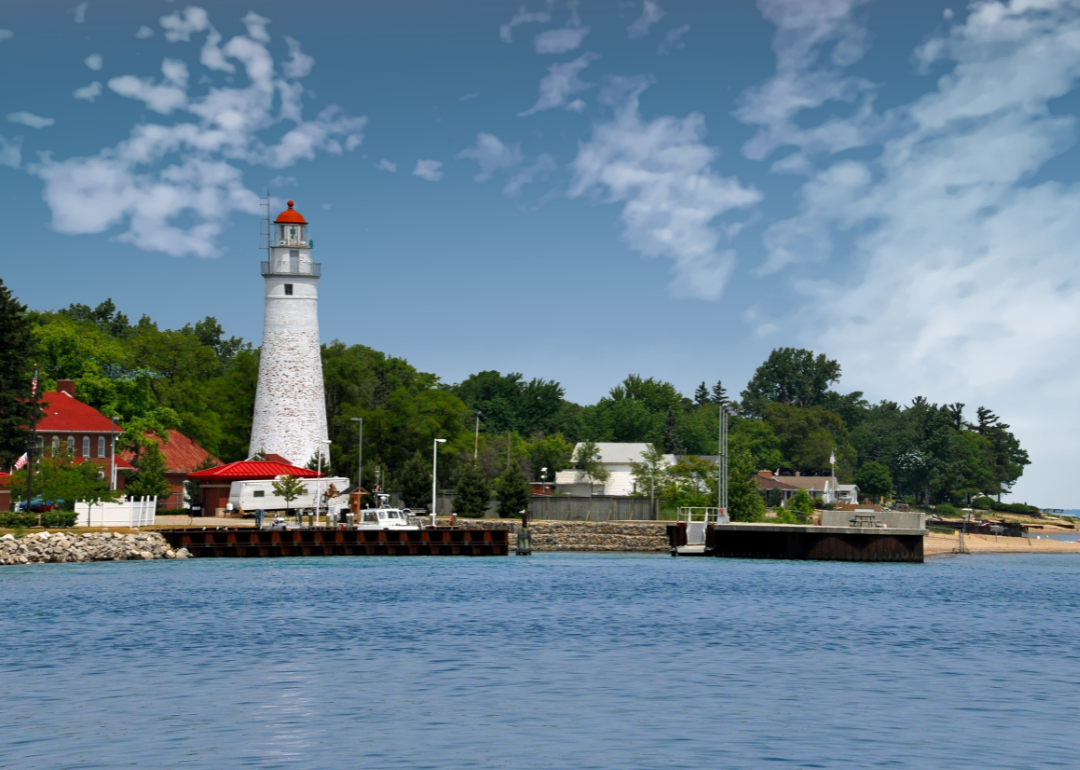
#12. St. Clair County
– Life expectancy: 75.1 years
— 1.5 years lower than the state average
About
St. Clair County’s story is tied to its position along the St. Clair River, where shipping, trade, and early industry shaped settlement and growth. Port Huron, the county seat, reflects this heritage through its waterfront, historic districts, and role as a cultural and economic hub. The county’s identity blends its industrial past with the traditions of a lakeshore community.
The river and Lake Huron shoreline define both livelihood and recreation, offering space for shipping, fishing, and leisure. Festivals, maritime traditions, and strong community ties keep cultural life vibrant across generations. St. Clair County remains a place where history, water, and community remain deeply connected.
Where is St. Clair County?
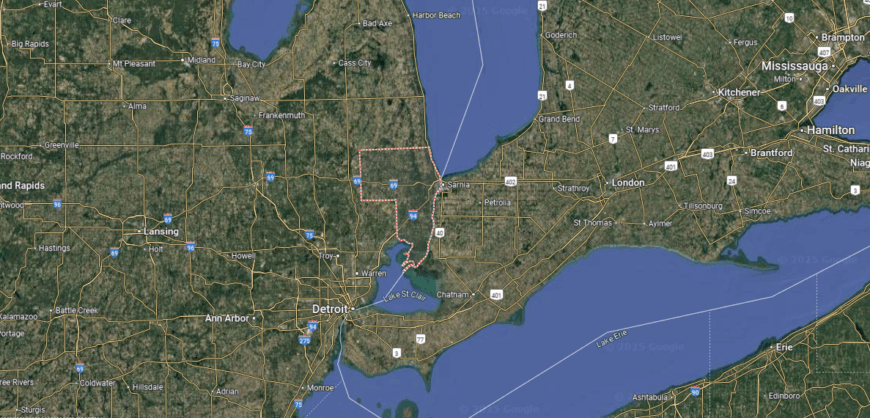
St. Clair County is located in southeastern Michigan along the western shore of the St. Clair River, which forms the border with Ontario, Canada. It covers about 725 square miles of farmland, river valleys, and Lake Huron shoreline. The county lies roughly 55 miles northeast of Detroit, making it part of the greater metropolitan region while maintaining its own lakefront identity.
Port Huron, the county seat, sits at the southern end of Lake Huron where it flows into the St. Clair River and serves as the hub for government, commerce, and international crossings. Smaller communities such as Marysville, Marine City, and Yale connect the rural interior and riverfront areas. With its mix of farmland, lake and river access, and cross-border ties, St. Clair County reflects both the natural and economic character of Michigan’s eastern shoreline.
#11. Iron County
– Life expectancy: 74.6 years
— 2.0 years lower than the state average
About
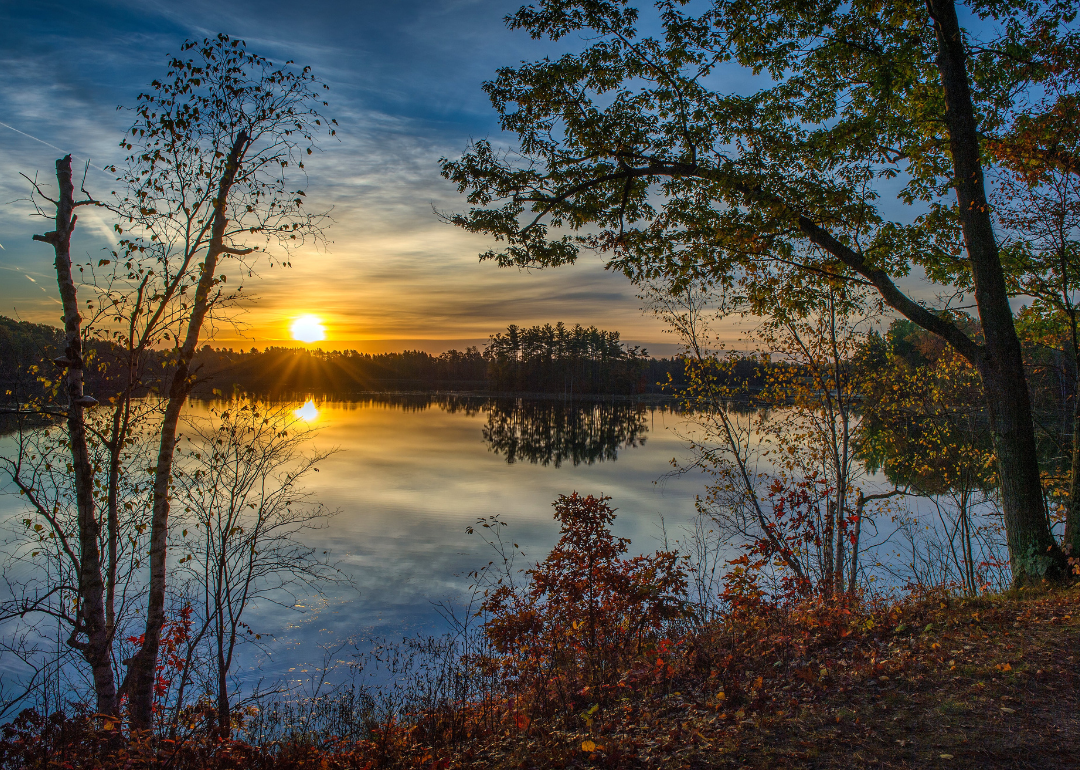
Iron County is defined by its close-knit communities, where fairs, festivals, and school events highlight the heritage of Michigan’s western Upper Peninsula. Crystal Falls, the county seat, and Iron River both serve as centers for education, commerce, and civic life, tying smaller towns together through shared traditions. The county’s identity reflects both small-town values and the enduring character of the northwoods.
Its history is tied to iron mining and logging, industries that brought growth and shaped its settlement. Forests, rivers, and lakes now provide recreation and continuity, grounding families in the land across generations. Iron County remains a place where culture, history, and geography remain firmly connected.
Where is Iron County?
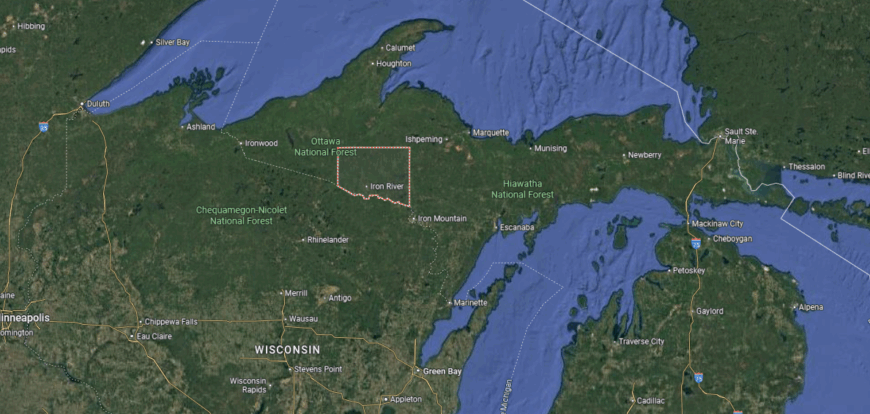
Iron County is located in the western Upper Peninsula of Michigan along the Wisconsin border. It spans more than 1,200 square miles of forestland, lakes, and rivers, much of it within the Ottawa National Forest. The county lies about 50 miles west of Iron Mountain and is known for its rugged terrain and outdoor recreation.
Crystal Falls, the county seat, sits near the center and serves as the hub for government and community life. Iron River, the largest city, anchors the western part of the county with commerce and cultural activity. With its forests, waterways, and cross-border ties, Iron County reflects the natural and rural character of Michigan’s western U.P.
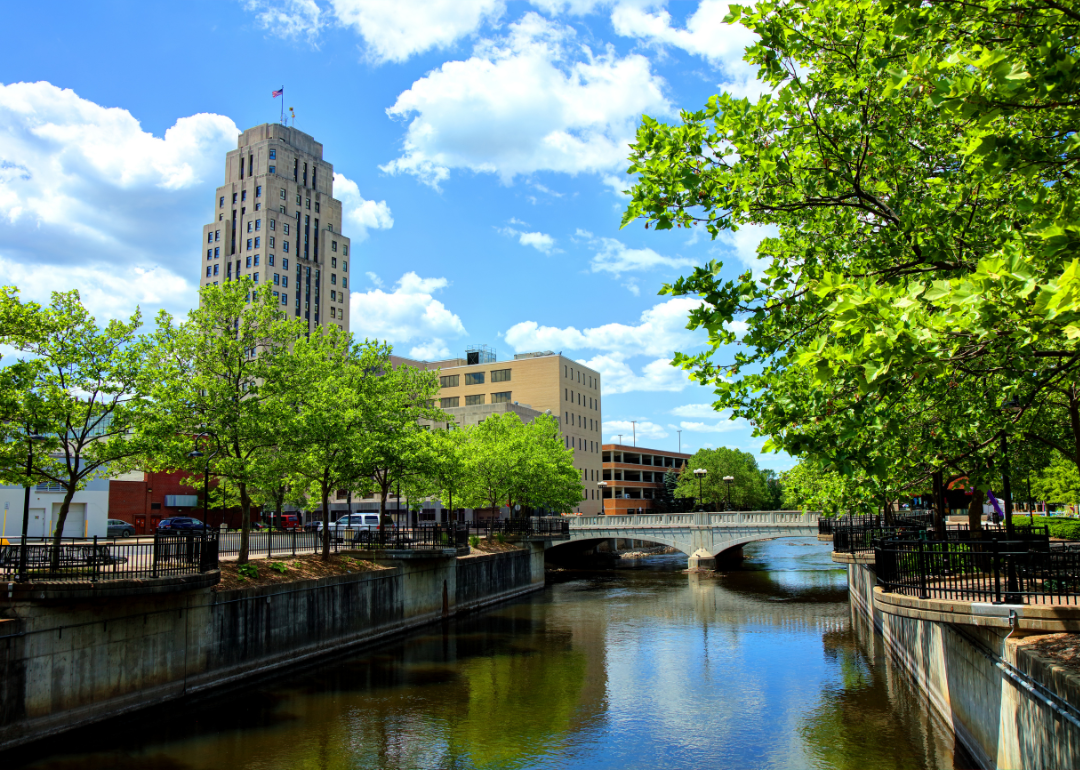
#10. Calhoun County (tie)
– Life expectancy: 74.4 years
— 2.2 years lower than the state average
About
Calhoun County lies in southern Michigan, where rolling farmland, rivers, and woodlands frame its communities. Battle Creek, the county seat, anchors schools, commerce, and cultural life, while Marshall reflects the region’s historic architecture and civic traditions. The county’s identity blends its natural setting with the influence of both historic and modern institutions.
Its history includes farming, milling, and manufacturing, with Battle Creek rising as a national center for cereal production. Festivals, neighborhood traditions, and community gatherings preserve cultural continuity across generations. Calhoun County continues to stand as a place where geography, history, and community remain firmly interwoven.
Where is Calhoun County?
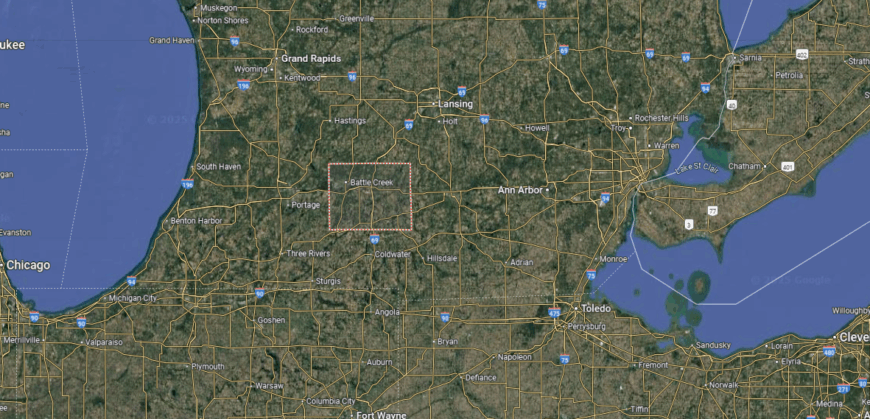
Calhoun County is located in south-central Michigan, about 25 miles east of Kalamazoo and 45 miles south of Lansing. It covers more than 700 square miles of farmland, forests, and river valleys, with the Kalamazoo River flowing across much of its landscape. The county lies along major transportation routes, including Interstates 94 and 69, making it a key regional corridor.
Marshall, the county seat, is positioned near the center and is noted for its historic architecture and role as the governmental hub. Battle Creek, the largest city, anchors the county’s economy and culture, while Albion and Homer provide additional community centers. With its mix of farmland, rivers, and urban centers, Calhoun County reflects both the historic and economic character of southern Michigan.
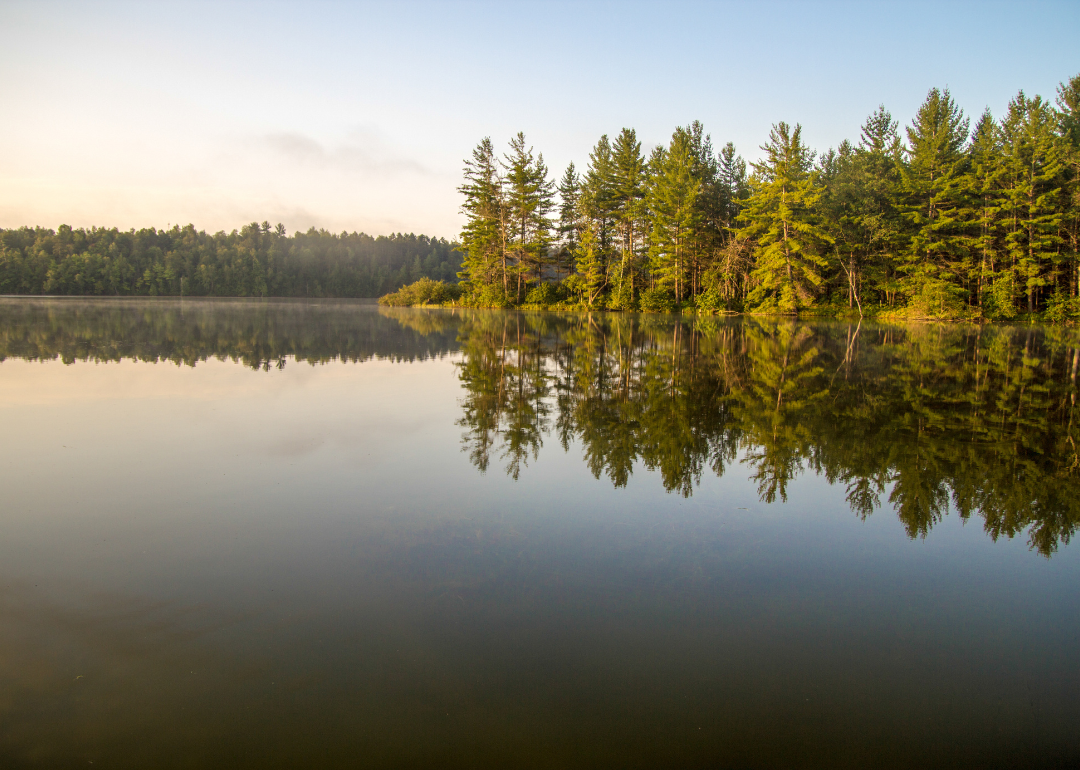
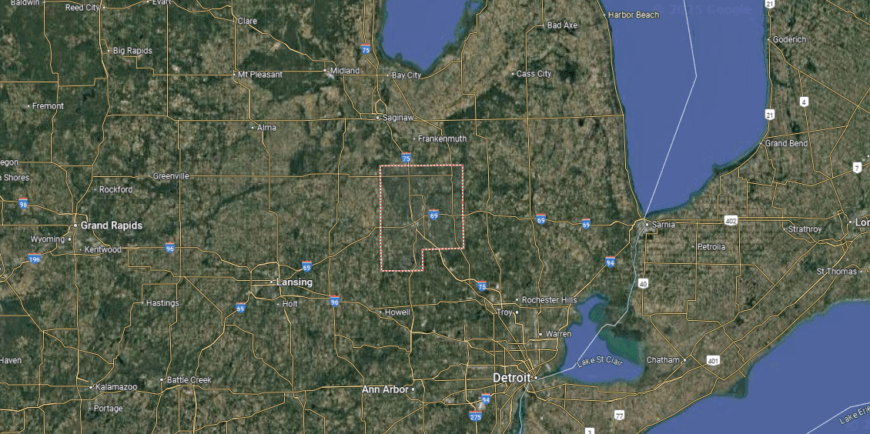
#9. Ogemaw County (tie)
– Life expectancy: 74.4 years
— 2.2 years lower than the state average

About
Ogemaw County’s story is rooted in the lumber industry, when forests and railroads brought settlers to this part of northern Michigan. West Branch, the county seat, developed as a center for schools, commerce, and civic life, carrying forward traditions established during the county’s early years. The county’s identity blends its logging heritage with the steady rhythms of small-town living.
Forests, lakes, and rolling hills define the landscape, offering both livelihood and recreation. Seasonal festivals, outdoor traditions, and family gatherings keep cultural ties strong across generations. Ogemaw County remains a place where history, land, and community stay firmly connected.
Where is Ogemaw County?
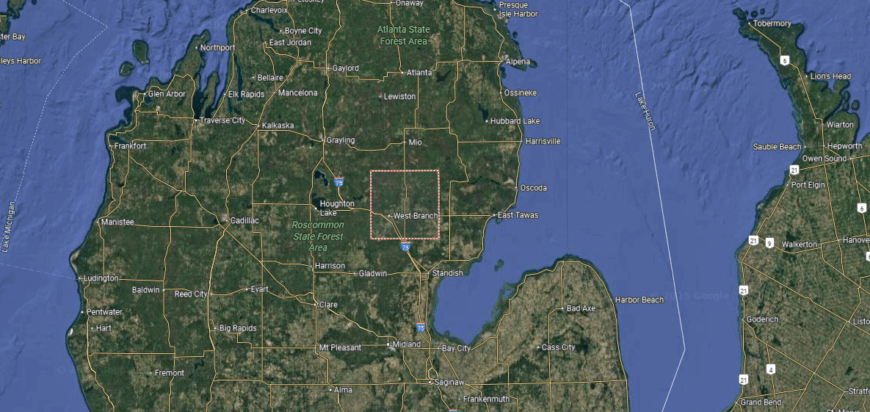
Ogemaw County is located in northeastern Michigan’s Lower Peninsula, about 65 miles north of Bay City. It covers more than 560 square miles of forestland, farmland, and rolling hills, with the Rifle River running through its center. The county lies within a region known for outdoor recreation, with numerous lakes and campgrounds scattered across its landscape.
West Branch, the county seat, sits near the center and serves as the hub for government, commerce, and local services. Smaller communities such as Rose City, Prescott, and Skidway Lake connect the surrounding rural areas. With its wooded terrain, rivers, and small towns, Ogemaw County reflects the natural and recreational character of northern Michigan.
#8. Gladwin County
– Life expectancy: 74.1 years
— 2.5 years lower than the state average
You may also like: The top careers hiring for AI skills in Michigan, according to job postings
About
Gladwin County is shaped by its community-centered traditions, where fairs, church events, and local gatherings highlight the character of northern Michigan life. Gladwin, the county seat, serves as a hub for schools, commerce, and civic activity, linking nearby towns and rural areas. The county’s identity reflects both small-town spirit and the continuity of long-standing customs.
Its history is tied to lumbering and farming, which provided the foundation for settlement and growth. Forests, rivers, and lakes now support both recreation and daily living, offering families a lasting connection to the land. Gladwin County continues to stand as a place where culture, history, and geography remain firmly connected.
Where is Gladwin County?
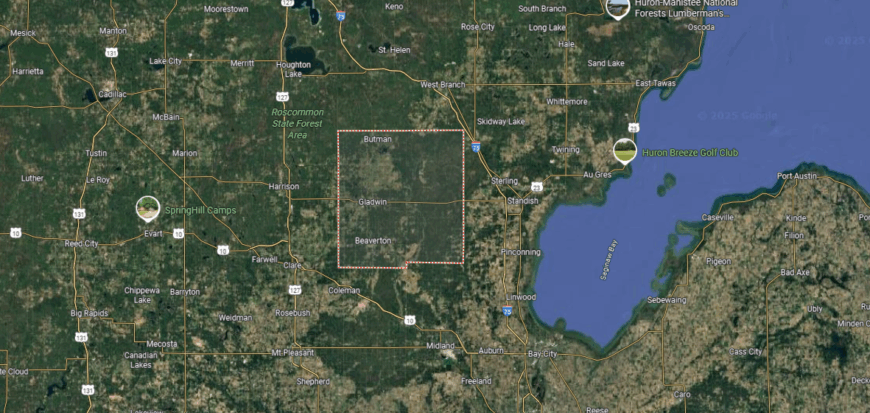
Gladwin County is located in central Michigan, about 30 miles northwest of Midland and 75 miles north of Lansing. It spans just over 500 square miles of farmland, forests, and more than 80 inland lakes, with the Tittabawassee and Cedar Rivers flowing through its landscape. The county is known for its blend of agriculture and outdoor recreation.
Gladwin, the county seat, sits near the center and serves as the hub for government and local commerce. Beaverton, the county’s other city, anchors the southern portion and connects surrounding rural communities. With its mix of rivers, lakes, and small towns, Gladwin County reflects the natural and rural character of mid-Michigan.
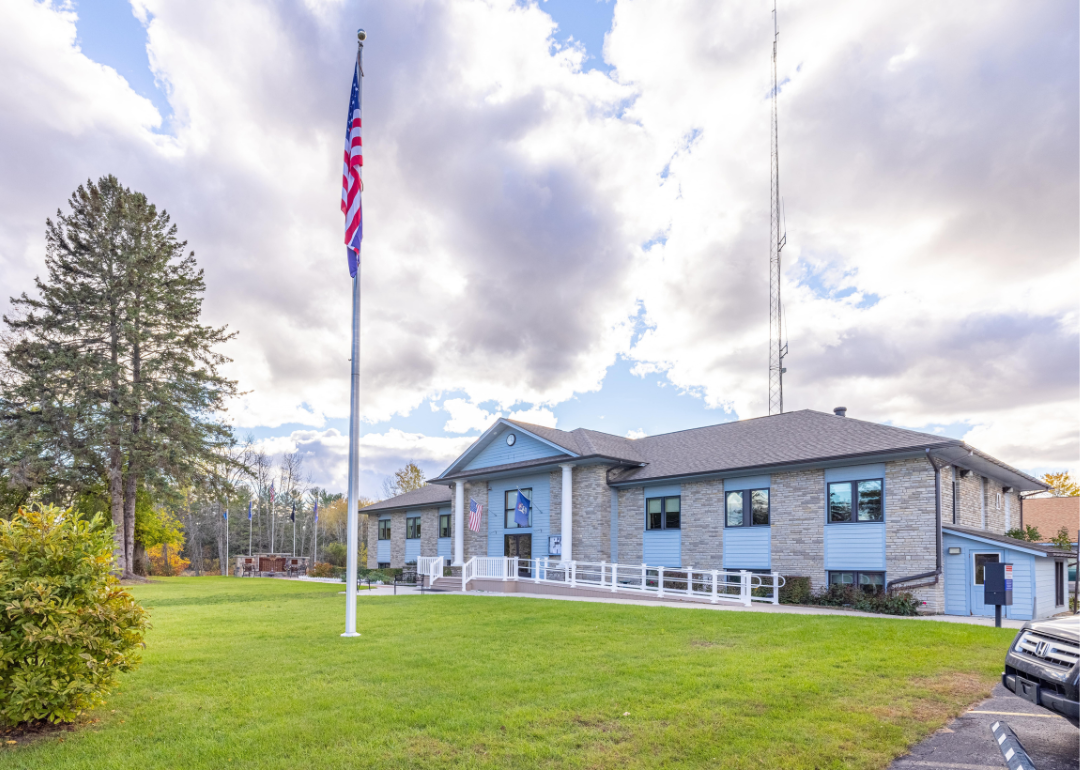
#7. Roscommon County (tie)
– Life expectancy: 74.0 years
— 2.6 years lower than the state average
About
Roscommon County lies in the heart of northern Michigan, where forests, rivers, and lakes form a landscape central to recreation and daily life. Roscommon, the county seat, provides a civic and commercial hub, while Houghton Lake and Higgins Lake highlight the county’s connection to water and tourism. The county’s identity reflects both its natural setting and its role as a gathering place in the region.
Its history is tied to logging and early settlement, industries that guided growth across generations. Today, festivals, outdoor traditions, and family gatherings keep community ties strong throughout the seasons. Roscommon County stands as a place where geography, history, and culture remain firmly interwoven.
Where is Roscommon County?
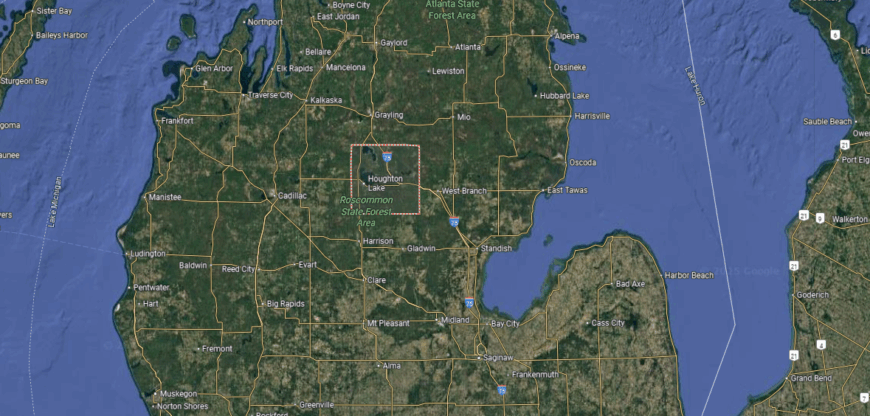
Roscommon County is located in the north-central part of Michigan’s Lower Peninsula. It spans about 520 square miles of forestland, rolling hills, and numerous lakes, including Higgins Lake and Houghton Lake, two of the largest inland lakes in the state. The Muskegon River also begins here, adding to the county’s rich water resources.
Roscommon, the county seat, lies near the center and serves as the hub for government and community life. Other communities such as Houghton Lake, Higgins Lake, and St. Helen anchor the county’s recreational and residential areas. With its lakes, forests, and small-town centers, Roscommon County reflects the outdoor and rural character of northern Michigan.
#6. Montmorency County (tie)
– Life expectancy: 74.0 years
— 2.6 years lower than the state average
About
Montmorency County’s story is tied to the lumbering era, when dense northern forests and rivers brought settlers and fueled early industry. Atlanta, the county seat, grew as a small civic hub for schools, commerce, and community life, carrying forward traditions rooted in the county’s past. The county’s identity reflects both its working heritage and the steady pace of rural Michigan living.
Rolling forests, rivers, and lakes define the landscape, providing opportunities for both livelihood and recreation. Festivals, outdoor traditions, and strong family ties keep cultural connections vibrant across generations. Montmorency County remains a place where history, land, and community continue to shape daily life.
Where is Montmorency County?
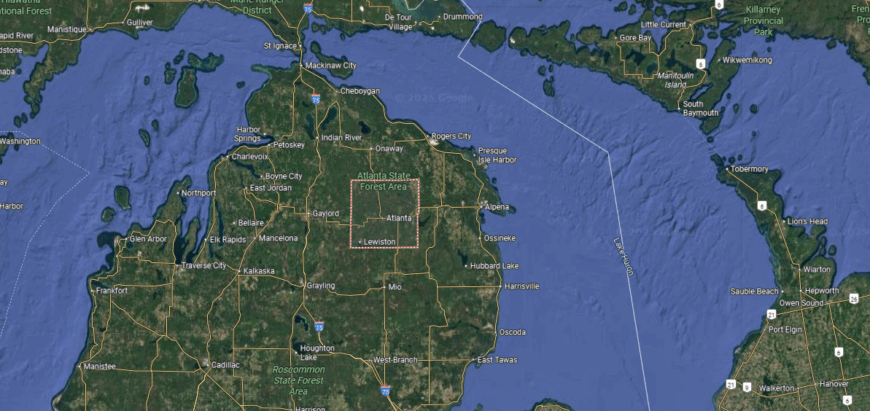
Montmorency County is located in the northeastern part of Michigan’s Lower Peninsula. It covers more than 550 square miles of forestland, farmland, and rivers, much of it within the Thunder Bay River watershed. The county lies about 70 miles southeast of the Mackinac Bridge and is known for its rolling hills and outdoor recreation.
Atlanta, the county seat, is positioned near the center and serves as the hub for government and community life. Smaller communities such as Hillman, Lewiston, and Avery Township are scattered across the wooded countryside. With its forests, lakes, and small towns, Montmorency County reflects the rural and natural character of northern Michigan.
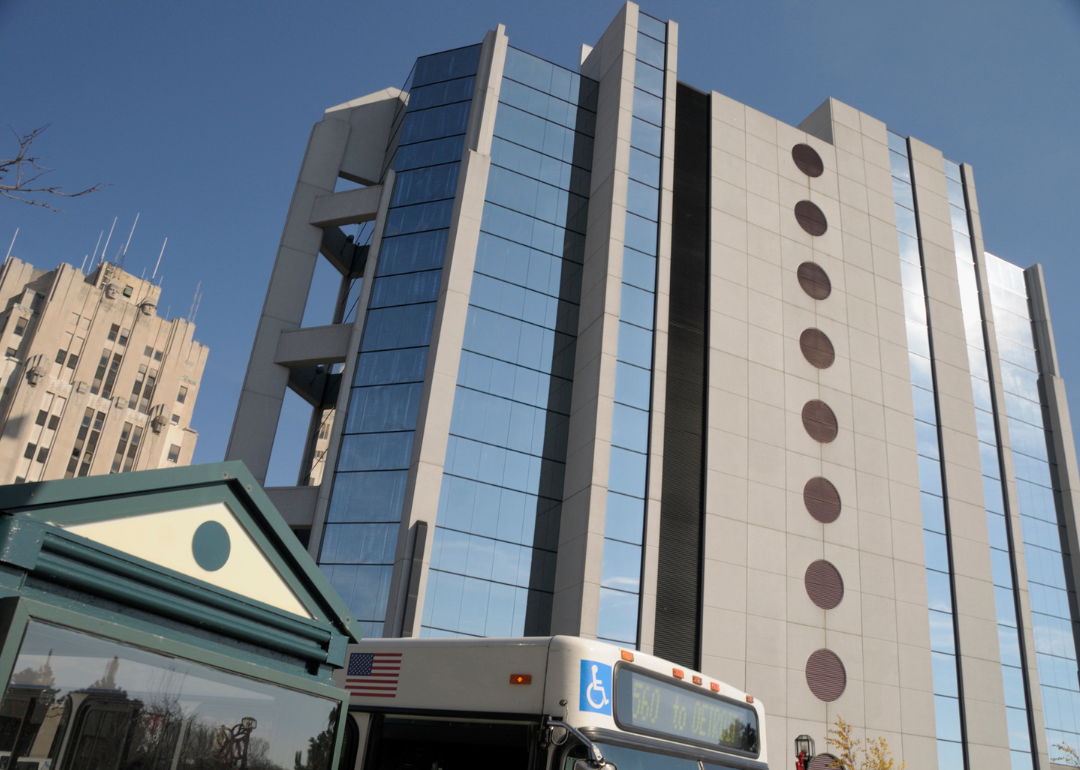
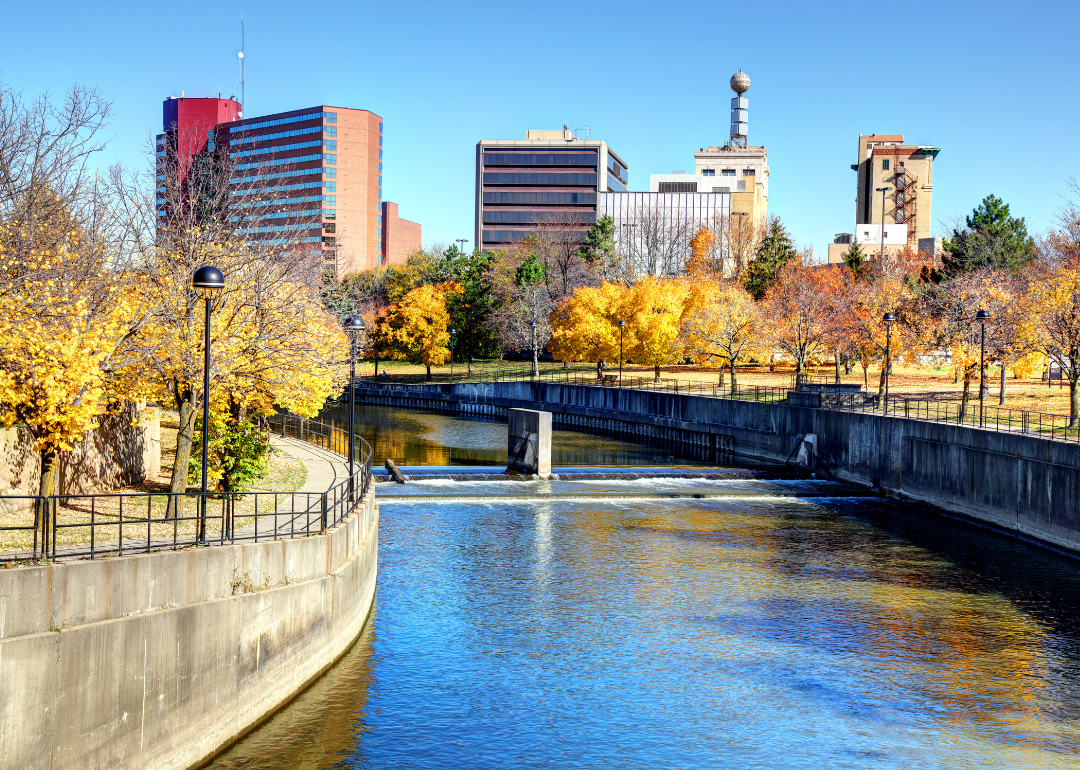
#5. Genesee County
– Life expectancy: 73.9 years
— 2.7 years lower than the state average
About
Genesee County is marked by its strong civic and community spirit, where festivals, neighborhood traditions, and cultural institutions highlight the character of the region. Flint, the county seat, anchors education, commerce, and the arts, serving as a hub for surrounding towns and rural communities. The county’s identity blends small-town connections with the energy of an urban center.
Its history is tied to the auto industry, which shaped settlement, growth, and national recognition. Parks, rivers, and historic neighborhoods provide both recreation and continuity for families across generations. Genesee County remains a place where culture, history, and community life stay firmly connected.
Where is Genesee County?
Genesee County is located in southeastern Michigan, about 60 miles northwest of Detroit and 65 miles northeast of Lansing. It covers more than 640 square miles of farmland, suburban neighborhoods, and urban centers, with the Flint River running through its landscape. The county lies within a heavily populated part of the state, making it a key hub in mid-Michigan.
Flint, the county seat and largest city, anchors government, commerce, and culture in the region. Surrounding communities such as Grand Blanc, Fenton, and Davison add to the county’s suburban and rural mix. With its industrial roots, river valley, and diverse communities, Genesee County reflects both the challenges and strengths of Michigan’s urban and suburban character.
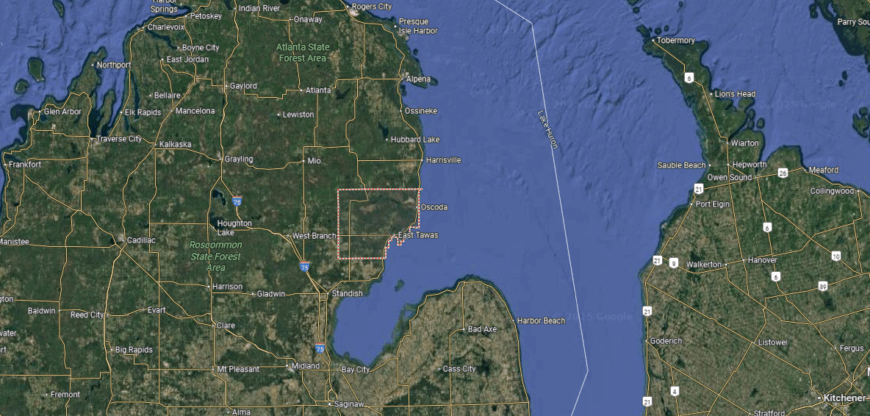
#4. Oscoda County (tie)
– Life expectancy: 73.8 years
— 2.8 years lower than the state average
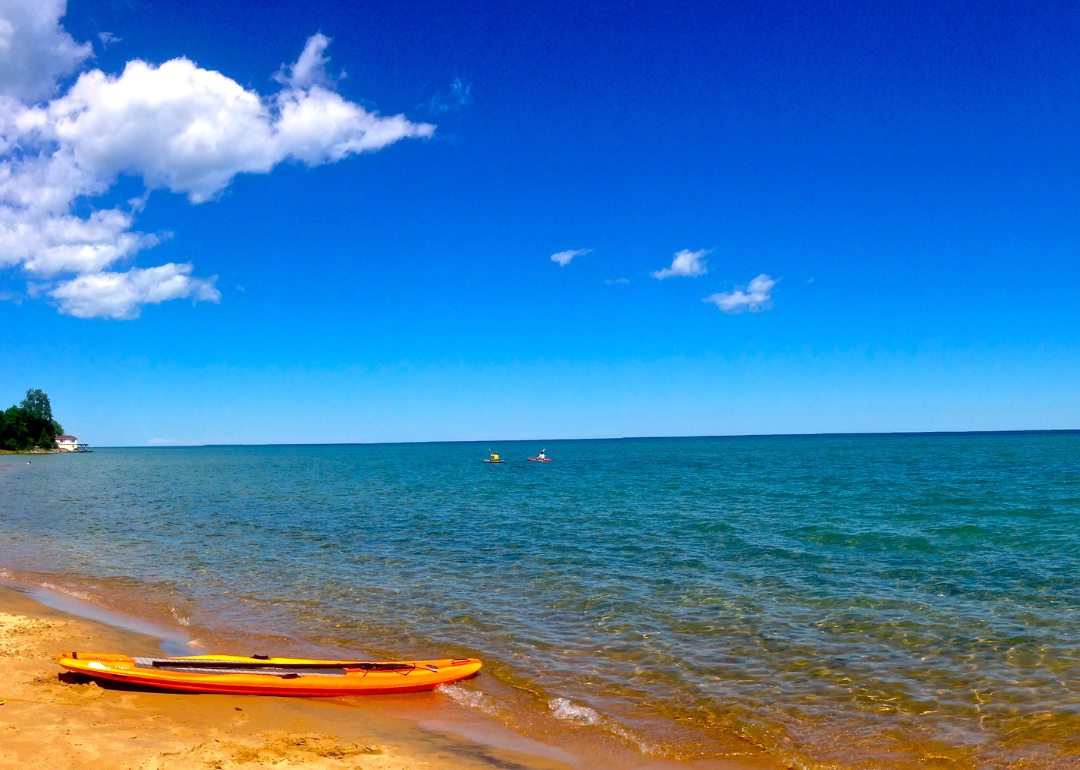
About
Oscoda County lies in northern Michigan, where forests, rivers, and rolling hills define its landscape. Mio, the county seat, anchors schools, commerce, and civic activity, connecting scattered rural communities across the region. The county’s identity reflects both its wooded setting and the traditions of small-town northern life.
Its history is tied to logging and farming, industries that supported settlement and shaped growth across generations. Festivals, outdoor recreation, and strong family ties sustain community pride and continuity. Oscoda County stands as a place where geography, history, and culture remain firmly connected.
Where is Oscoda County?
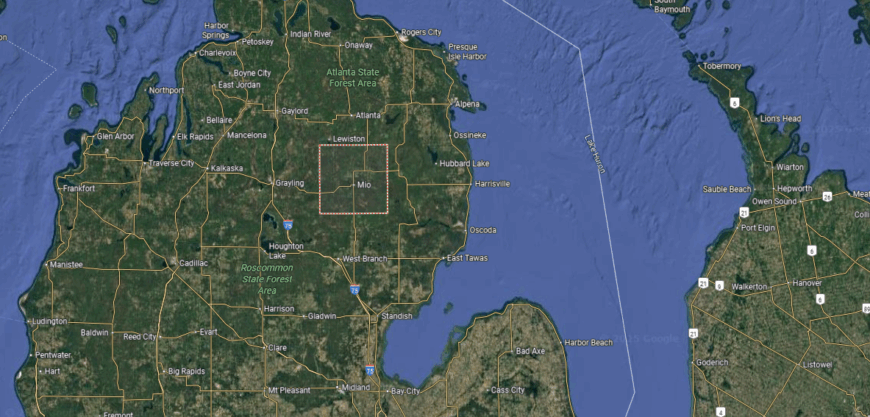
Oscoda County is located in the northern Lower Peninsula of Michigan, about 70 miles west of Alpena. It covers roughly 570 square miles of forestland, rivers, and rolling hills, much of it within the Huron National Forest. The Au Sable River runs across the county, shaping its landscape and supporting recreation.
Mio, the county seat, is positioned near the center and serves as the hub for government and community life. Smaller communities such as Comins, Fairview, and McKinley are scattered through the wooded countryside. With its forests, rivers, and rural setting, Oscoda County reflects the natural and recreational character of northern Michigan.
#3. Iosco County (tie)
– Life expectancy: 73.8 years
— 2.8 years lower than the state average
You may also like: Best amusement parks in Michigan

About
Iosco County’s story is rooted in the lumber trade and shipping routes of Lake Huron, which drew settlers and fueled growth in the 19th century. Tawas City, the county seat, and East Tawas together reflect this heritage, serving as centers for commerce, schools, and community traditions. The county’s identity blends its industrial past with the enduring spirit of lakeshore living.
The Lake Huron shoreline, inland rivers, and forests provide both livelihood and recreation for residents. Festivals, outdoor traditions, and family gatherings help preserve cultural continuity across generations. Iosco County continues to stand as a place where history, land, and community remain closely connected.
Where is Iosco County?
Iosco County is located in northeastern Michigan along the shore of Lake Huron. It covers just over 550 square miles, with a landscape of sandy shoreline, forestland, and inland lakes, much of it within the Huron National Forest. The Au Sable River flows through the county and empties into Lake Huron, shaping both its geography and recreation.
Tawas City, the county seat, sits on the Lake Huron shoreline and serves as the hub for government and local services. East Tawas, Oscoda, and Hale are other key communities that connect the inland and coastal areas. With its mix of lakefront, rivers, and forested land, Iosco County reflects the natural character of Michigan’s northeastern Lower Peninsula.
#2. Wayne County
– Life expectancy: 73.4 years
— 3.2 years lower than the state average
About
Wayne County is defined by its vibrant cultural life, where festivals, music, and neighborhood traditions reflect the diversity of southeastern Michigan. Detroit, the county seat, anchors education, commerce, and the arts, serving as both a national center of culture and a hub for local communities. The county’s identity blends small-town connections combined with the energy of one of America’s great cities.
Its history is tied to industry, immigration, and innovation, with the auto industry shaping both national identity and local growth. The Detroit River, parks, and historic neighborhoods provide continuity and character for generations of families. Wayne County remains a place where culture, history, and community remain inseparably linked.
Where is Wayne County?
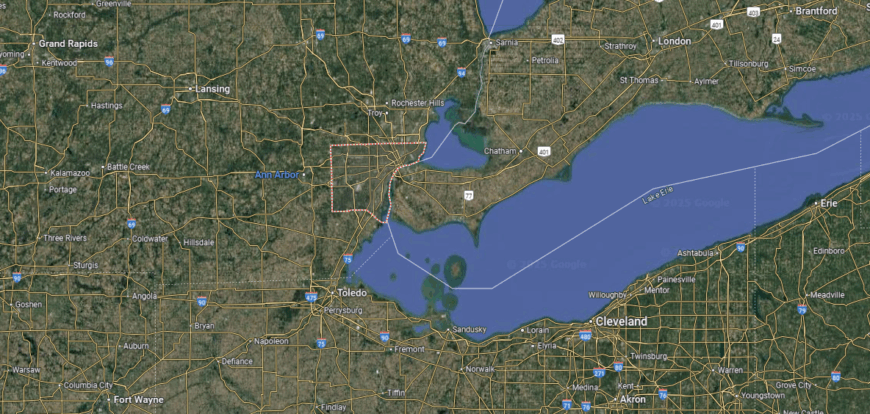
Wayne County is located in southeastern Michigan along the Detroit River, which forms part of the border with Ontario, Canada. It spans more than 670 square miles of urban, suburban, and industrial landscapes, with Lake St. Clair to the northeast and the Detroit River to the southeast. The county lies at the heart of the Detroit metropolitan area and serves as a major hub for transportation and commerce.
Detroit, the county seat and largest city, anchors the region as Michigan’s largest urban center and cultural capital. Other communities such as Dearborn, Livonia, and Taylor contribute to the county’s suburban and economic diversity. With its riverfront, international border, and metropolitan core, Wayne County plays a central role in the economic and cultural life of Michigan.
#1. Clare County
– Life expectancy: 73.3 years
— 3.3 years lower than the state average
About
Clare County lies in central Michigan, where forests, rivers, and farmland shape its scenery and way of life. Harrison, the county seat, provides a hub for schools, commerce, and civic traditions, while Clare reflects the county’s small-town heritage and cultural identity. The county’s character blends its natural setting with the steady pace of rural living.
Its history is tied to logging and farming, industries that supported settlement and growth over time. Festivals, outdoor recreation, and family-centered traditions sustain cultural pride across generations. Clare County continues to stand as a place where geography, history, and community remain firmly connected.
Where is Clare County?
Clare County is located in the central Lower Peninsula of Michigan, about 65 miles north of Lansing and 75 miles south of Cadillac. It covers just over 570 square miles of farmland, forests, and more than 50 inland lakes. The Muskegon River flows through the county, adding to its natural resources and recreation opportunities.
Harrison, the county seat, sits near the center and serves as the hub for government and community life. Clare, another key city, anchors the southern part of the county and provides commercial and cultural activity. With its mix of lakes, rivers, and small towns, Clare County reflects the rural and recreational character of mid-Michigan.
This story features data reporting by Karim Noorani, writing by Kiersten Hickman, and is part of a series utilizing data automation across 49 states.
By Stacker